Zip Codes with the Highest Percentage of Population with a Degree in Liberal Arts and History in Danville, CA
RELATED REPORTS & OPTIONS
Liberal Arts and History
Danville
Compare Zip Codes
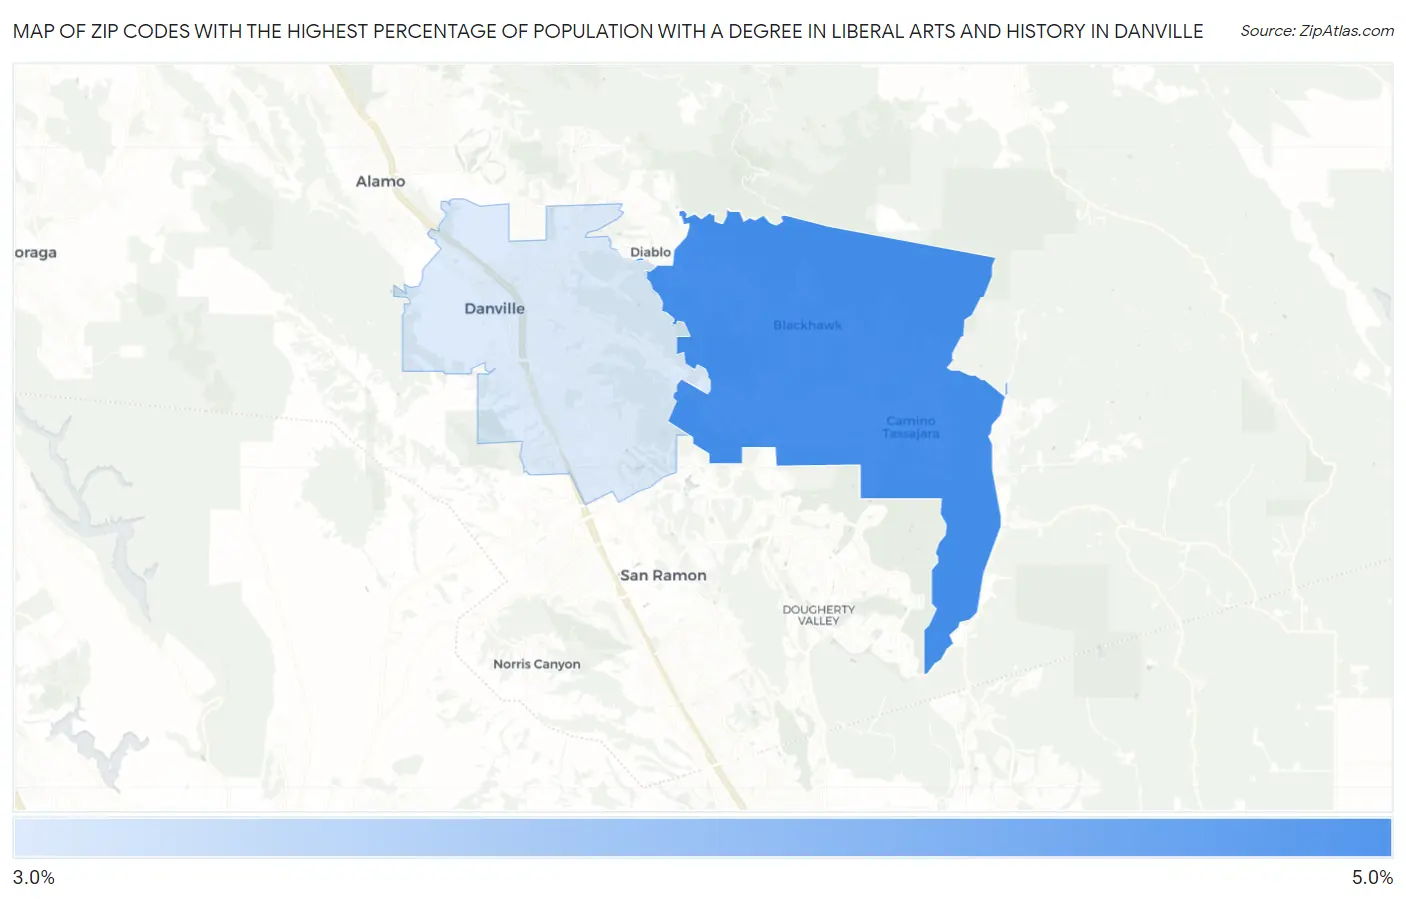
Map of Zip Codes with the Highest Percentage of Population with a Degree in Liberal Arts and History in Danville
3.3%
4.9%
Zip Codes with the Highest Percentage of Population with a Degree in Liberal Arts and History in Danville, CA
| Zip Code | % Graduates | vs State | vs National | |
| 1. | 94506 | 4.9% | 5.5%(-0.551)#986 | 4.9%(+0.073)#11,516 |
| 2. | 94526 | 3.3% | 5.5%(-2.17)#1,307 | 4.9%(-1.55)#17,233 |
1
Common Questions
What are the Top Zip Codes with the Highest Percentage of Population with a Degree in Liberal Arts and History in Danville, CA?
Top Zip Codes with the Highest Percentage of Population with a Degree in Liberal Arts and History in Danville, CA are:
What zip code has the Highest Percentage of Population with a Degree in Liberal Arts and History in Danville, CA?
94506 has the Highest Percentage of Population with a Degree in Liberal Arts and History in Danville, CA with 4.9%.
What is the Percentage of Population with a Degree in Liberal Arts and History in Danville, CA?
Percentage of Population with a Degree in Liberal Arts and History in Danville is 3.6%.
What is the Percentage of Population with a Degree in Liberal Arts and History in California?
Percentage of Population with a Degree in Liberal Arts and History in California is 5.5%.
What is the Percentage of Population with a Degree in Liberal Arts and History in the United States?
Percentage of Population with a Degree in Liberal Arts and History in the United States is 4.9%.