Zip Codes with the Highest Percentage of Population Employed in Real Estate, Rental & Leasing in Malibu, CA
RELATED REPORTS & OPTIONS
Real Estate, Rental & Leasing
Malibu
Compare Zip Codes
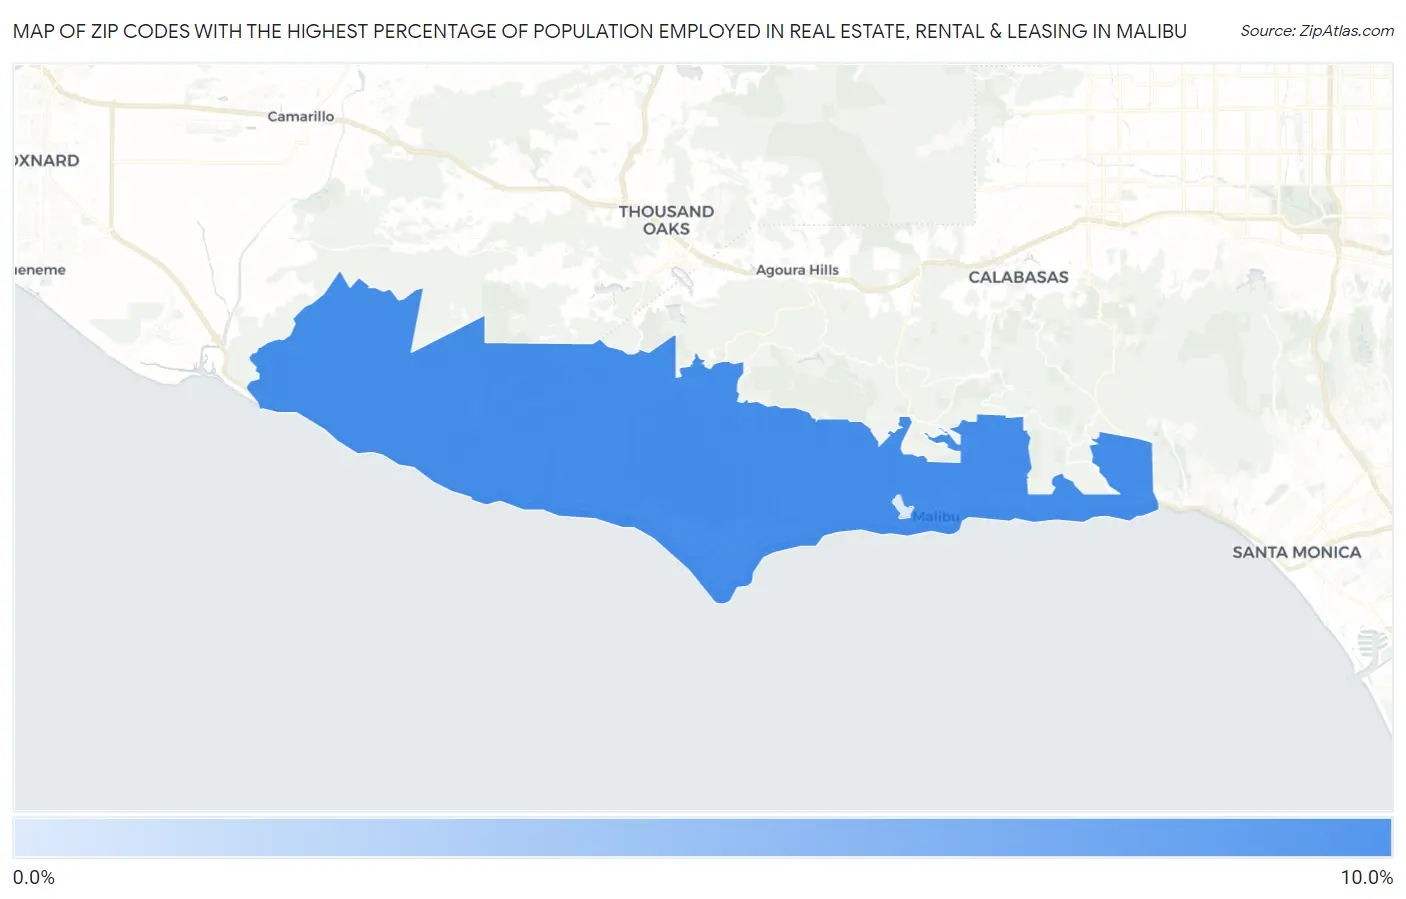
Map of Zip Codes with the Highest Percentage of Population Employed in Real Estate, Rental & Leasing in Malibu
0.47%
8.3%
Zip Codes with the Highest Percentage of Population Employed in Real Estate, Rental & Leasing in Malibu, CA
| Zip Code | % Employed | vs State | vs National | |
| 1. | 90265 | 8.3% | 2.1%(+6.15)#48 | 1.9%(+6.37)#520 |
| 2. | 90263 | 0.47% | 2.1%(-1.65)#1,316 | 1.9%(-1.42)#19,299 |
1
Common Questions
What are the Top Zip Codes with the Highest Percentage of Population Employed in Real Estate, Rental & Leasing in Malibu, CA?
Top Zip Codes with the Highest Percentage of Population Employed in Real Estate, Rental & Leasing in Malibu, CA are:
What zip code has the Highest Percentage of Population Employed in Real Estate, Rental & Leasing in Malibu, CA?
90265 has the Highest Percentage of Population Employed in Real Estate, Rental & Leasing in Malibu, CA with 8.3%.
What is the Percentage of Population Employed in Real Estate, Rental & Leasing in Malibu, CA?
Percentage of Population Employed in Real Estate, Rental & Leasing in Malibu is 7.8%.
What is the Percentage of Population Employed in Real Estate, Rental & Leasing in California?
Percentage of Population Employed in Real Estate, Rental & Leasing in California is 2.1%.
What is the Percentage of Population Employed in Real Estate, Rental & Leasing in the United States?
Percentage of Population Employed in Real Estate, Rental & Leasing in the United States is 1.9%.