Troutville, VA Map & Demographics
Troutville Map
Troutville Overview
$34,208
PER CAPITA INCOME
$62,273
AVG FAMILY INCOME
$51,844
AVG HOUSEHOLD INCOME
42.9%
WAGE / INCOME GAP [ % ]
57.1¢/ $1
WAGE / INCOME GAP [ $ ]
0.38
INEQUALITY / GINI INDEX
467
TOTAL POPULATION
246
MALE POPULATION
221
FEMALE POPULATION
111.31
MALES / 100 FEMALES
89.84
FEMALES / 100 MALES
49.1
MEDIAN AGE
2.6
AVG FAMILY SIZE
1.9
AVG HOUSEHOLD SIZE
218
LABOR FORCE [ PEOPLE ]
52.4%
PERCENT IN LABOR FORCE
1.4%
UNEMPLOYMENT RATE
Troutville Zip Codes
Troutville Area Codes
Income in Troutville
Income Overview in Troutville
Per Capita Income in Troutville is $34,208, while median incomes of families and households are $62,273 and $51,844 respectively.
| Characteristic | Number | Measure |
| Per Capita Income | 467 | $34,208 |
| Median Family Income | 122 | $62,273 |
| Mean Family Income | 122 | $85,252 |
| Median Household Income | 245 | $51,844 |
| Mean Household Income | 245 | $63,713 |
| Income Deficit | 122 | $0 |
| Wage / Income Gap (%) | 467 | 42.90% |
| Wage / Income Gap ($) | 467 | 57.10¢ per $1 |
| Gini / Inequality Index | 467 | 0.38 |
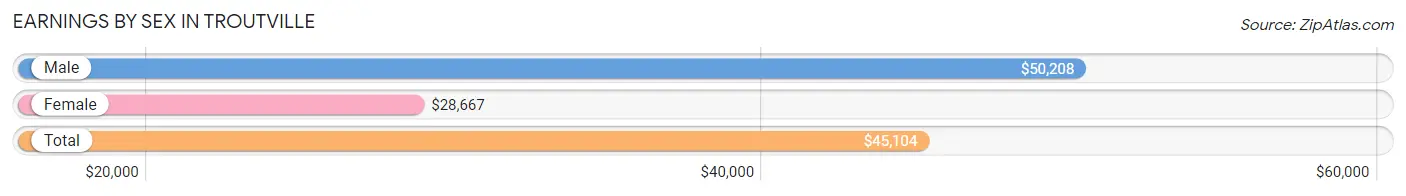
Earnings by Sex in Troutville
Average Earnings in Troutville are $45,104, $50,208 for men and $28,667 for women, a difference of 42.9%.
| Sex | Number | Average Earnings |
| Male | 147 (63.6%) | $50,208 |
| Female | 84 (36.4%) | $28,667 |
| Total | 231 (100.0%) | $45,104 |
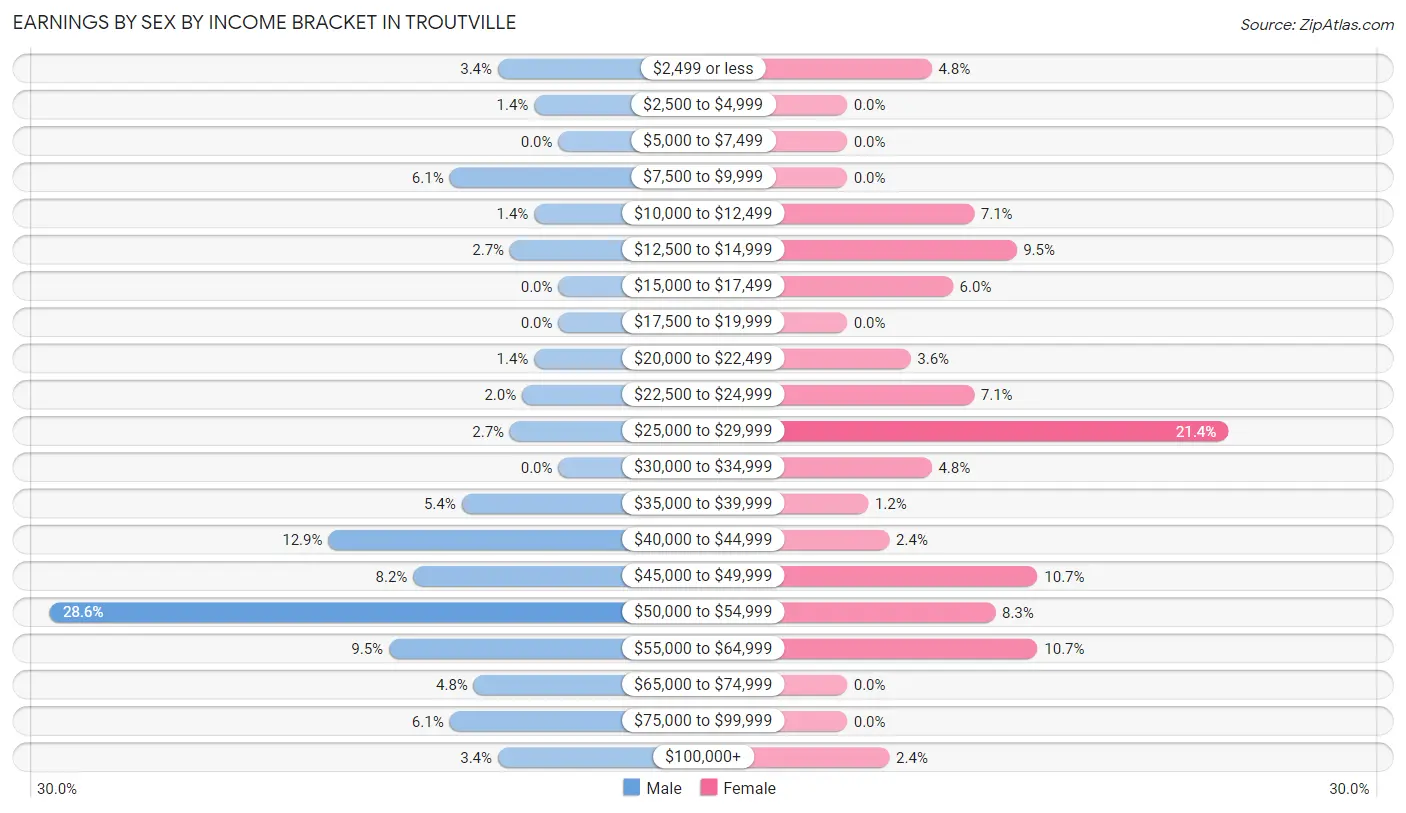
Earnings by Sex by Income Bracket in Troutville
The most common earnings brackets in Troutville are $50,000 to $54,999 for men (42 | 28.6%) and $25,000 to $29,999 for women (18 | 21.4%).
| Income | Male | Female |
| $2,499 or less | 5 (3.4%) | 4 (4.8%) |
| $2,500 to $4,999 | 2 (1.4%) | 0 (0.0%) |
| $5,000 to $7,499 | 0 (0.0%) | 0 (0.0%) |
| $7,500 to $9,999 | 9 (6.1%) | 0 (0.0%) |
| $10,000 to $12,499 | 2 (1.4%) | 6 (7.1%) |
| $12,500 to $14,999 | 4 (2.7%) | 8 (9.5%) |
| $15,000 to $17,499 | 0 (0.0%) | 5 (5.9%) |
| $17,500 to $19,999 | 0 (0.0%) | 0 (0.0%) |
| $20,000 to $22,499 | 2 (1.4%) | 3 (3.6%) |
| $22,500 to $24,999 | 3 (2.0%) | 6 (7.1%) |
| $25,000 to $29,999 | 4 (2.7%) | 18 (21.4%) |
| $30,000 to $34,999 | 0 (0.0%) | 4 (4.8%) |
| $35,000 to $39,999 | 8 (5.4%) | 1 (1.2%) |
| $40,000 to $44,999 | 19 (12.9%) | 2 (2.4%) |
| $45,000 to $49,999 | 12 (8.2%) | 9 (10.7%) |
| $50,000 to $54,999 | 42 (28.6%) | 7 (8.3%) |
| $55,000 to $64,999 | 14 (9.5%) | 9 (10.7%) |
| $65,000 to $74,999 | 7 (4.8%) | 0 (0.0%) |
| $75,000 to $99,999 | 9 (6.1%) | 0 (0.0%) |
| $100,000+ | 5 (3.4%) | 2 (2.4%) |
| Total | 147 (100.0%) | 84 (100.0%) |
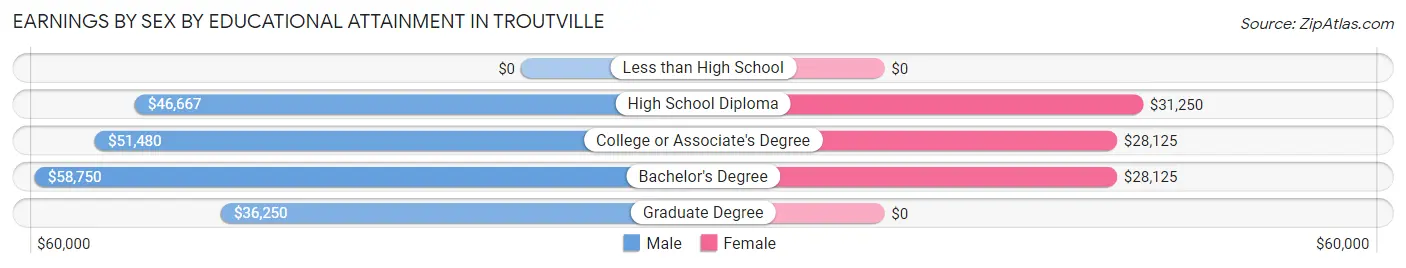
Earnings by Sex by Educational Attainment in Troutville
Average earnings in Troutville are $50,982 for men and $28,833 for women, a difference of 43.4%. Men with an educational attainment of bachelor's degree enjoy the highest average annual earnings of $58,750, while those with graduate degree education earn the least with $36,250. Women with an educational attainment of high school diploma earn the most with the average annual earnings of $31,250, while those with college or associate's degree education have the smallest earnings of $28,125.
| Educational Attainment | Male Income | Female Income |
| Less than High School | - | - |
| High School Diploma | $46,667 | $31,250 |
| College or Associate's Degree | $51,480 | $28,125 |
| Bachelor's Degree | $58,750 | $28,125 |
| Graduate Degree | $36,250 | $0 |
| Total | $50,982 | $28,833 |
Family Income in Troutville
Family Income Brackets in Troutville
According to the Troutville family income data, there are 30 families falling into the $50,000 to $74,999 income range, which is the most common income bracket and makes up 24.6% of all families.
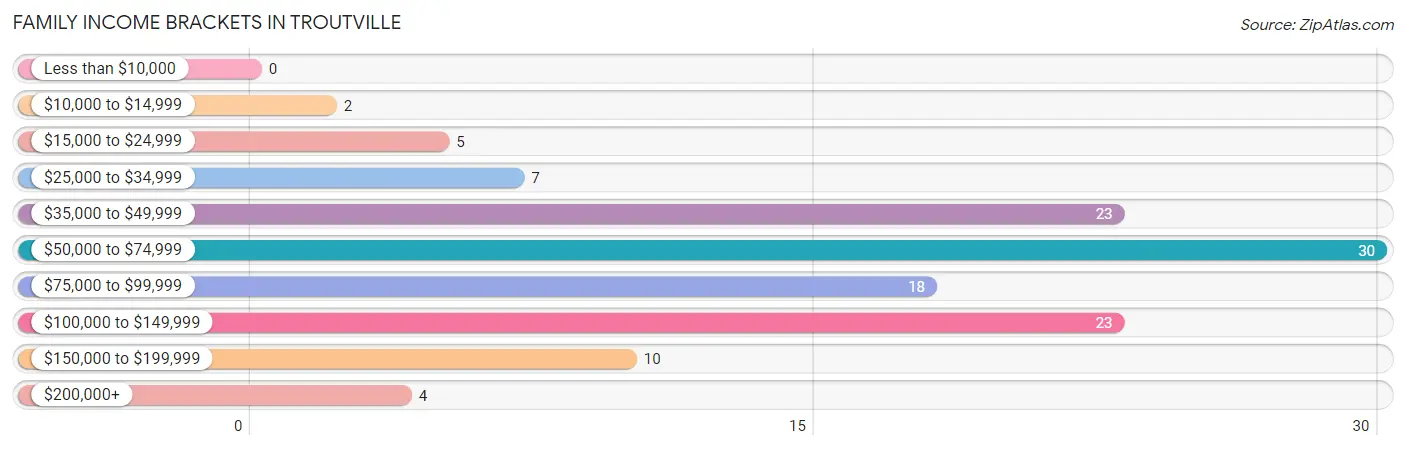
| Income Bracket | # Families | % Families |
| Less than $10,000 | 0 | 0.0% |
| $10,000 to $14,999 | 2 | 1.6% |
| $15,000 to $24,999 | 5 | 4.1% |
| $25,000 to $34,999 | 7 | 5.7% |
| $35,000 to $49,999 | 23 | 18.9% |
| $50,000 to $74,999 | 30 | 24.6% |
| $75,000 to $99,999 | 18 | 14.8% |
| $100,000 to $149,999 | 23 | 18.9% |
| $150,000 to $199,999 | 10 | 8.2% |
| $200,000+ | 4 | 3.3% |
Family Income by Famaliy Size in Troutville
4-person families (9 | 7.4%) account for the highest median family income in Troutville with $148,125 per family, while 4-person families (9 | 7.4%) have the highest median income of $37,031 per family member.
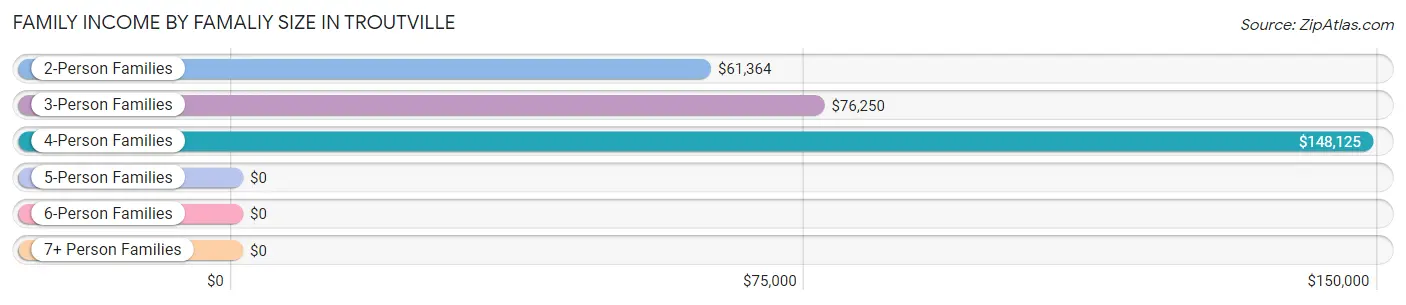
| Income Bracket | # Families | Median Income |
| 2-Person Families | 94 (77.0%) | $61,364 |
| 3-Person Families | 6 (4.9%) | $76,250 |
| 4-Person Families | 9 (7.4%) | $148,125 |
| 5-Person Families | 10 (8.2%) | $0 |
| 6-Person Families | 1 (0.8%) | $0 |
| 7+ Person Families | 2 (1.6%) | $0 |
| Total | 122 (100.0%) | $62,273 |
Family Income by Number of Earners in Troutville
The median family income in Troutville is $62,273, with families comprising 3+ earners (9) having the highest median family income of $154,375, while families with 1 earner (43) have the lowest median family income of $59,219, accounting for 7.4% and 35.2% of families, respectively.
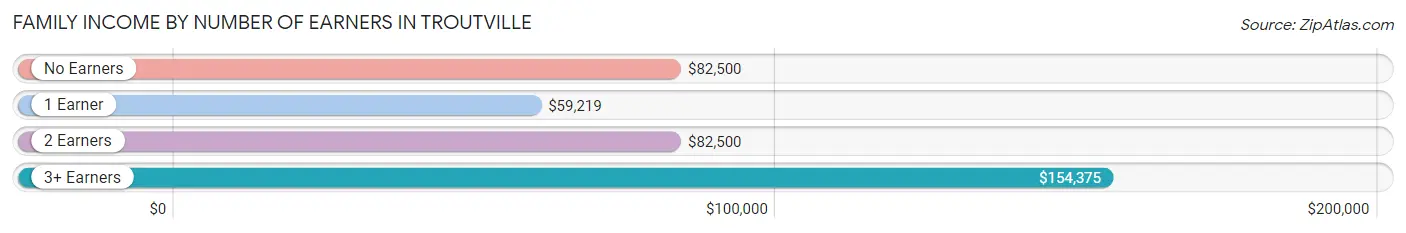
| Number of Earners | # Families | Median Income |
| No Earners | 36 (29.5%) | $82,500 |
| 1 Earner | 43 (35.2%) | $59,219 |
| 2 Earners | 34 (27.9%) | $82,500 |
| 3+ Earners | 9 (7.4%) | $154,375 |
| Total | 122 (100.0%) | $62,273 |
Household Income in Troutville
Household Income Brackets in Troutville
With 85 households falling in the category, the $50,000 to $74,999 income range is the most frequent in Troutville, accounting for 34.7% of all households. In contrast, only 4 households (1.6%) fall into the $200,000+ income bracket, making it the least populous group.
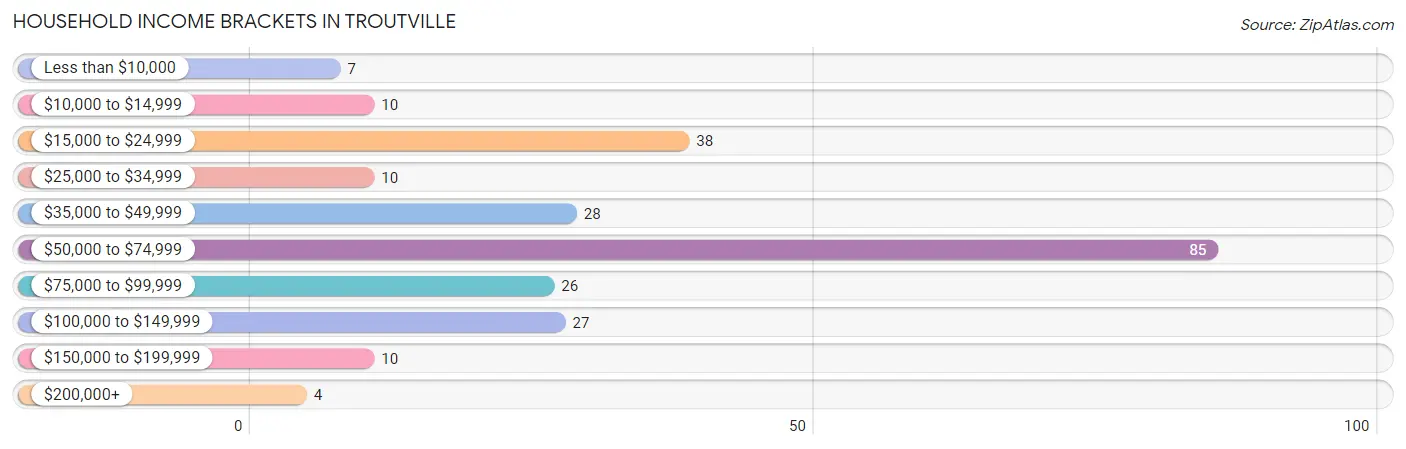
| Income Bracket | # Households | % Households |
| Less than $10,000 | 7 | 2.9% |
| $10,000 to $14,999 | 10 | 4.1% |
| $15,000 to $24,999 | 38 | 15.5% |
| $25,000 to $34,999 | 10 | 4.1% |
| $35,000 to $49,999 | 28 | 11.4% |
| $50,000 to $74,999 | 85 | 34.7% |
| $75,000 to $99,999 | 26 | 10.6% |
| $100,000 to $149,999 | 27 | 11.0% |
| $150,000 to $199,999 | 10 | 4.1% |
| $200,000+ | 4 | 1.6% |
Household Income by Householder Age in Troutville
The median household income in Troutville is $51,844, with the highest median household income of $58,125 found in the 45 to 64 years age bracket for the primary householder. A total of 85 households (34.7%) fall into this category. Meanwhile, the 15 to 24 years age bracket for the primary householder has the lowest median household income of $0, with 8 households (3.3%) in this group.
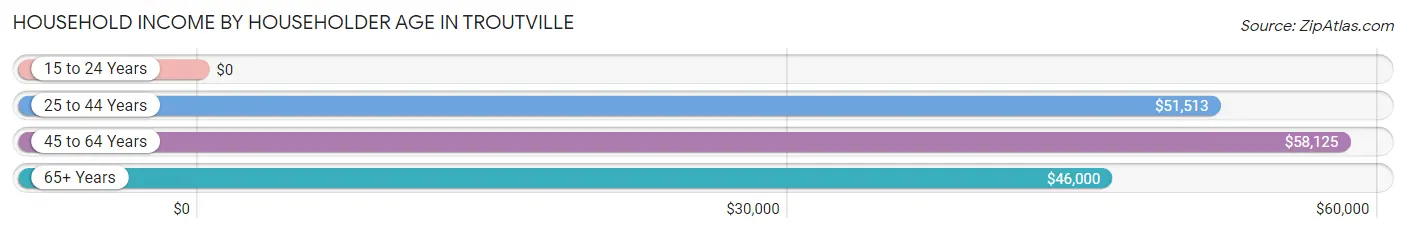
| Income Bracket | # Households | Median Income |
| 15 to 24 Years | 8 (3.3%) | $0 |
| 25 to 44 Years | 74 (30.2%) | $51,513 |
| 45 to 64 Years | 85 (34.7%) | $58,125 |
| 65+ Years | 78 (31.8%) | $46,000 |
| Total | 245 (100.0%) | $51,844 |
Poverty in Troutville
Income Below Poverty by Sex and Age in Troutville
With 8.1% poverty level for males and 4.5% for females among the residents of Troutville, 45 to 54 year old males and 35 to 44 year old females are the most vulnerable to poverty, with 10 males (28.6%) and 4 females (30.8%) in their respective age groups living below the poverty level.
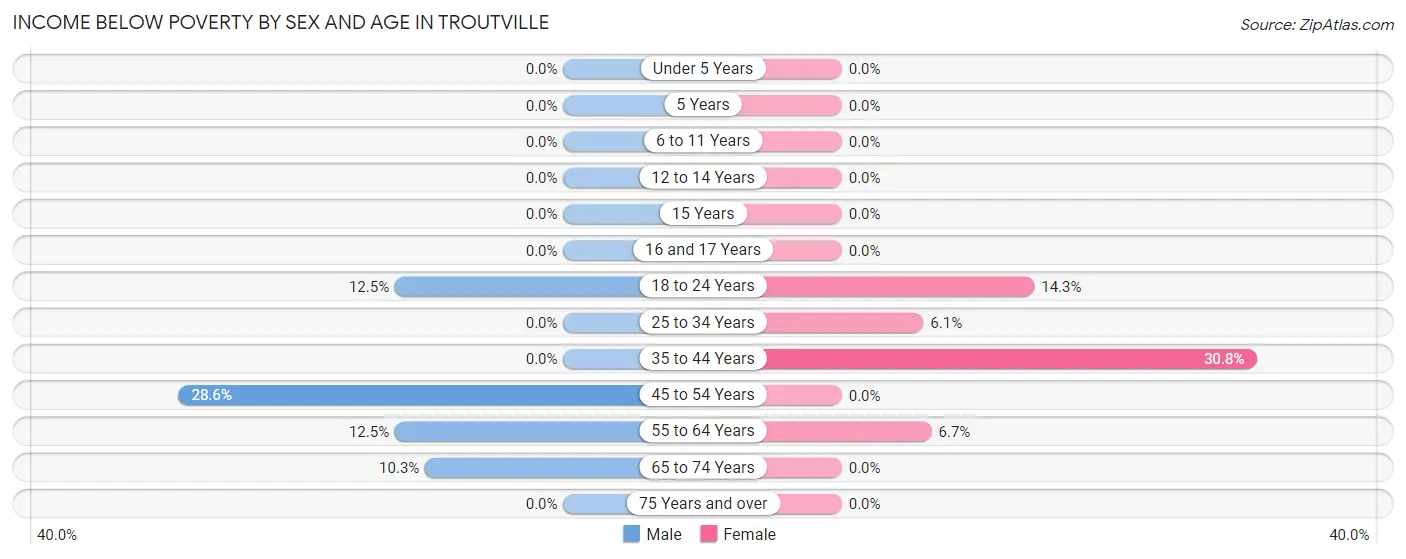
| Age Bracket | Male | Female |
| Under 5 Years | 0 (0.0%) | 0 (0.0%) |
| 5 Years | 0 (0.0%) | 0 (0.0%) |
| 6 to 11 Years | 0 (0.0%) | 0 (0.0%) |
| 12 to 14 Years | 0 (0.0%) | 0 (0.0%) |
| 15 Years | 0 (0.0%) | 0 (0.0%) |
| 16 and 17 Years | 0 (0.0%) | 0 (0.0%) |
| 18 to 24 Years | 3 (12.5%) | 2 (14.3%) |
| 25 to 34 Years | 0 (0.0%) | 2 (6.1%) |
| 35 to 44 Years | 0 (0.0%) | 4 (30.8%) |
| 45 to 54 Years | 10 (28.6%) | 0 (0.0%) |
| 55 to 64 Years | 3 (12.5%) | 2 (6.7%) |
| 65 to 74 Years | 4 (10.3%) | 0 (0.0%) |
| 75 Years and over | 0 (0.0%) | 0 (0.0%) |
| Total | 20 (8.1%) | 10 (4.5%) |
Income Above Poverty by Sex and Age in Troutville
According to the poverty statistics in Troutville, males aged under 5 years and females aged under 5 years are the age groups that are most secure financially, with 100.0% of males and 100.0% of females in these age groups living above the poverty line.
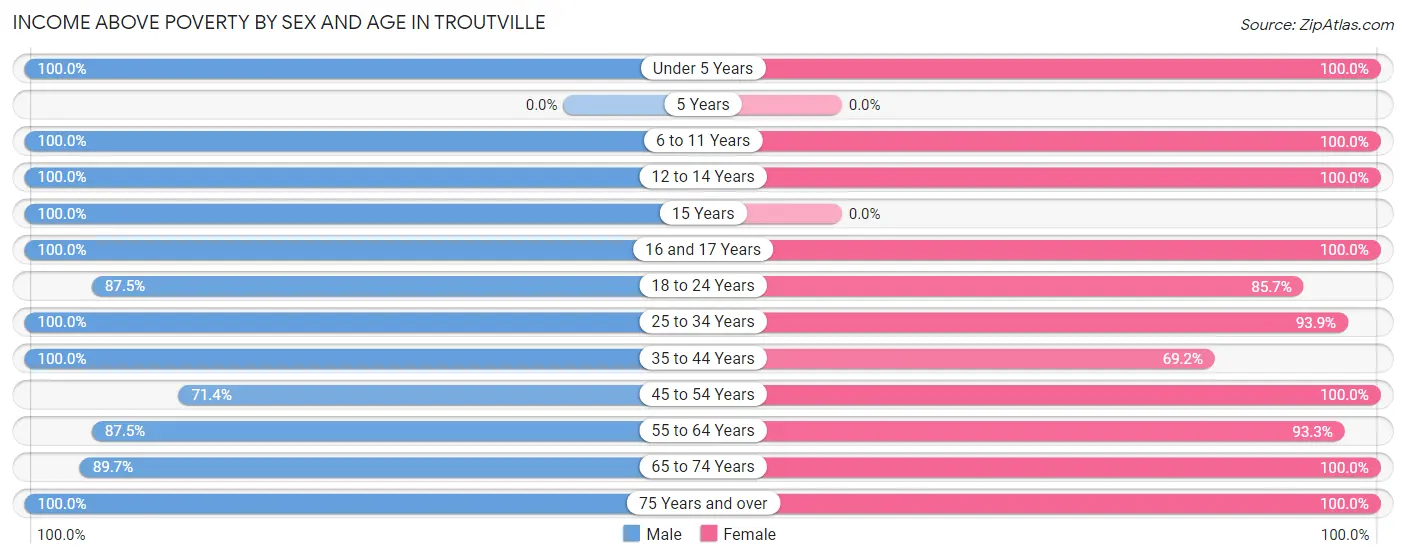
| Age Bracket | Male | Female |
| Under 5 Years | 2 (100.0%) | 7 (100.0%) |
| 5 Years | 0 (0.0%) | 0 (0.0%) |
| 6 to 11 Years | 5 (100.0%) | 9 (100.0%) |
| 12 to 14 Years | 2 (100.0%) | 15 (100.0%) |
| 15 Years | 11 (100.0%) | 0 (0.0%) |
| 16 and 17 Years | 4 (100.0%) | 2 (100.0%) |
| 18 to 24 Years | 21 (87.5%) | 12 (85.7%) |
| 25 to 34 Years | 60 (100.0%) | 31 (93.9%) |
| 35 to 44 Years | 12 (100.0%) | 9 (69.2%) |
| 45 to 54 Years | 25 (71.4%) | 30 (100.0%) |
| 55 to 64 Years | 21 (87.5%) | 28 (93.3%) |
| 65 to 74 Years | 35 (89.7%) | 44 (100.0%) |
| 75 Years and over | 28 (100.0%) | 24 (100.0%) |
| Total | 226 (91.9%) | 211 (95.5%) |
Income Below Poverty Among Married-Couple Families in Troutville
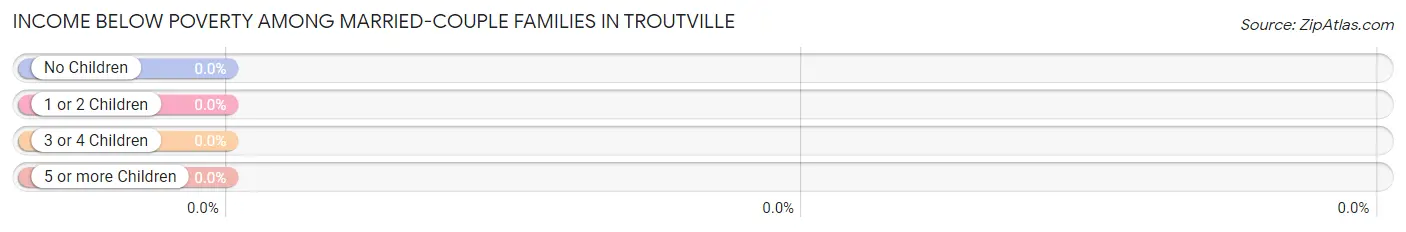
| Children | Above Poverty | Below Poverty |
| No Children | 85 (100.0%) | 0 (0.0%) |
| 1 or 2 Children | 8 (100.0%) | 0 (0.0%) |
| 3 or 4 Children | 12 (100.0%) | 0 (0.0%) |
| 5 or more Children | 0 (0.0%) | 0 (0.0%) |
| Total | 105 (100.0%) | 0 (0.0%) |
Income Below Poverty Among Single-Parent Households in Troutville
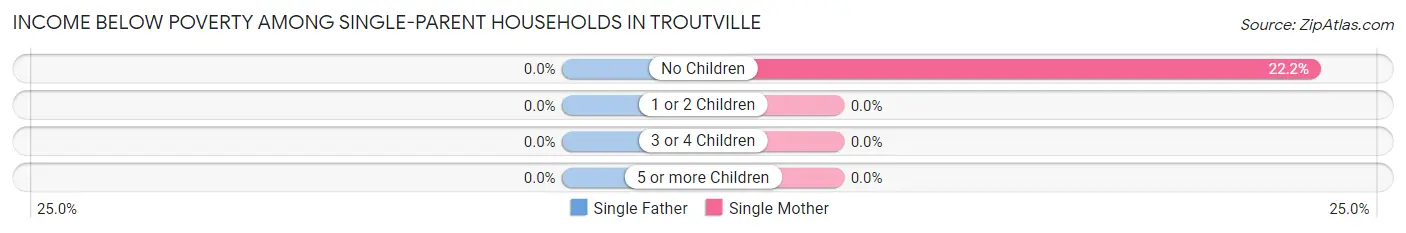
| Children | Single Father | Single Mother |
| No Children | 0 (0.0%) | 2 (22.2%) |
| 1 or 2 Children | 0 (0.0%) | 0 (0.0%) |
| 3 or 4 Children | 0 (0.0%) | 0 (0.0%) |
| 5 or more Children | 0 (0.0%) | 0 (0.0%) |
| Total | 0 (0.0%) | 2 (16.7%) |
Income Below Poverty Among Married-Couple vs Single-Parent Households in Troutville
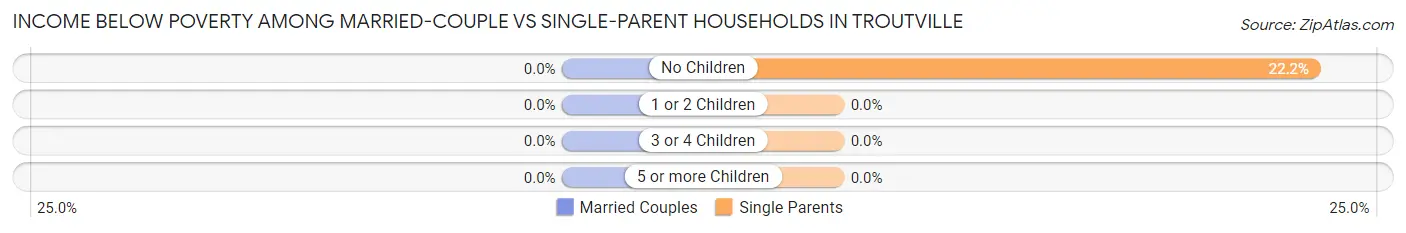
| Children | Married-Couple Families | Single-Parent Households |
| No Children | 0 (0.0%) | 2 (22.2%) |
| 1 or 2 Children | 0 (0.0%) | 0 (0.0%) |
| 3 or 4 Children | 0 (0.0%) | 0 (0.0%) |
| 5 or more Children | 0 (0.0%) | 0 (0.0%) |
| Total | 0 (0.0%) | 2 (11.8%) |
Race in Troutville
The most populous races in Troutville are White / Caucasian (396 | 84.8%), Hispanic or Latino (53 | 11.4%), and Some other Race (43 | 9.2%).
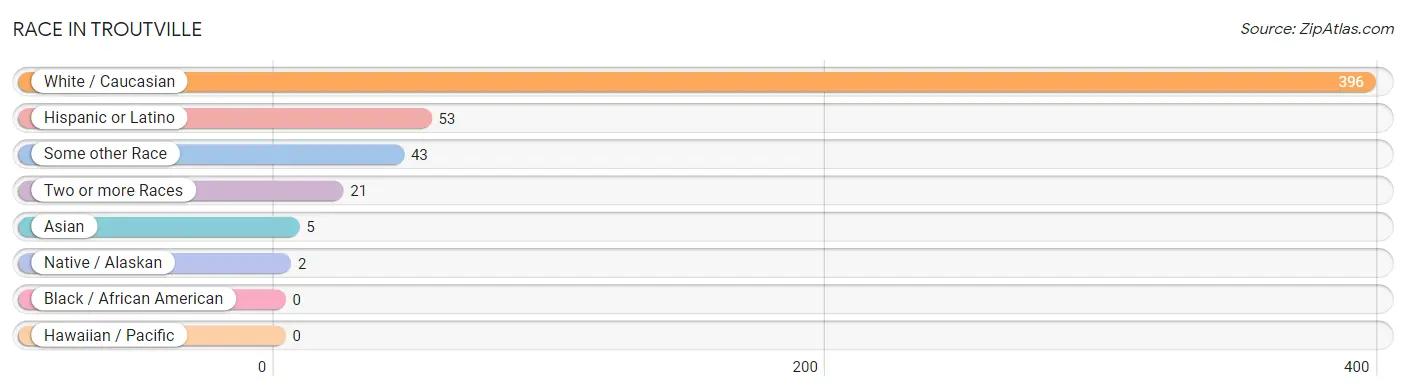
| Race | # Population | % Population |
| Asian | 5 | 1.1% |
| Black / African American | 0 | 0.0% |
| Hawaiian / Pacific | 0 | 0.0% |
| Hispanic or Latino | 53 | 11.4% |
| Native / Alaskan | 2 | 0.4% |
| White / Caucasian | 396 | 84.8% |
| Two or more Races | 21 | 4.5% |
| Some other Race | 43 | 9.2% |
| Total | 467 | 100.0% |
Ancestry in Troutville
The most populous ancestries reported in Troutville are American (66 | 14.1%), Peruvian (38 | 8.1%), South American (38 | 8.1%), Scottish (29 | 6.2%), and Irish (28 | 6.0%), together accounting for 42.6% of all Troutville residents.
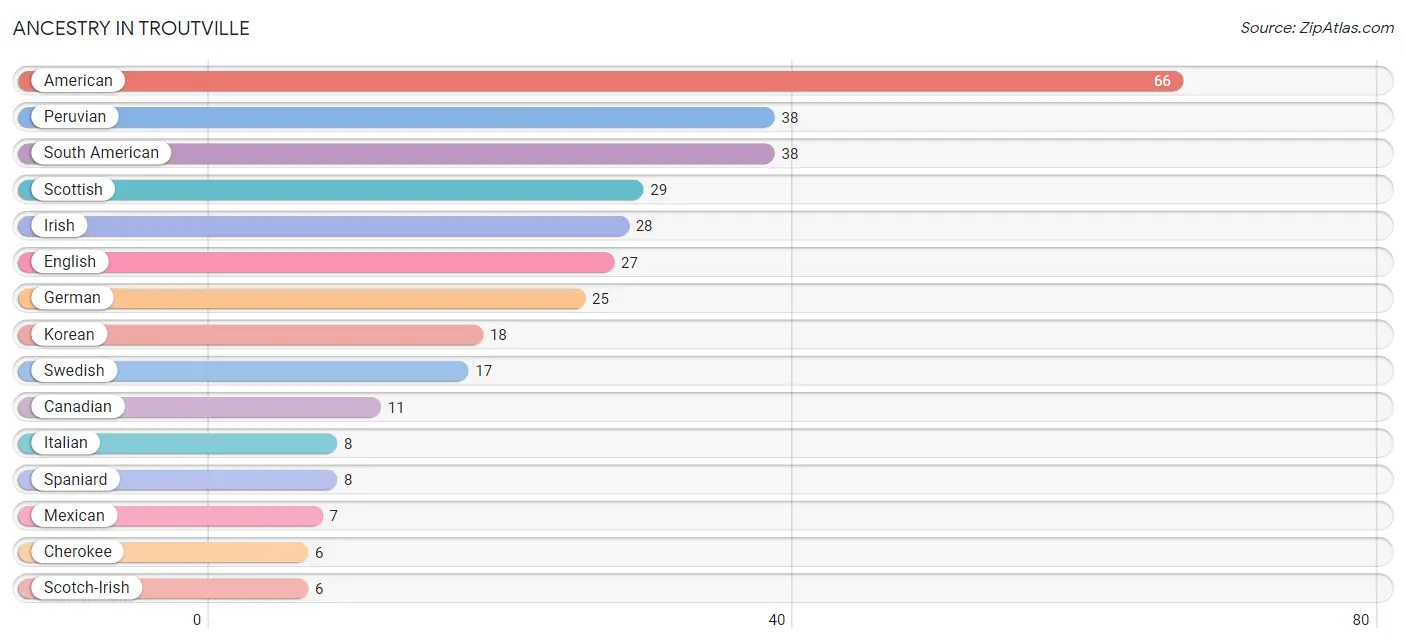
| Ancestry | # Population | % Population |
| American | 66 | 14.1% |
| British | 2 | 0.4% |
| Canadian | 11 | 2.4% |
| Cherokee | 6 | 1.3% |
| Dutch | 2 | 0.4% |
| Eastern European | 2 | 0.4% |
| English | 27 | 5.8% |
| French | 2 | 0.4% |
| French Canadian | 2 | 0.4% |
| German | 25 | 5.3% |
| Irish | 28 | 6.0% |
| Italian | 8 | 1.7% |
| Korean | 18 | 3.8% |
| Mexican | 7 | 1.5% |
| Norwegian | 2 | 0.4% |
| Peruvian | 38 | 8.1% |
| Polish | 2 | 0.4% |
| Scotch-Irish | 6 | 1.3% |
| Scottish | 29 | 6.2% |
| South American | 38 | 8.1% |
| Spaniard | 8 | 1.7% |
| Swedish | 17 | 3.6% |
| Welsh | 4 | 0.9% | View All 23 Rows |
Immigrants in Troutville
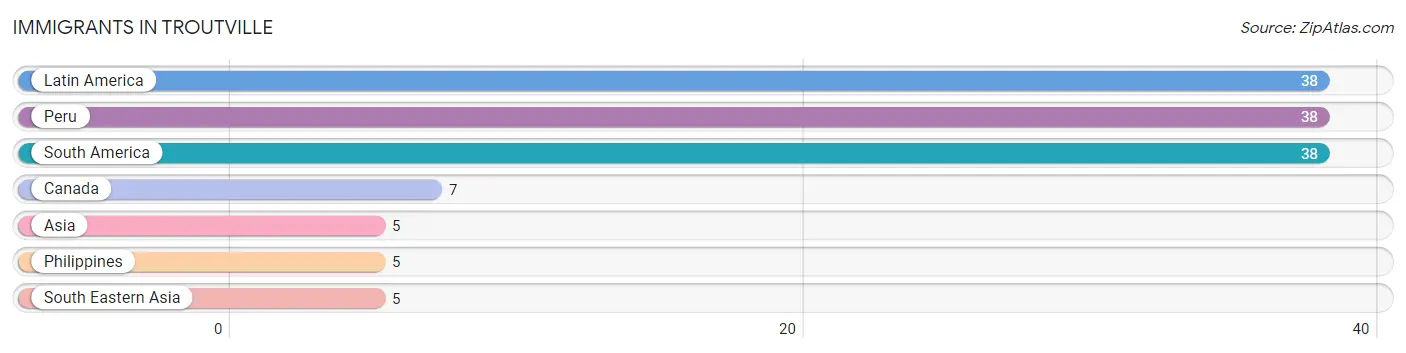
The most numerous immigrant groups reported in Troutville came from Latin America (38 | 8.1%), Peru (38 | 8.1%), South America (38 | 8.1%), Canada (7 | 1.5%), and Asia (5 | 1.1%), together accounting for 27.0% of all Troutville residents.
| Immigration Origin | # Population | % Population |
| Asia | 5 | 1.1% |
| Canada | 7 | 1.5% |
| Latin America | 38 | 8.1% |
| Peru | 38 | 8.1% |
| Philippines | 5 | 1.1% |
| South America | 38 | 8.1% |
| South Eastern Asia | 5 | 1.1% | View All 7 Rows |
Sex and Age in Troutville
Sex and Age in Troutville
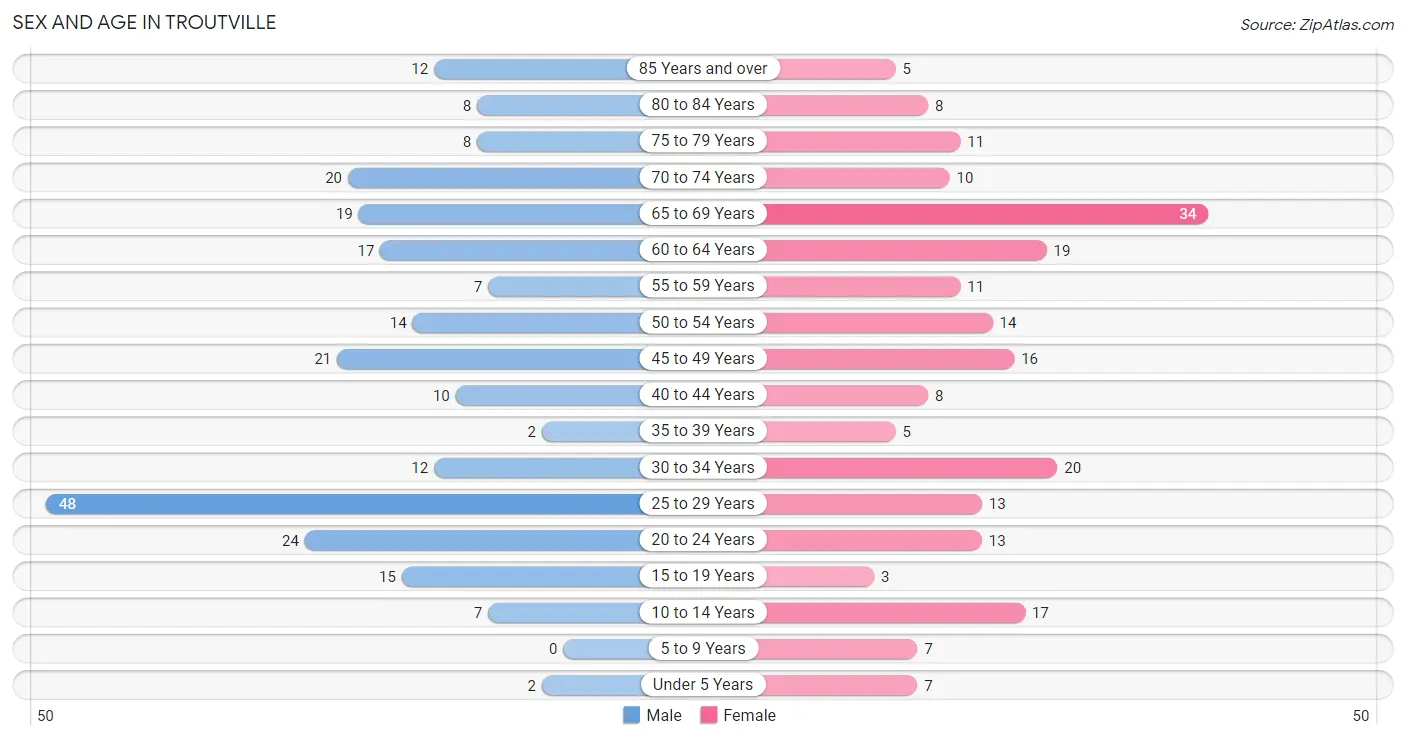
The most populous age groups in Troutville are 25 to 29 Years (48 | 19.5%) for men and 65 to 69 Years (34 | 15.4%) for women.
| Age Bracket | Male | Female |
| Under 5 Years | 2 (0.8%) | 7 (3.2%) |
| 5 to 9 Years | 0 (0.0%) | 7 (3.2%) |
| 10 to 14 Years | 7 (2.9%) | 17 (7.7%) |
| 15 to 19 Years | 15 (6.1%) | 3 (1.4%) |
| 20 to 24 Years | 24 (9.8%) | 13 (5.9%) |
| 25 to 29 Years | 48 (19.5%) | 13 (5.9%) |
| 30 to 34 Years | 12 (4.9%) | 20 (9.0%) |
| 35 to 39 Years | 2 (0.8%) | 5 (2.3%) |
| 40 to 44 Years | 10 (4.1%) | 8 (3.6%) |
| 45 to 49 Years | 21 (8.5%) | 16 (7.2%) |
| 50 to 54 Years | 14 (5.7%) | 14 (6.3%) |
| 55 to 59 Years | 7 (2.9%) | 11 (5.0%) |
| 60 to 64 Years | 17 (6.9%) | 19 (8.6%) |
| 65 to 69 Years | 19 (7.7%) | 34 (15.4%) |
| 70 to 74 Years | 20 (8.1%) | 10 (4.5%) |
| 75 to 79 Years | 8 (3.3%) | 11 (5.0%) |
| 80 to 84 Years | 8 (3.3%) | 8 (3.6%) |
| 85 Years and over | 12 (4.9%) | 5 (2.3%) |
| Total | 246 (100.0%) | 221 (100.0%) |
Families and Households in Troutville
Median Family Size in Troutville
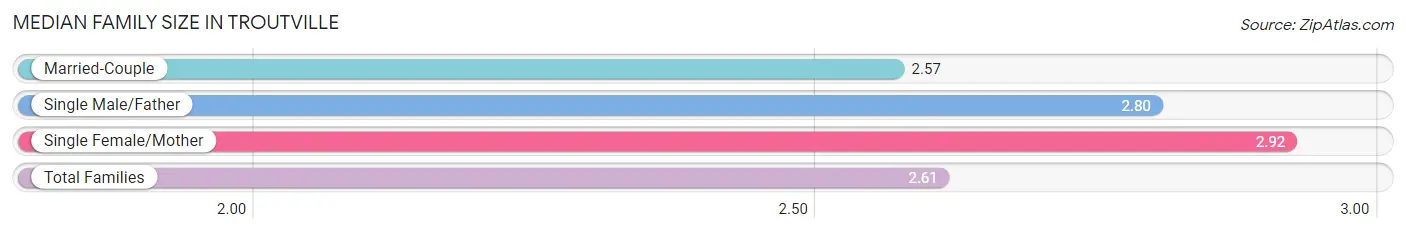
The median family size in Troutville is 2.61 persons per family, with single female/mother families (12 | 9.8%) accounting for the largest median family size of 2.92 persons per family. On the other hand, married-couple families (105 | 86.1%) represent the smallest median family size with 2.57 persons per family.
| Family Type | # Families | Family Size |
| Married-Couple | 105 (86.1%) | 2.57 |
| Single Male/Father | 5 (4.1%) | 2.80 |
| Single Female/Mother | 12 (9.8%) | 2.92 |
| Total Families | 122 (100.0%) | 2.61 |
Median Household Size in Troutville
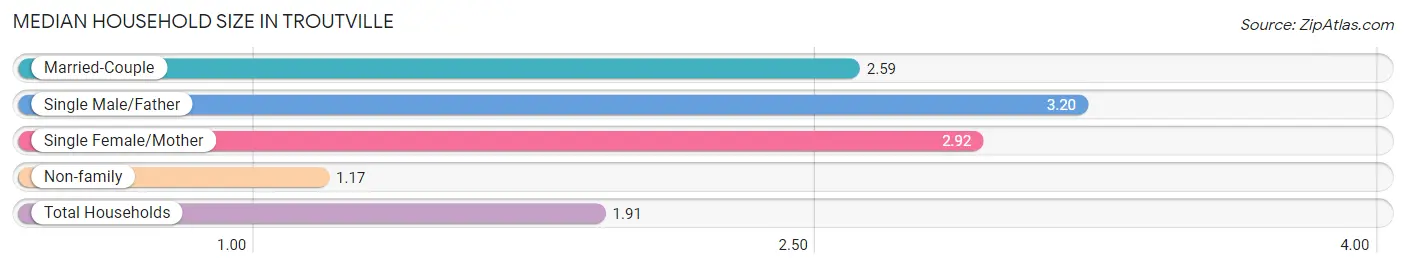
The median household size in Troutville is 1.91 persons per household, with single male/father households (5 | 2.0%) accounting for the largest median household size of 3.2 persons per household. non-family households (123 | 50.2%) represent the smallest median household size with 1.17 persons per household.
| Household Type | # Households | Household Size |
| Married-Couple | 105 (42.9%) | 2.59 |
| Single Male/Father | 5 (2.0%) | 3.20 |
| Single Female/Mother | 12 (4.9%) | 2.92 |
| Non-family | 123 (50.2%) | 1.17 |
| Total Households | 245 (100.0%) | 1.91 |
Household Size by Marriage Status in Troutville
Out of a total of 245 households in Troutville, 122 (49.8%) are family households, while 123 (50.2%) are nonfamily households. The most numerous type of family households are 2-person households, comprising 89, and the most common type of nonfamily households are 1-person households, comprising 109.
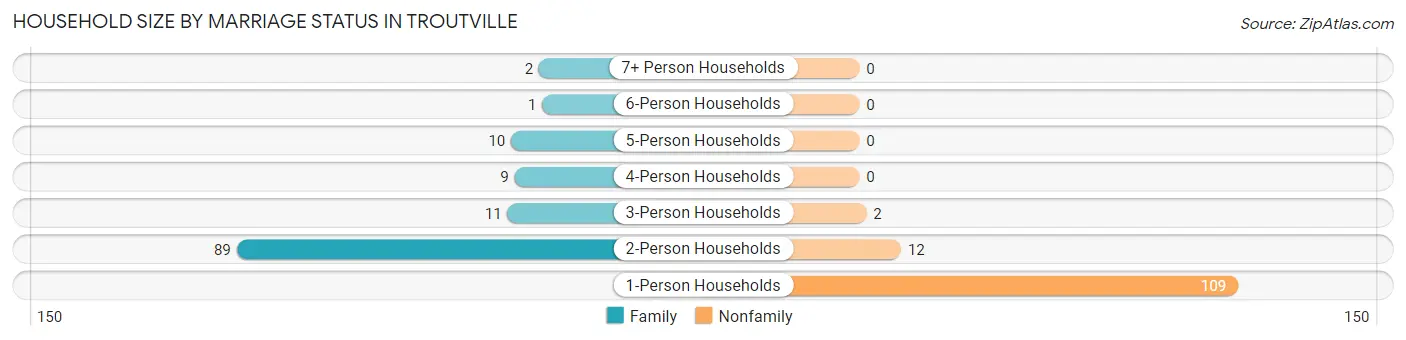
| Household Size | Family Households | Nonfamily Households |
| 1-Person Households | - | 109 (44.5%) |
| 2-Person Households | 89 (36.3%) | 12 (4.9%) |
| 3-Person Households | 11 (4.5%) | 2 (0.8%) |
| 4-Person Households | 9 (3.7%) | 0 (0.0%) |
| 5-Person Households | 10 (4.1%) | 0 (0.0%) |
| 6-Person Households | 1 (0.4%) | 0 (0.0%) |
| 7+ Person Households | 2 (0.8%) | 0 (0.0%) |
| Total | 122 (49.8%) | 123 (50.2%) |
Female Fertility in Troutville
Fertility by Age in Troutville
Average fertility rate in Troutville is 26.0 births per 1,000 women. Women in the age bracket of 20 to 34 years have the highest fertility rate with 43.0 births per 1,000 women. Women in the age bracket of 20 to 34 years acount for 100.0% of all women with births.
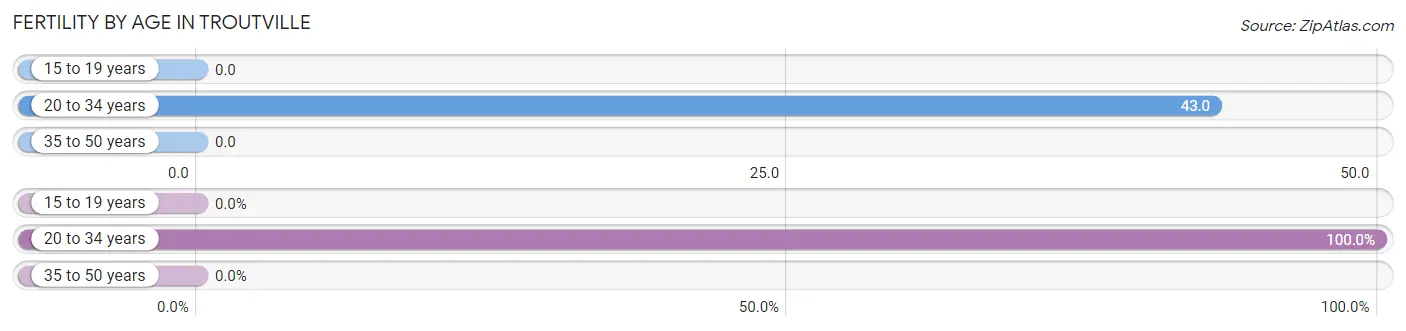
| Age Bracket | Women with Births | Births / 1,000 Women |
| 15 to 19 years | 0 (0.0%) | 0.0 |
| 20 to 34 years | 2 (100.0%) | 43.0 |
| 35 to 50 years | 0 (0.0%) | 0.0 |
| Total | 2 (100.0%) | 26.0 |
Fertility by Age by Marriage Status in Troutville
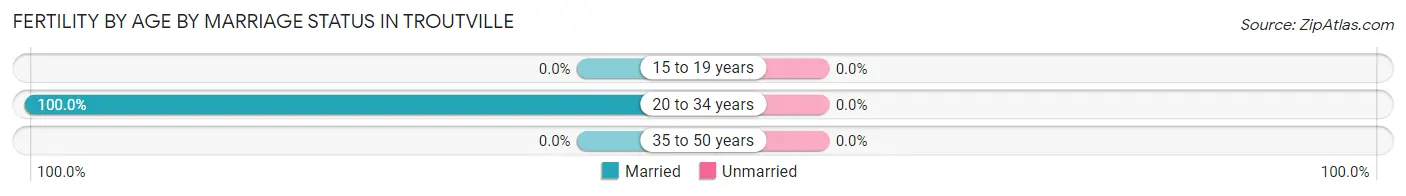
| Age Bracket | Married | Unmarried |
| 15 to 19 years | 0 (0.0%) | 0 (0.0%) |
| 20 to 34 years | 2 (100.0%) | 0 (0.0%) |
| 35 to 50 years | 0 (0.0%) | 0 (0.0%) |
| Total | 2 (100.0%) | 0 (0.0%) |
Fertility by Education in Troutville
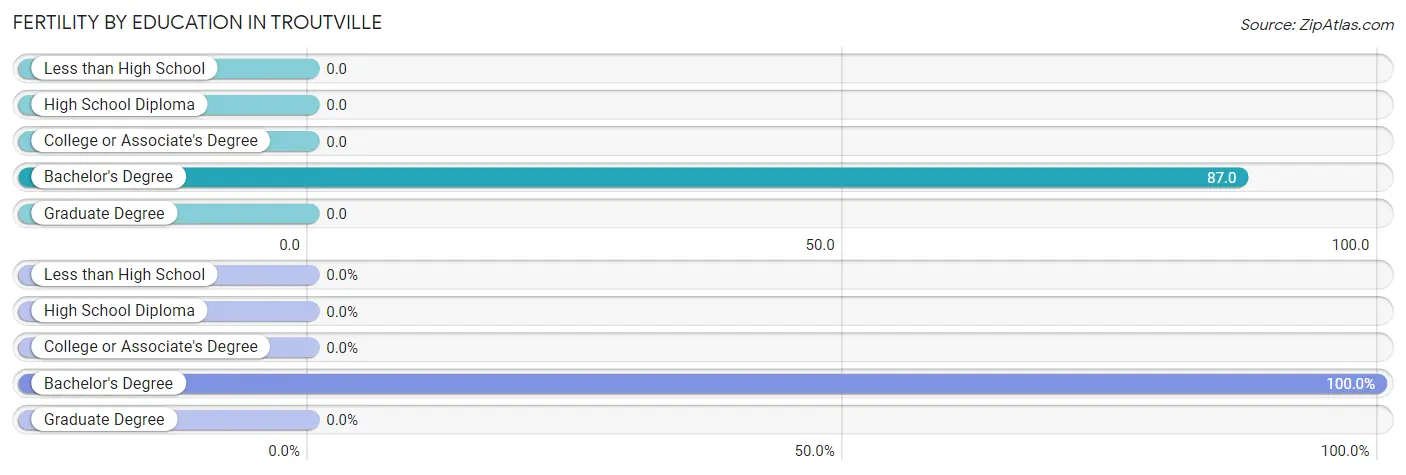
| Educational Attainment | Women with Births | Births / 1,000 Women |
| Less than High School | 0 (0.0%) | 0.0 |
| High School Diploma | 0 (0.0%) | 0.0 |
| College or Associate's Degree | 0 (0.0%) | 0.0 |
| Bachelor's Degree | 2 (100.0%) | 87.0 |
| Graduate Degree | 0 (0.0%) | 0.0 |
| Total | 2 (100.0%) | 26.0 |
Fertility by Education by Marriage Status in Troutville
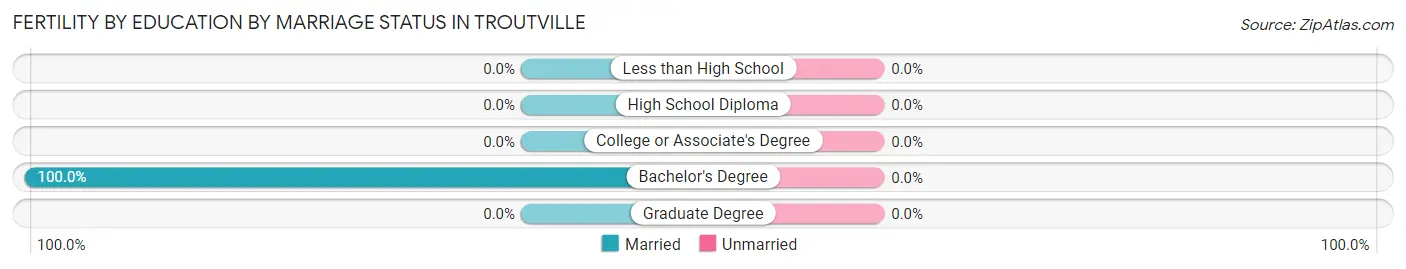
| Educational Attainment | Married | Unmarried |
| Less than High School | 0 (0.0%) | 0 (0.0%) |
| High School Diploma | 0 (0.0%) | 0 (0.0%) |
| College or Associate's Degree | 0 (0.0%) | 0 (0.0%) |
| Bachelor's Degree | 2 (100.0%) | 0 (0.0%) |
| Graduate Degree | 0 (0.0%) | 0 (0.0%) |
| Total | 2 (100.0%) | 0 (0.0%) |
Employment Characteristics in Troutville
Employment by Class of Employer in Troutville
Among the 213 employed individuals in Troutville, private company employees (117 | 54.9%), local government employees (55 | 25.8%), and not-for-profit organizations (20 | 9.4%) make up the most common classes of employment.
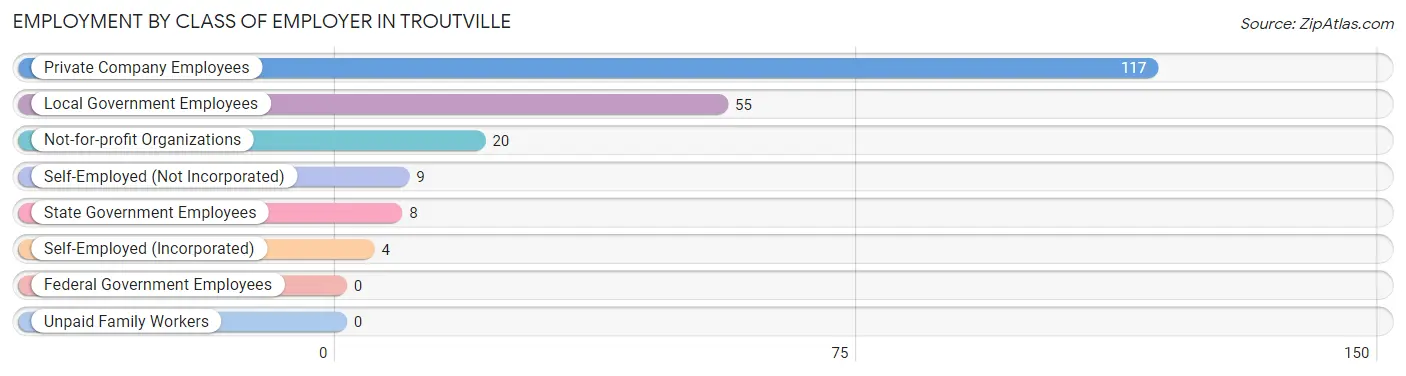
| Employer Class | # Employees | % Employees |
| Private Company Employees | 117 | 54.9% |
| Self-Employed (Incorporated) | 4 | 1.9% |
| Self-Employed (Not Incorporated) | 9 | 4.2% |
| Not-for-profit Organizations | 20 | 9.4% |
| Local Government Employees | 55 | 25.8% |
| State Government Employees | 8 | 3.8% |
| Federal Government Employees | 0 | 0.0% |
| Unpaid Family Workers | 0 | 0.0% |
| Total | 213 | 100.0% |
Employment Status by Age in Troutville
According to the labor force statistics for Troutville, out of the total population over 16 years of age (416), 52.4% or 218 individuals are in the labor force, with 1.4% or 3 of them unemployed. The age group with the highest labor force participation rate is 20 to 24 years, with 94.6% or 35 individuals in the labor force. Within the labor force, the 20 to 24 years age range has the highest percentage of unemployed individuals, with 8.6% or 3 of them being unemployed.
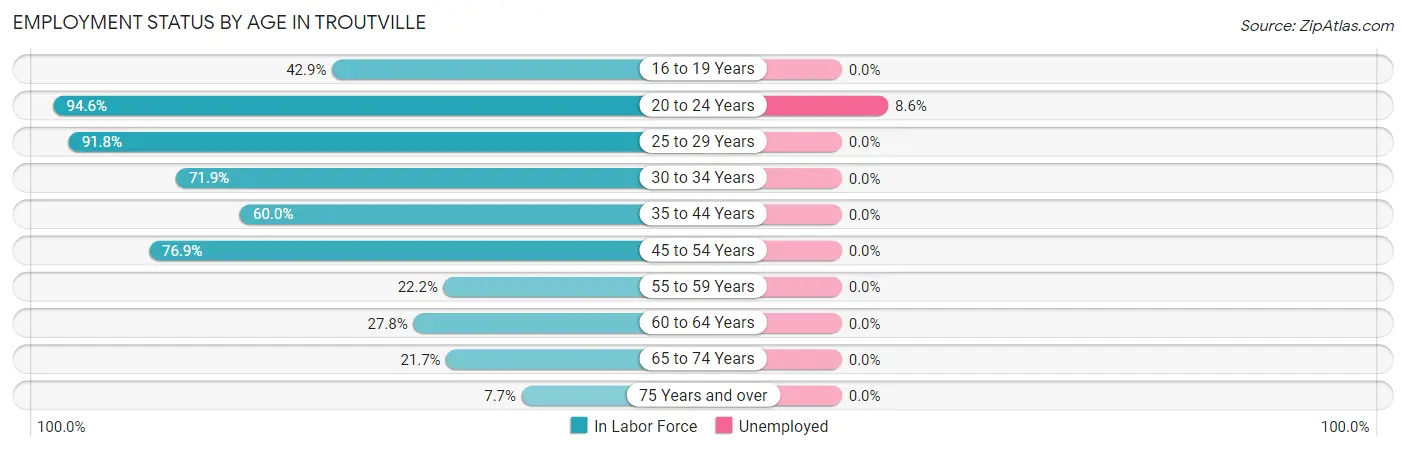
| Age Bracket | In Labor Force | Unemployed |
| 16 to 19 Years | 3 (42.9%) | 0 (0.0%) |
| 20 to 24 Years | 35 (94.6%) | 3 (8.6%) |
| 25 to 29 Years | 56 (91.8%) | 0 (0.0%) |
| 30 to 34 Years | 23 (71.9%) | 0 (0.0%) |
| 35 to 44 Years | 15 (60.0%) | 0 (0.0%) |
| 45 to 54 Years | 50 (76.9%) | 0 (0.0%) |
| 55 to 59 Years | 4 (22.2%) | 0 (0.0%) |
| 60 to 64 Years | 10 (27.8%) | 0 (0.0%) |
| 65 to 74 Years | 18 (21.7%) | 0 (0.0%) |
| 75 Years and over | 4 (7.7%) | 0 (0.0%) |
| Total | 218 (52.4%) | 3 (1.4%) |
Employment Status by Educational Attainment in Troutville
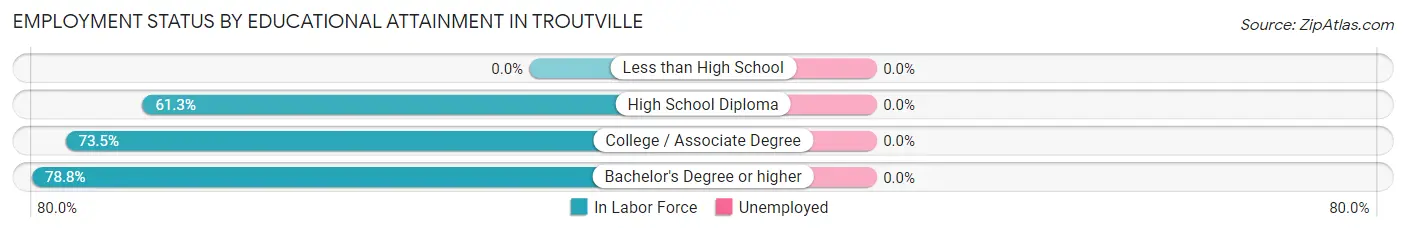
| Educational Attainment | In Labor Force | Unemployed |
| Less than High School | 0 (0.0%) | 0 (0.0%) |
| High School Diploma | 46 (61.3%) | 0 (0.0%) |
| College / Associate Degree | 86 (73.5%) | 0 (0.0%) |
| Bachelor's Degree or higher | 26 (78.8%) | 0 (0.0%) |
| Total | 158 (66.7%) | 0 (0.0%) |
Employment Occupations by Sex in Troutville
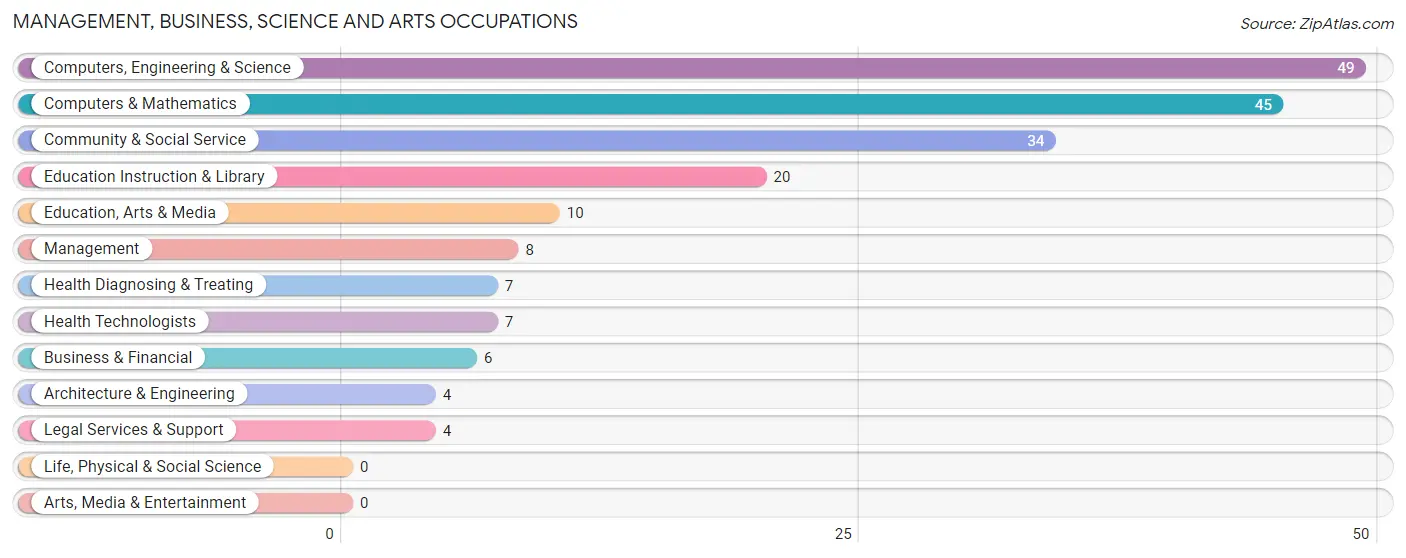
Management, Business, Science and Arts Occupations
The most common Management, Business, Science and Arts occupations in Troutville are Computers, Engineering & Science (49 | 22.8%), Computers & Mathematics (45 | 20.9%), Community & Social Service (34 | 15.8%), Education Instruction & Library (20 | 9.3%), and Education, Arts & Media (10 | 4.6%).
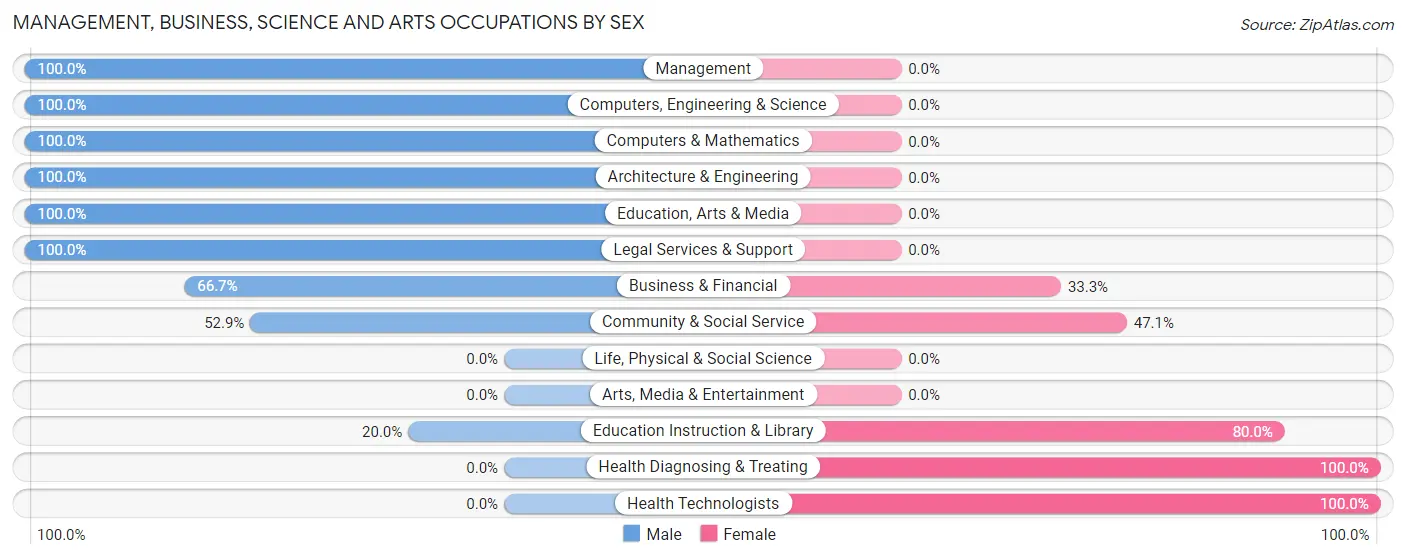
Management, Business, Science and Arts Occupations by Sex
Within the Management, Business, Science and Arts occupations in Troutville, the most male-oriented occupations are Management (100.0%), Computers, Engineering & Science (100.0%), and Computers & Mathematics (100.0%), while the most female-oriented occupations are Health Diagnosing & Treating (100.0%), Health Technologists (100.0%), and Education Instruction & Library (80.0%).
| Occupation | Male | Female |
| Management | 8 (100.0%) | 0 (0.0%) |
| Business & Financial | 4 (66.7%) | 2 (33.3%) |
| Computers, Engineering & Science | 49 (100.0%) | 0 (0.0%) |
| Computers & Mathematics | 45 (100.0%) | 0 (0.0%) |
| Architecture & Engineering | 4 (100.0%) | 0 (0.0%) |
| Life, Physical & Social Science | 0 (0.0%) | 0 (0.0%) |
| Community & Social Service | 18 (52.9%) | 16 (47.1%) |
| Education, Arts & Media | 10 (100.0%) | 0 (0.0%) |
| Legal Services & Support | 4 (100.0%) | 0 (0.0%) |
| Education Instruction & Library | 4 (20.0%) | 16 (80.0%) |
| Arts, Media & Entertainment | 0 (0.0%) | 0 (0.0%) |
| Health Diagnosing & Treating | 0 (0.0%) | 7 (100.0%) |
| Health Technologists | 0 (0.0%) | 7 (100.0%) |
| Total (Category) | 79 (76.0%) | 25 (24.0%) |
| Total (Overall) | 136 (63.3%) | 79 (36.7%) |
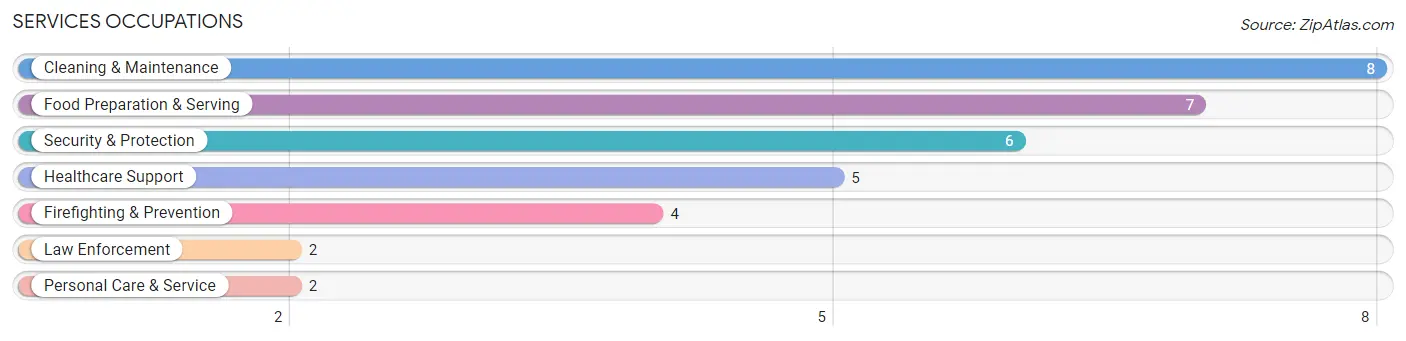
Services Occupations
The most common Services occupations in Troutville are Cleaning & Maintenance (8 | 3.7%), Food Preparation & Serving (7 | 3.3%), Security & Protection (6 | 2.8%), Healthcare Support (5 | 2.3%), and Firefighting & Prevention (4 | 1.9%).
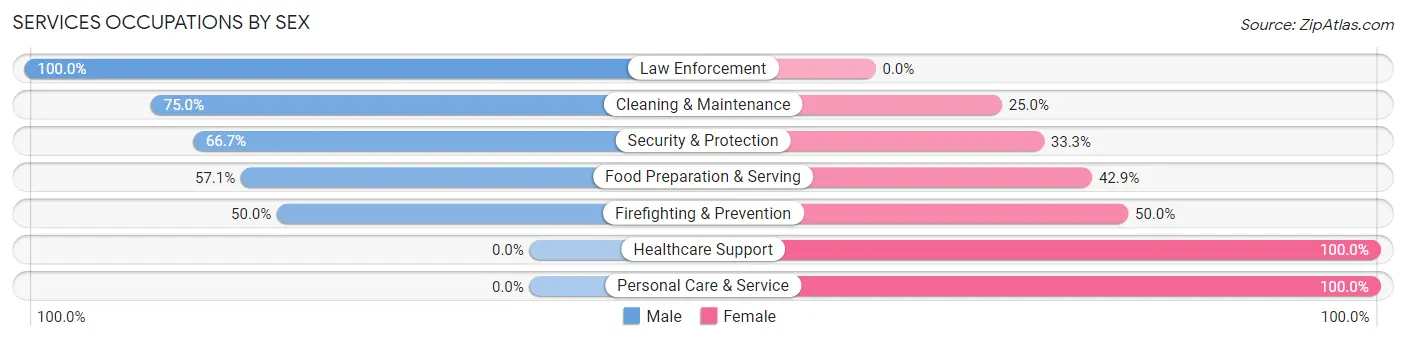
Services Occupations by Sex
Within the Services occupations in Troutville, the most male-oriented occupations are Law Enforcement (100.0%), Cleaning & Maintenance (75.0%), and Security & Protection (66.7%), while the most female-oriented occupations are Healthcare Support (100.0%), Personal Care & Service (100.0%), and Firefighting & Prevention (50.0%).
| Occupation | Male | Female |
| Healthcare Support | 0 (0.0%) | 5 (100.0%) |
| Security & Protection | 4 (66.7%) | 2 (33.3%) |
| Firefighting & Prevention | 2 (50.0%) | 2 (50.0%) |
| Law Enforcement | 2 (100.0%) | 0 (0.0%) |
| Food Preparation & Serving | 4 (57.1%) | 3 (42.9%) |
| Cleaning & Maintenance | 6 (75.0%) | 2 (25.0%) |
| Personal Care & Service | 0 (0.0%) | 2 (100.0%) |
| Total (Category) | 14 (50.0%) | 14 (50.0%) |
| Total (Overall) | 136 (63.3%) | 79 (36.7%) |
Sales and Office Occupations
The most common Sales and Office occupations in Troutville are Office & Administration (29 | 13.5%), and Sales & Related (22 | 10.2%).
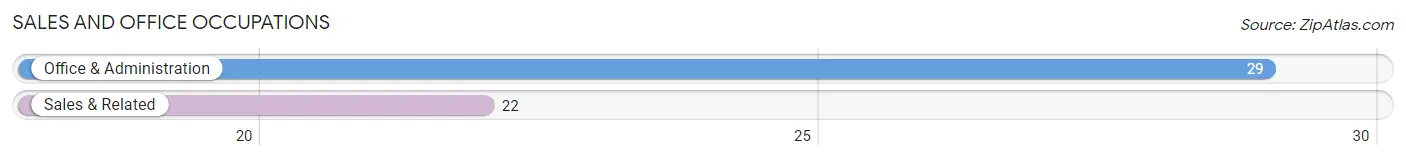
Sales and Office Occupations by Sex
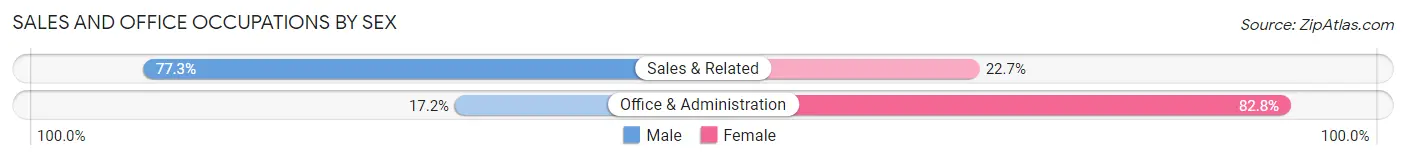
| Occupation | Male | Female |
| Sales & Related | 17 (77.3%) | 5 (22.7%) |
| Office & Administration | 5 (17.2%) | 24 (82.8%) |
| Total (Category) | 22 (43.1%) | 29 (56.9%) |
| Total (Overall) | 136 (63.3%) | 79 (36.7%) |
Natural Resources, Construction and Maintenance Occupations
The most common Natural Resources, Construction and Maintenance occupations in Troutville are Construction & Extraction (3 | 1.4%), and Installation, Maintenance & Repair (3 | 1.4%).
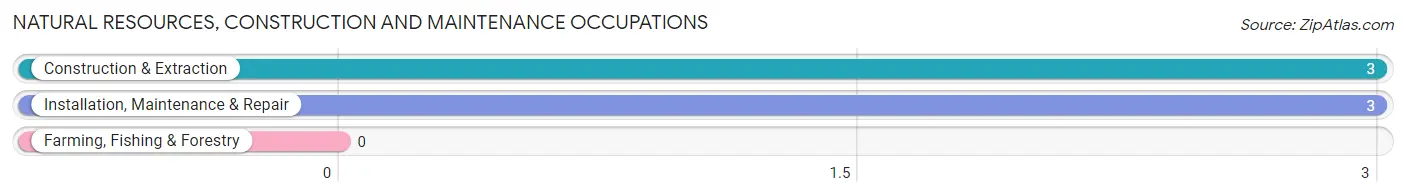
Natural Resources, Construction and Maintenance Occupations by Sex
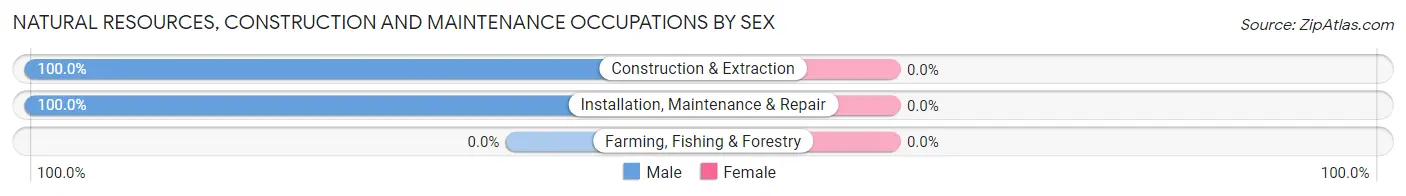
| Occupation | Male | Female |
| Farming, Fishing & Forestry | 0 (0.0%) | 0 (0.0%) |
| Construction & Extraction | 3 (100.0%) | 0 (0.0%) |
| Installation, Maintenance & Repair | 3 (100.0%) | 0 (0.0%) |
| Total (Category) | 6 (100.0%) | 0 (0.0%) |
| Total (Overall) | 136 (63.3%) | 79 (36.7%) |
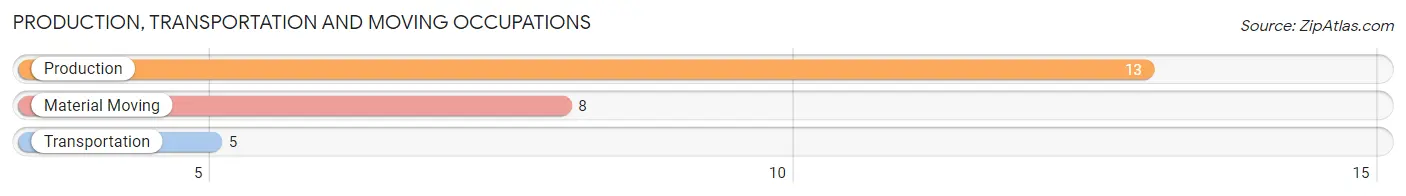
Production, Transportation and Moving Occupations
The most common Production, Transportation and Moving occupations in Troutville are Production (13 | 6.0%), Material Moving (8 | 3.7%), and Transportation (5 | 2.3%).
Production, Transportation and Moving Occupations by Sex
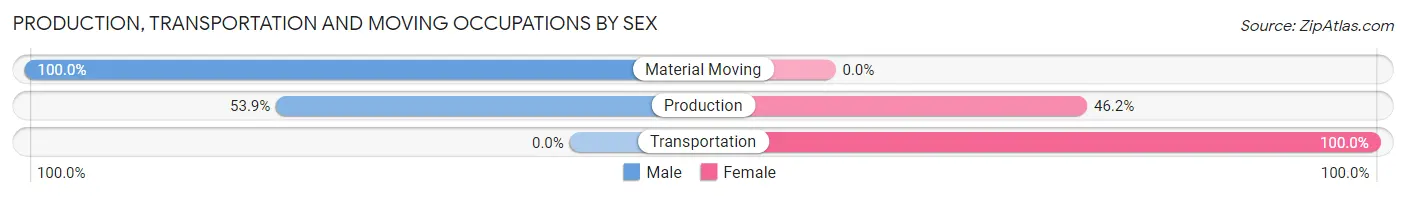
| Occupation | Male | Female |
| Production | 7 (53.8%) | 6 (46.2%) |
| Transportation | 0 (0.0%) | 5 (100.0%) |
| Material Moving | 8 (100.0%) | 0 (0.0%) |
| Total (Category) | 15 (57.7%) | 11 (42.3%) |
| Total (Overall) | 136 (63.3%) | 79 (36.7%) |
Employment Industries by Sex in Troutville
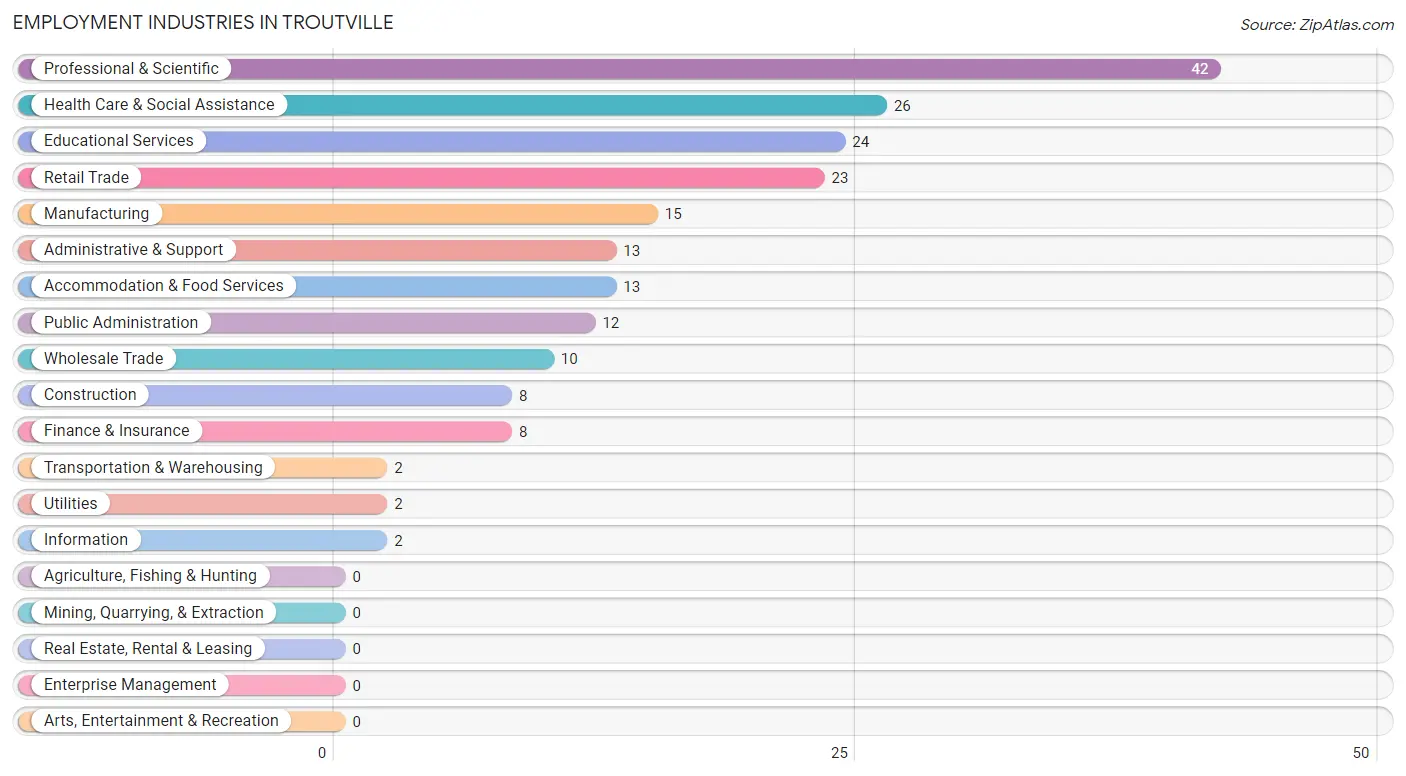
Employment Industries in Troutville
The major employment industries in Troutville include Professional & Scientific (42 | 19.5%), Health Care & Social Assistance (26 | 12.1%), Educational Services (24 | 11.2%), Retail Trade (23 | 10.7%), and Manufacturing (15 | 7.0%).
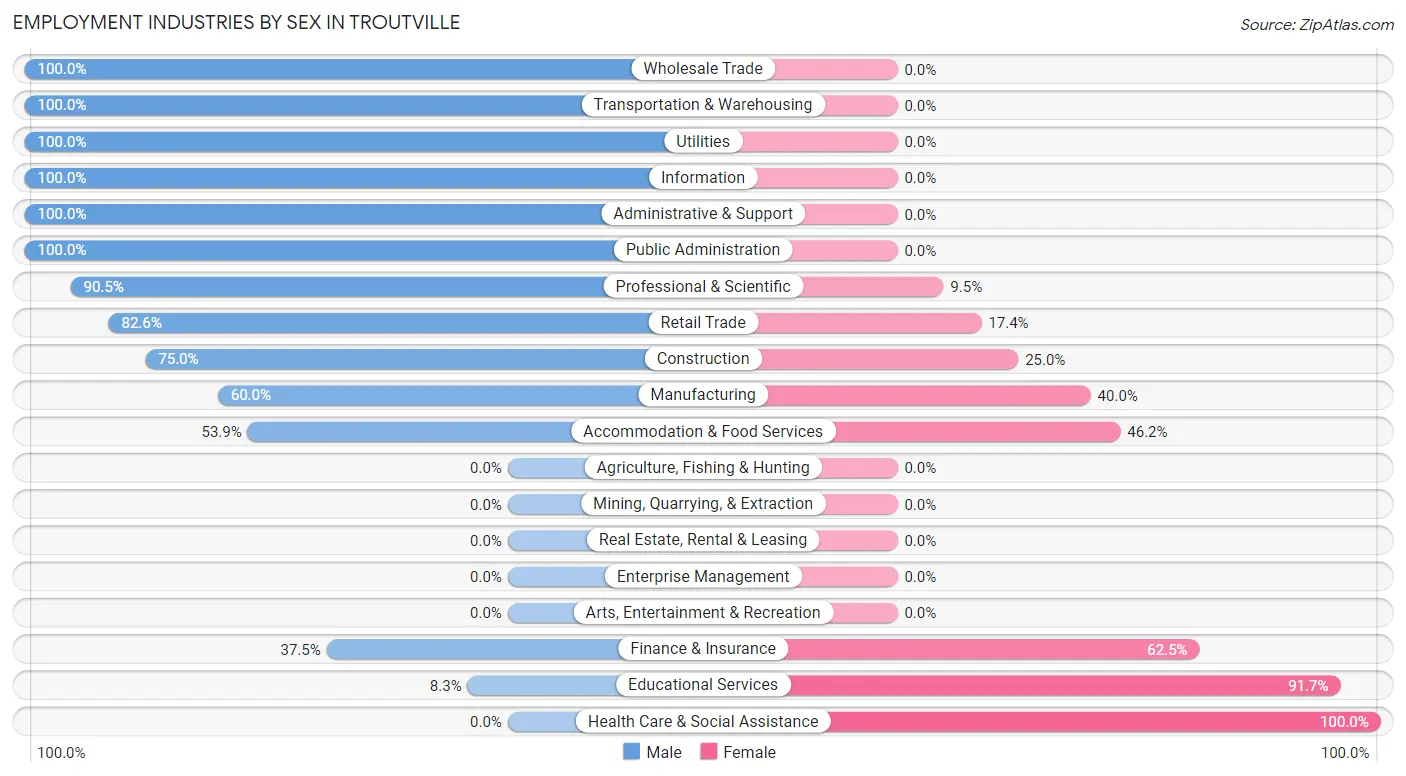
Employment Industries by Sex in Troutville
The Troutville industries that see more men than women are Wholesale Trade (100.0%), Transportation & Warehousing (100.0%), and Utilities (100.0%), whereas the industries that tend to have a higher number of women are Health Care & Social Assistance (100.0%), Educational Services (91.7%), and Finance & Insurance (62.5%).
| Industry | Male | Female |
| Agriculture, Fishing & Hunting | 0 (0.0%) | 0 (0.0%) |
| Mining, Quarrying, & Extraction | 0 (0.0%) | 0 (0.0%) |
| Construction | 6 (75.0%) | 2 (25.0%) |
| Manufacturing | 9 (60.0%) | 6 (40.0%) |
| Wholesale Trade | 10 (100.0%) | 0 (0.0%) |
| Retail Trade | 19 (82.6%) | 4 (17.4%) |
| Transportation & Warehousing | 2 (100.0%) | 0 (0.0%) |
| Utilities | 2 (100.0%) | 0 (0.0%) |
| Information | 2 (100.0%) | 0 (0.0%) |
| Finance & Insurance | 3 (37.5%) | 5 (62.5%) |
| Real Estate, Rental & Leasing | 0 (0.0%) | 0 (0.0%) |
| Professional & Scientific | 38 (90.5%) | 4 (9.5%) |
| Enterprise Management | 0 (0.0%) | 0 (0.0%) |
| Administrative & Support | 13 (100.0%) | 0 (0.0%) |
| Educational Services | 2 (8.3%) | 22 (91.7%) |
| Health Care & Social Assistance | 0 (0.0%) | 26 (100.0%) |
| Arts, Entertainment & Recreation | 0 (0.0%) | 0 (0.0%) |
| Accommodation & Food Services | 7 (53.8%) | 6 (46.2%) |
| Public Administration | 12 (100.0%) | 0 (0.0%) |
| Total | 136 (63.3%) | 79 (36.7%) |
Education in Troutville
School Enrollment in Troutville
The most common levels of schooling among the 56 students in Troutville are high school (18 | 32.1%), middle school (13 | 23.2%), and college / undergraduate (10 | 17.9%).
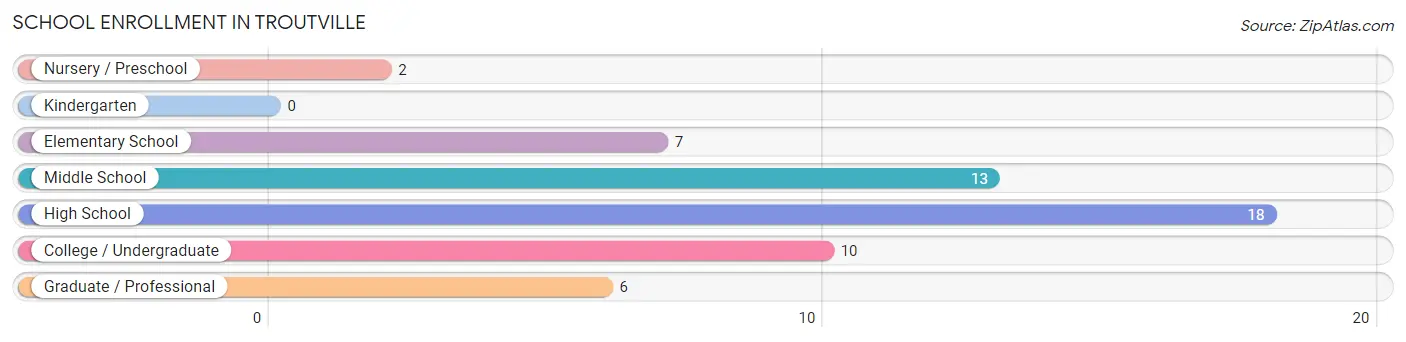
| School Level | # Students | % Students |
| Nursery / Preschool | 2 | 3.6% |
| Kindergarten | 0 | 0.0% |
| Elementary School | 7 | 12.5% |
| Middle School | 13 | 23.2% |
| High School | 18 | 32.1% |
| College / Undergraduate | 10 | 17.9% |
| Graduate / Professional | 6 | 10.7% |
| Total | 56 | 100.0% |
School Enrollment by Age by Funding Source in Troutville
Out of a total of 56 students who are enrolled in schools in Troutville, 20 (35.7%) attend a private institution, while the remaining 36 (64.3%) are enrolled in public schools. The age group of 35 years and over has the highest likelihood of being enrolled in private schools, with 6 (66.7% in the age bracket) enrolled. Conversely, the age group of 3 to 4 year olds has the lowest likelihood of being enrolled in a private school, with 2 (100.0% in the age bracket) attending a public institution.
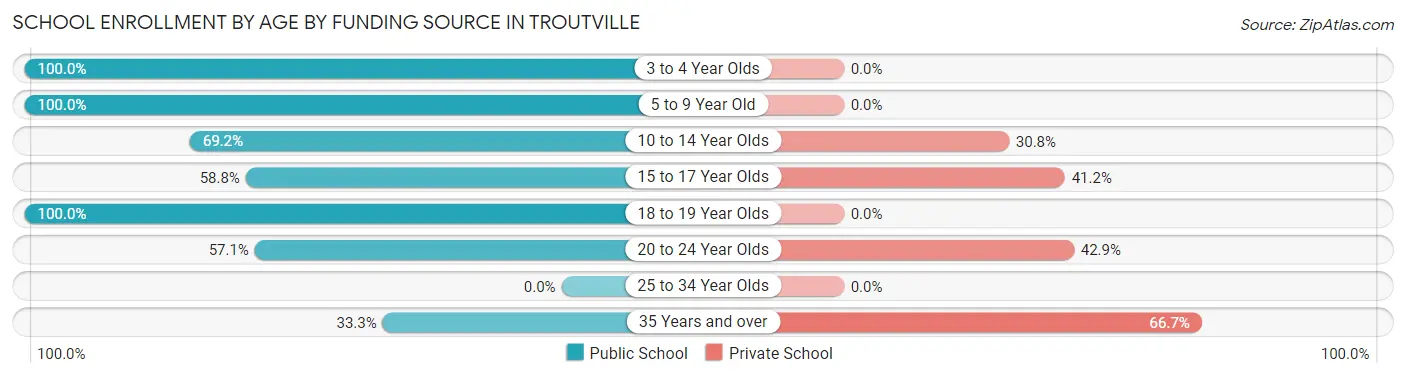
| Age Bracket | Public School | Private School |
| 3 to 4 Year Olds | 2 (100.0%) | 0 (0.0%) |
| 5 to 9 Year Old | 7 (100.0%) | 0 (0.0%) |
| 10 to 14 Year Olds | 9 (69.2%) | 4 (30.8%) |
| 15 to 17 Year Olds | 10 (58.8%) | 7 (41.2%) |
| 18 to 19 Year Olds | 1 (100.0%) | 0 (0.0%) |
| 20 to 24 Year Olds | 4 (57.1%) | 3 (42.9%) |
| 25 to 34 Year Olds | 0 (0.0%) | 0 (0.0%) |
| 35 Years and over | 3 (33.3%) | 6 (66.7%) |
| Total | 36 (64.3%) | 20 (35.7%) |
Educational Attainment by Field of Study in Troutville
Education (17 | 25.0%), physical & health sciences (15 | 22.1%), science & technology (8 | 11.8%), arts & humanities (7 | 10.3%), and business (6 | 8.8%) are the most common fields of study among 68 individuals in Troutville who have obtained a bachelor's degree or higher.
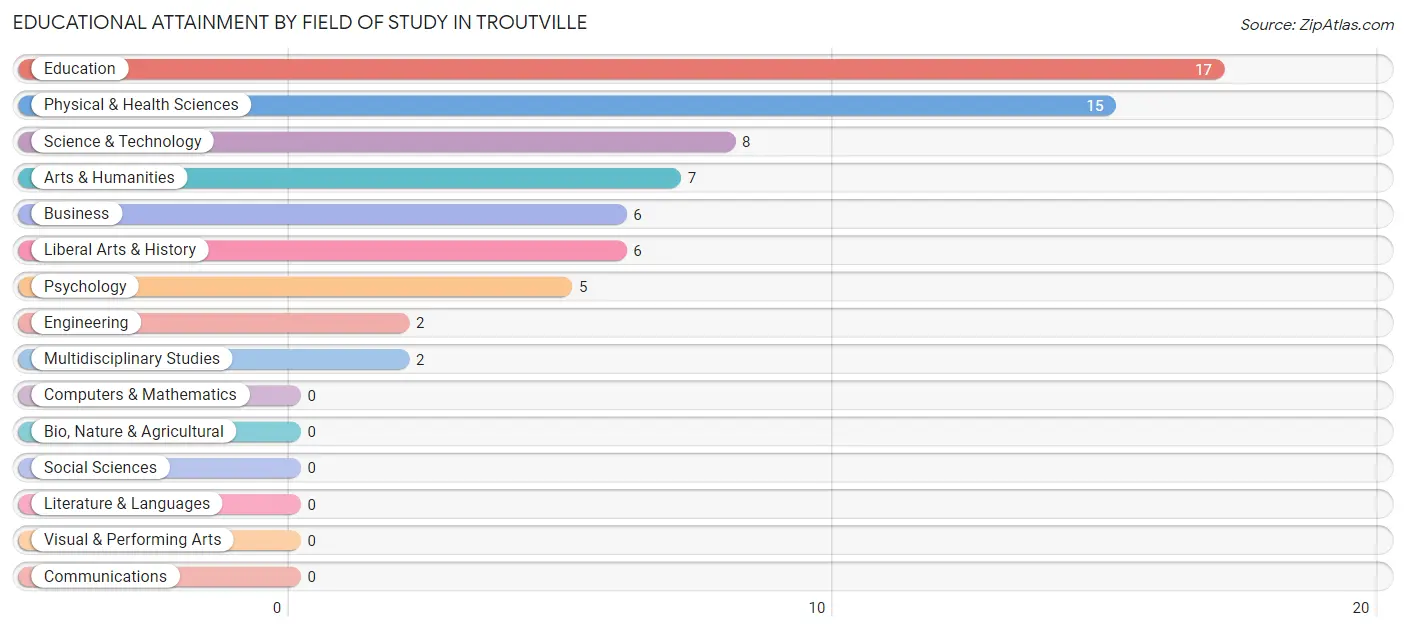
| Field of Study | # Graduates | % Graduates |
| Computers & Mathematics | 0 | 0.0% |
| Bio, Nature & Agricultural | 0 | 0.0% |
| Physical & Health Sciences | 15 | 22.1% |
| Psychology | 5 | 7.3% |
| Social Sciences | 0 | 0.0% |
| Engineering | 2 | 2.9% |
| Multidisciplinary Studies | 2 | 2.9% |
| Science & Technology | 8 | 11.8% |
| Business | 6 | 8.8% |
| Education | 17 | 25.0% |
| Literature & Languages | 0 | 0.0% |
| Liberal Arts & History | 6 | 8.8% |
| Visual & Performing Arts | 0 | 0.0% |
| Communications | 0 | 0.0% |
| Arts & Humanities | 7 | 10.3% |
| Total | 68 | 100.0% |
Transportation & Commute in Troutville
Vehicle Availability by Sex in Troutville
The most prevalent vehicle ownership categories in Troutville are males with 1 vehicle (50, accounting for 36.8%) and females with 1 vehicle (19, making up 64.9%).
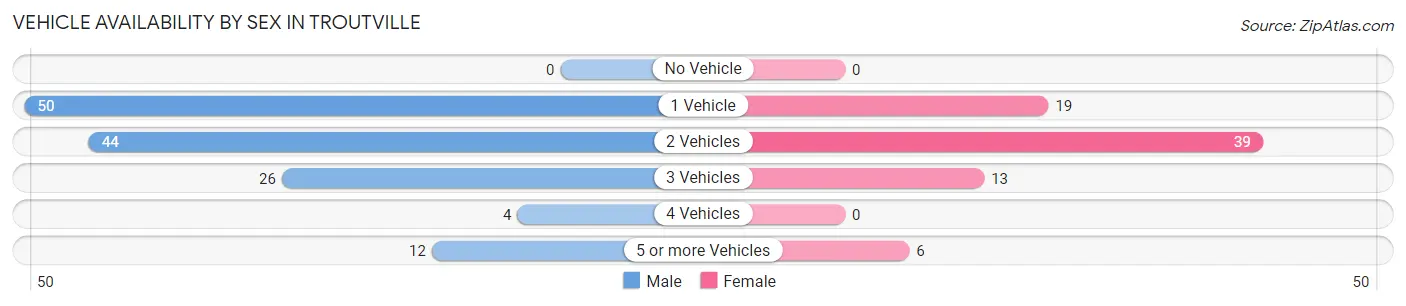
| Vehicles Available | Male | Female |
| No Vehicle | 0 (0.0%) | 0 (0.0%) |
| 1 Vehicle | 50 (36.8%) | 19 (24.7%) |
| 2 Vehicles | 44 (32.4%) | 39 (50.6%) |
| 3 Vehicles | 26 (19.1%) | 13 (16.9%) |
| 4 Vehicles | 4 (2.9%) | 0 (0.0%) |
| 5 or more Vehicles | 12 (8.8%) | 6 (7.8%) |
| Total | 136 (100.0%) | 77 (100.0%) |
Commute Time in Troutville
The most frequently occuring commute durations in Troutville are 20 to 24 minutes (61 commuters, 30.2%), 25 to 29 minutes (28 commuters, 13.9%), and 30 to 34 minutes (23 commuters, 11.4%).
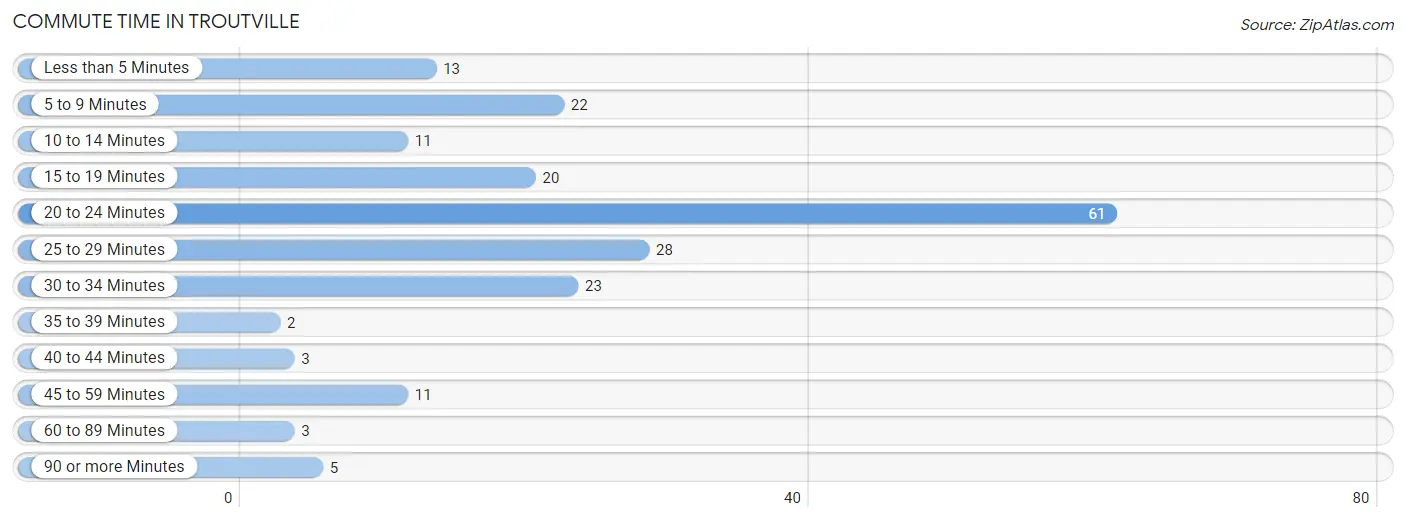
| Commute Time | # Commuters | % Commuters |
| Less than 5 Minutes | 13 | 6.4% |
| 5 to 9 Minutes | 22 | 10.9% |
| 10 to 14 Minutes | 11 | 5.4% |
| 15 to 19 Minutes | 20 | 9.9% |
| 20 to 24 Minutes | 61 | 30.2% |
| 25 to 29 Minutes | 28 | 13.9% |
| 30 to 34 Minutes | 23 | 11.4% |
| 35 to 39 Minutes | 2 | 1.0% |
| 40 to 44 Minutes | 3 | 1.5% |
| 45 to 59 Minutes | 11 | 5.4% |
| 60 to 89 Minutes | 3 | 1.5% |
| 90 or more Minutes | 5 | 2.5% |
Commute Time by Sex in Troutville
The most common commute times in Troutville are 20 to 24 minutes (45 commuters, 35.4%) for males and 20 to 24 minutes (16 commuters, 21.3%) for females.
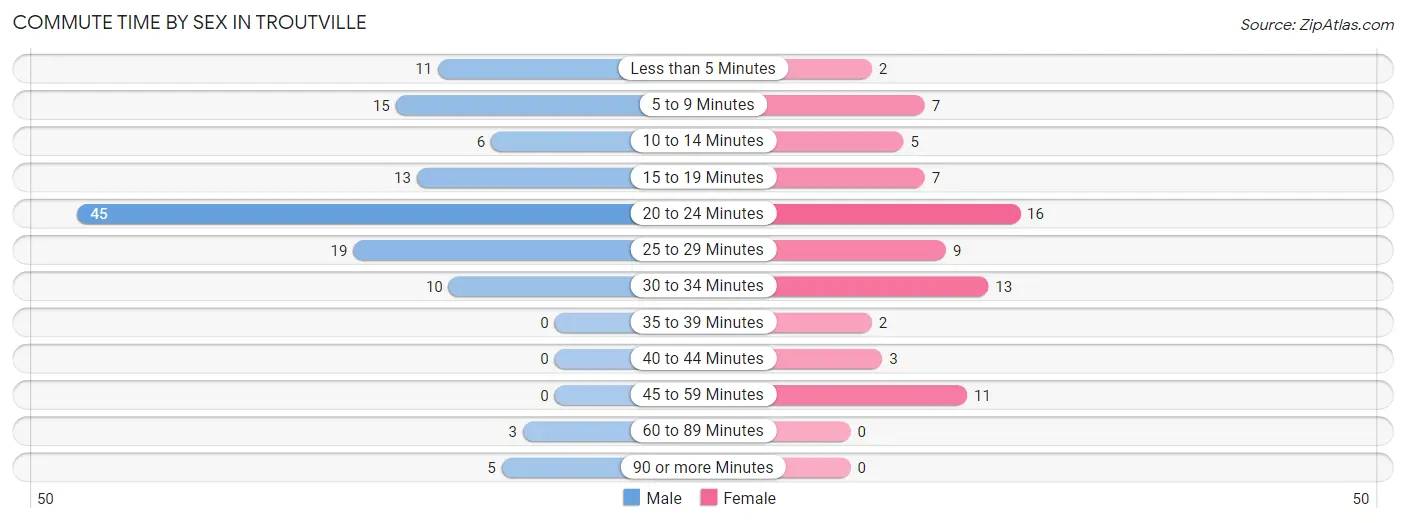
| Commute Time | Male | Female |
| Less than 5 Minutes | 11 (8.7%) | 2 (2.7%) |
| 5 to 9 Minutes | 15 (11.8%) | 7 (9.3%) |
| 10 to 14 Minutes | 6 (4.7%) | 5 (6.7%) |
| 15 to 19 Minutes | 13 (10.2%) | 7 (9.3%) |
| 20 to 24 Minutes | 45 (35.4%) | 16 (21.3%) |
| 25 to 29 Minutes | 19 (15.0%) | 9 (12.0%) |
| 30 to 34 Minutes | 10 (7.9%) | 13 (17.3%) |
| 35 to 39 Minutes | 0 (0.0%) | 2 (2.7%) |
| 40 to 44 Minutes | 0 (0.0%) | 3 (4.0%) |
| 45 to 59 Minutes | 0 (0.0%) | 11 (14.7%) |
| 60 to 89 Minutes | 3 (2.4%) | 0 (0.0%) |
| 90 or more Minutes | 5 (3.9%) | 0 (0.0%) |
Time of Departure to Work by Sex in Troutville
The most frequent times of departure to work in Troutville are 6:00 AM to 6:29 AM (55, 43.3%) for males and 8:00 AM to 8:29 AM (39, 52.0%) for females.
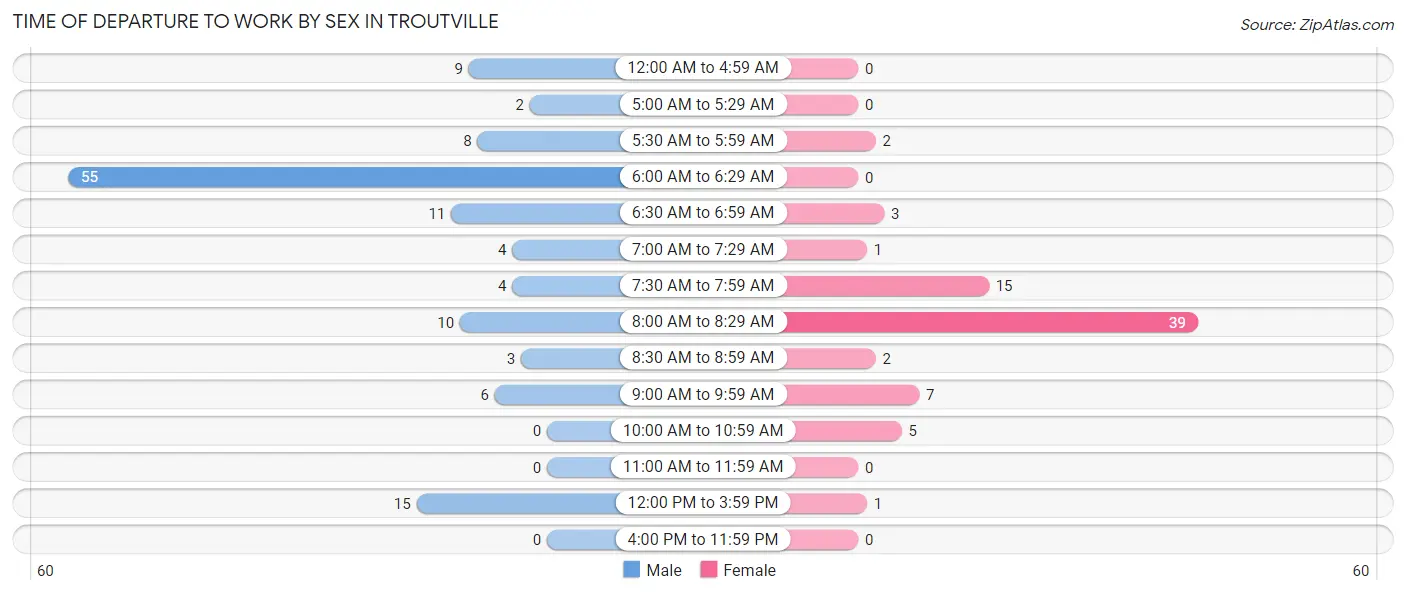
| Time of Departure | Male | Female |
| 12:00 AM to 4:59 AM | 9 (7.1%) | 0 (0.0%) |
| 5:00 AM to 5:29 AM | 2 (1.6%) | 0 (0.0%) |
| 5:30 AM to 5:59 AM | 8 (6.3%) | 2 (2.7%) |
| 6:00 AM to 6:29 AM | 55 (43.3%) | 0 (0.0%) |
| 6:30 AM to 6:59 AM | 11 (8.7%) | 3 (4.0%) |
| 7:00 AM to 7:29 AM | 4 (3.2%) | 1 (1.3%) |
| 7:30 AM to 7:59 AM | 4 (3.2%) | 15 (20.0%) |
| 8:00 AM to 8:29 AM | 10 (7.9%) | 39 (52.0%) |
| 8:30 AM to 8:59 AM | 3 (2.4%) | 2 (2.7%) |
| 9:00 AM to 9:59 AM | 6 (4.7%) | 7 (9.3%) |
| 10:00 AM to 10:59 AM | 0 (0.0%) | 5 (6.7%) |
| 11:00 AM to 11:59 AM | 0 (0.0%) | 0 (0.0%) |
| 12:00 PM to 3:59 PM | 15 (11.8%) | 1 (1.3%) |
| 4:00 PM to 11:59 PM | 0 (0.0%) | 0 (0.0%) |
| Total | 127 (100.0%) | 75 (100.0%) |
Housing Occupancy in Troutville
Occupancy by Ownership in Troutville
Of the total 245 dwellings in Troutville, owner-occupied units account for 144 (58.8%), while renter-occupied units make up 101 (41.2%).
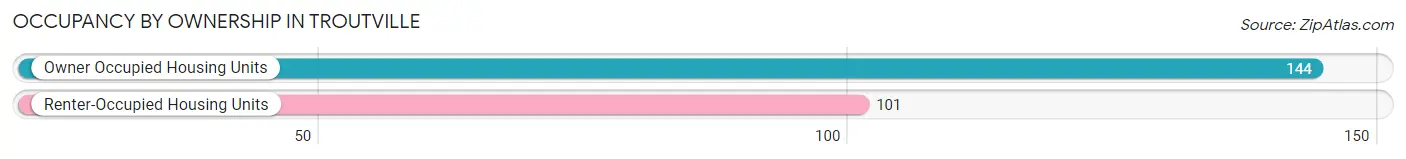
| Occupancy | # Housing Units | % Housing Units |
| Owner Occupied Housing Units | 144 | 58.8% |
| Renter-Occupied Housing Units | 101 | 41.2% |
| Total Occupied Housing Units | 245 | 100.0% |
Occupancy by Household Size in Troutville
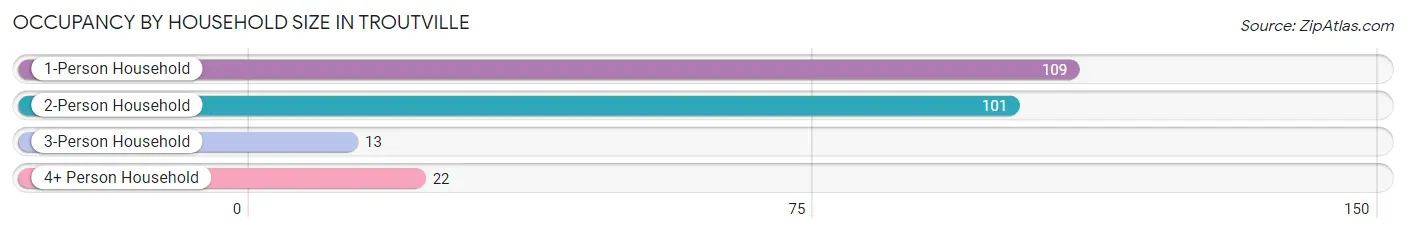
| Household Size | # Housing Units | % Housing Units |
| 1-Person Household | 109 | 44.5% |
| 2-Person Household | 101 | 41.2% |
| 3-Person Household | 13 | 5.3% |
| 4+ Person Household | 22 | 9.0% |
| Total Housing Units | 245 | 100.0% |
Occupancy by Ownership by Household Size in Troutville
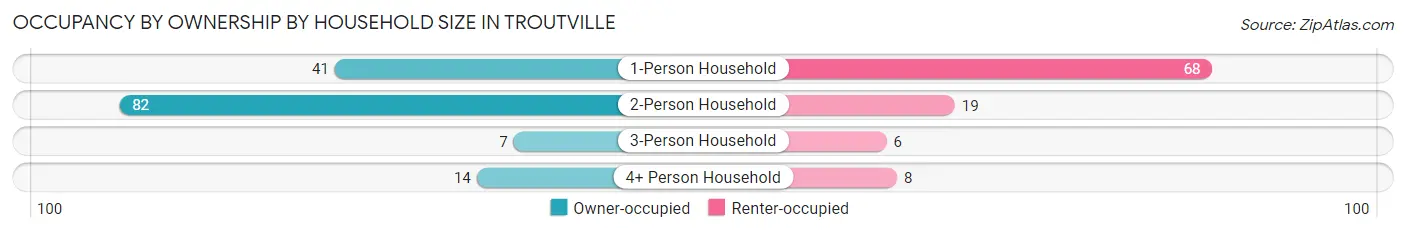
| Household Size | Owner-occupied | Renter-occupied |
| 1-Person Household | 41 (37.6%) | 68 (62.4%) |
| 2-Person Household | 82 (81.2%) | 19 (18.8%) |
| 3-Person Household | 7 (53.8%) | 6 (46.2%) |
| 4+ Person Household | 14 (63.6%) | 8 (36.4%) |
| Total Housing Units | 144 (58.8%) | 101 (41.2%) |
Occupancy by Educational Attainment in Troutville
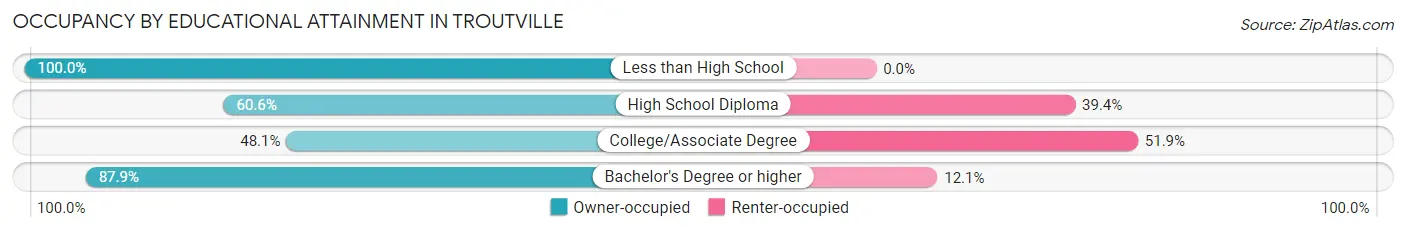
| Household Size | Owner-occupied | Renter-occupied |
| Less than High School | 8 (100.0%) | 0 (0.0%) |
| High School Diploma | 43 (60.6%) | 28 (39.4%) |
| College/Associate Degree | 64 (48.1%) | 69 (51.9%) |
| Bachelor's Degree or higher | 29 (87.9%) | 4 (12.1%) |
Occupancy by Age of Householder in Troutville
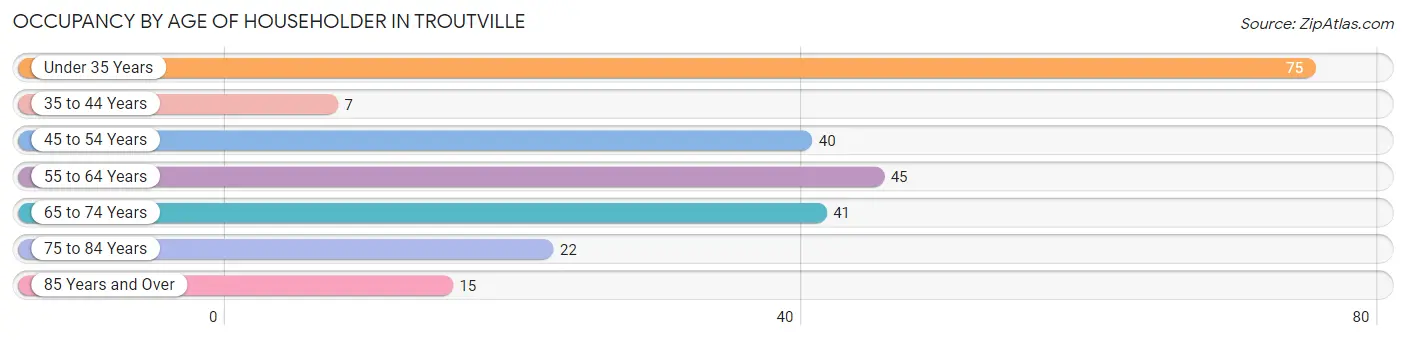
| Age Bracket | # Households | % Households |
| Under 35 Years | 75 | 30.6% |
| 35 to 44 Years | 7 | 2.9% |
| 45 to 54 Years | 40 | 16.3% |
| 55 to 64 Years | 45 | 18.4% |
| 65 to 74 Years | 41 | 16.7% |
| 75 to 84 Years | 22 | 9.0% |
| 85 Years and Over | 15 | 6.1% |
| Total | 245 | 100.0% |
Housing Finances in Troutville
Median Income by Occupancy in Troutville
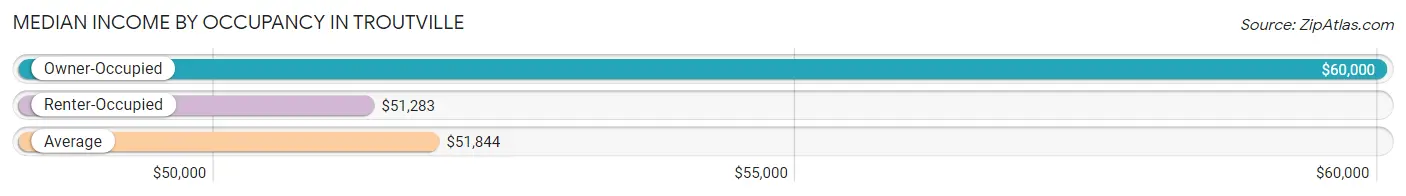
| Occupancy Type | # Households | Median Income |
| Owner-Occupied | 144 (58.8%) | $60,000 |
| Renter-Occupied | 101 (41.2%) | $51,283 |
| Average | 245 (100.0%) | $51,844 |
Occupancy by Householder Income Bracket in Troutville
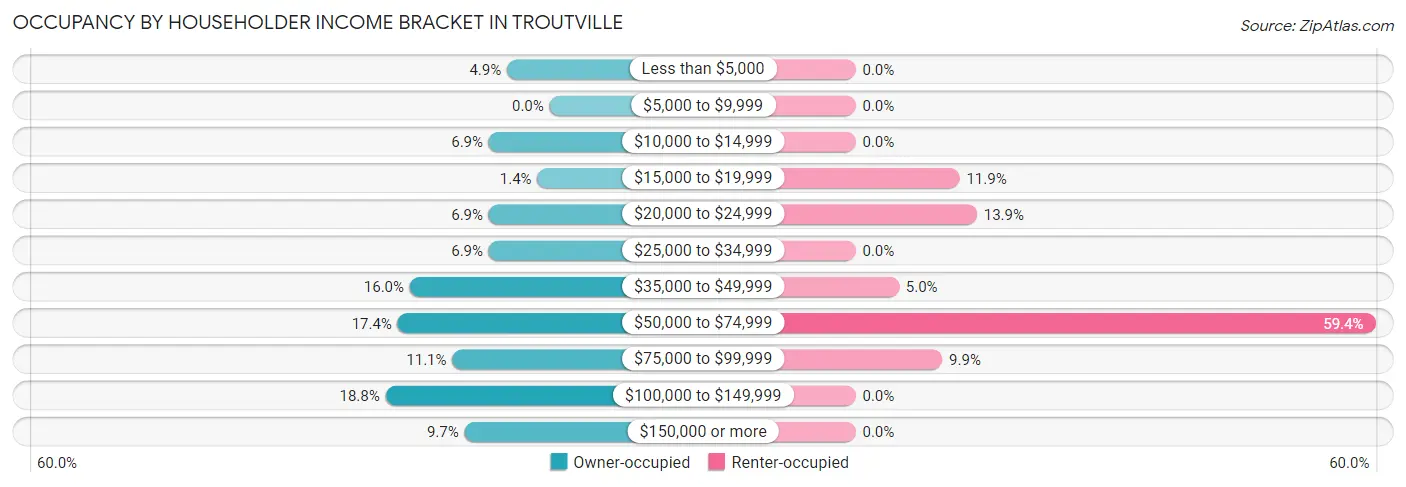
| Income Bracket | Owner-occupied | Renter-occupied |
| Less than $5,000 | 7 (4.9%) | 0 (0.0%) |
| $5,000 to $9,999 | 0 (0.0%) | 0 (0.0%) |
| $10,000 to $14,999 | 10 (6.9%) | 0 (0.0%) |
| $15,000 to $19,999 | 2 (1.4%) | 12 (11.9%) |
| $20,000 to $24,999 | 10 (6.9%) | 14 (13.9%) |
| $25,000 to $34,999 | 10 (6.9%) | 0 (0.0%) |
| $35,000 to $49,999 | 23 (16.0%) | 5 (5.0%) |
| $50,000 to $74,999 | 25 (17.4%) | 60 (59.4%) |
| $75,000 to $99,999 | 16 (11.1%) | 10 (9.9%) |
| $100,000 to $149,999 | 27 (18.8%) | 0 (0.0%) |
| $150,000 or more | 14 (9.7%) | 0 (0.0%) |
| Total | 144 (100.0%) | 101 (100.0%) |
Monthly Housing Cost Tiers in Troutville
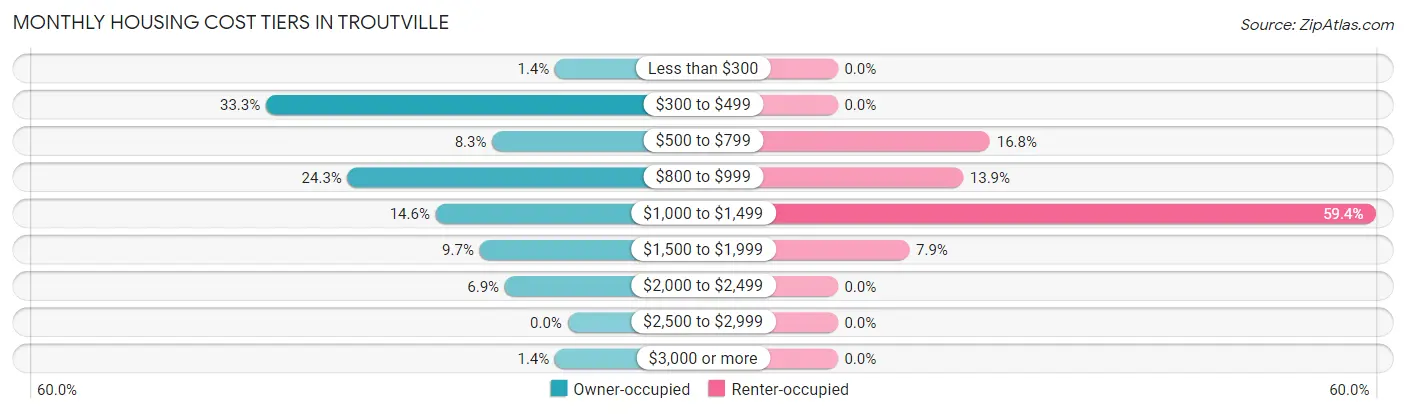
| Monthly Cost | Owner-occupied | Renter-occupied |
| Less than $300 | 2 (1.4%) | 0 (0.0%) |
| $300 to $499 | 48 (33.3%) | 0 (0.0%) |
| $500 to $799 | 12 (8.3%) | 17 (16.8%) |
| $800 to $999 | 35 (24.3%) | 14 (13.9%) |
| $1,000 to $1,499 | 21 (14.6%) | 60 (59.4%) |
| $1,500 to $1,999 | 14 (9.7%) | 8 (7.9%) |
| $2,000 to $2,499 | 10 (6.9%) | 0 (0.0%) |
| $2,500 to $2,999 | 0 (0.0%) | 0 (0.0%) |
| $3,000 or more | 2 (1.4%) | 0 (0.0%) |
| Total | 144 (100.0%) | 101 (100.0%) |
Physical Housing Characteristics in Troutville
Housing Structures in Troutville
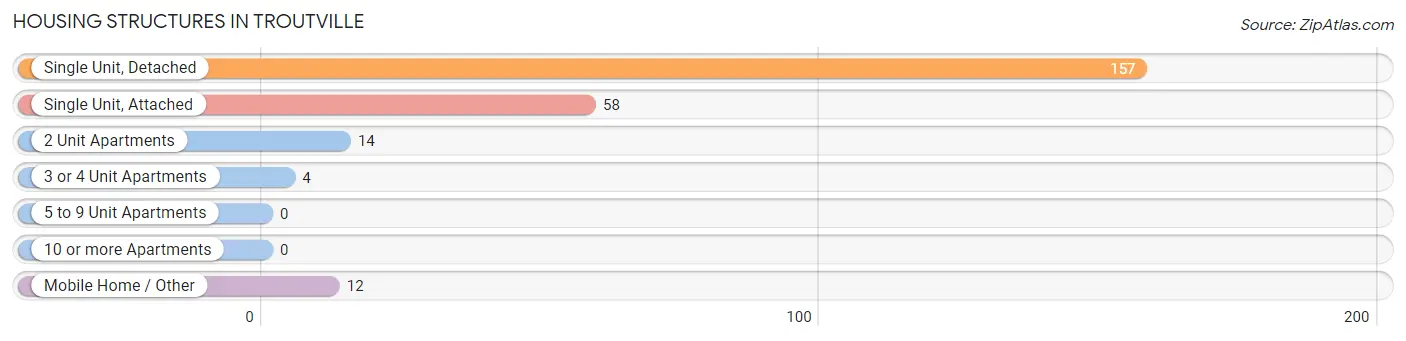
| Structure Type | # Housing Units | % Housing Units |
| Single Unit, Detached | 157 | 64.1% |
| Single Unit, Attached | 58 | 23.7% |
| 2 Unit Apartments | 14 | 5.7% |
| 3 or 4 Unit Apartments | 4 | 1.6% |
| 5 to 9 Unit Apartments | 0 | 0.0% |
| 10 or more Apartments | 0 | 0.0% |
| Mobile Home / Other | 12 | 4.9% |
| Total | 245 | 100.0% |
Housing Structures by Occupancy in Troutville
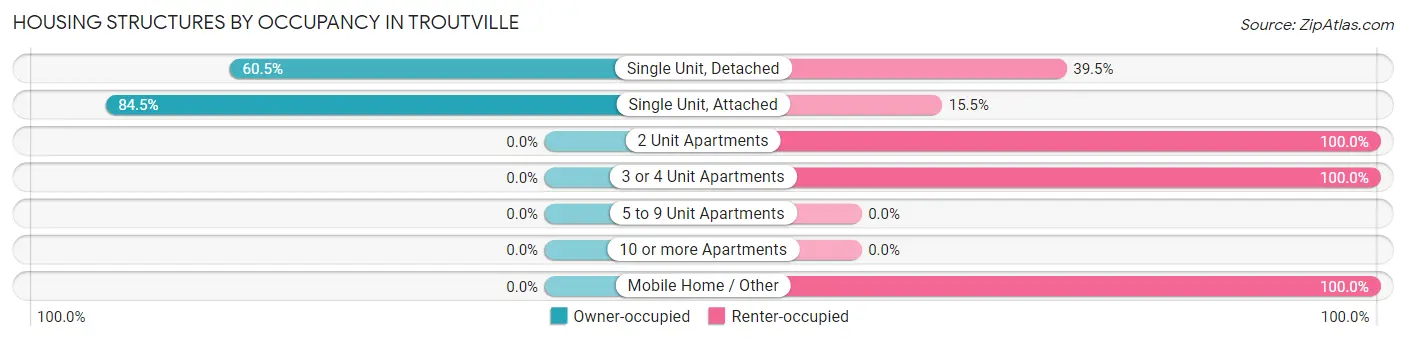
| Structure Type | Owner-occupied | Renter-occupied |
| Single Unit, Detached | 95 (60.5%) | 62 (39.5%) |
| Single Unit, Attached | 49 (84.5%) | 9 (15.5%) |
| 2 Unit Apartments | 0 (0.0%) | 14 (100.0%) |
| 3 or 4 Unit Apartments | 0 (0.0%) | 4 (100.0%) |
| 5 to 9 Unit Apartments | 0 (0.0%) | 0 (0.0%) |
| 10 or more Apartments | 0 (0.0%) | 0 (0.0%) |
| Mobile Home / Other | 0 (0.0%) | 12 (100.0%) |
| Total | 144 (58.8%) | 101 (41.2%) |
Housing Structures by Number of Rooms in Troutville
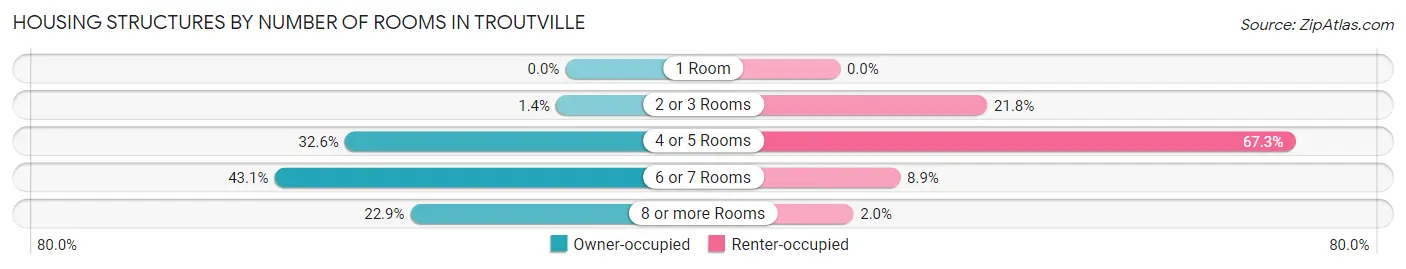
| Number of Rooms | Owner-occupied | Renter-occupied |
| 1 Room | 0 (0.0%) | 0 (0.0%) |
| 2 or 3 Rooms | 2 (1.4%) | 22 (21.8%) |
| 4 or 5 Rooms | 47 (32.6%) | 68 (67.3%) |
| 6 or 7 Rooms | 62 (43.1%) | 9 (8.9%) |
| 8 or more Rooms | 33 (22.9%) | 2 (2.0%) |
| Total | 144 (100.0%) | 101 (100.0%) |
Housing Structure by Heating Type in Troutville
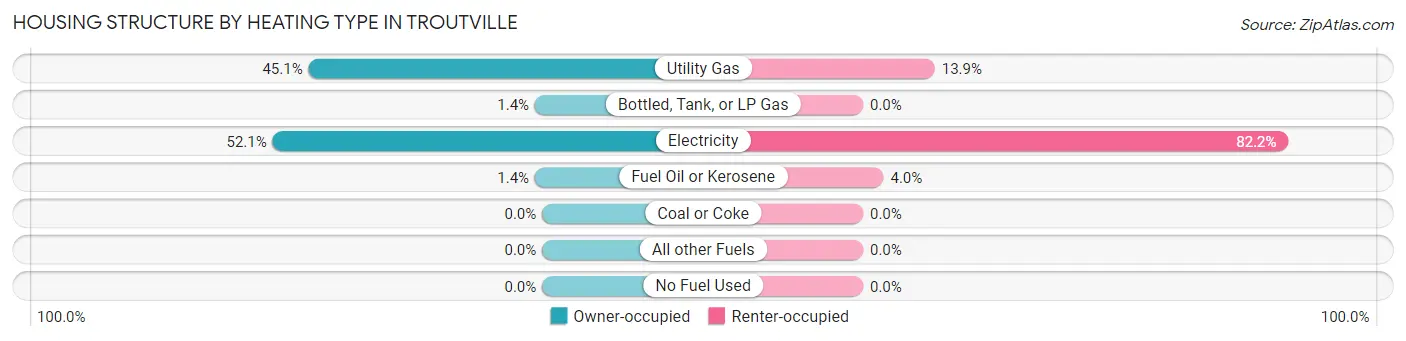
| Heating Type | Owner-occupied | Renter-occupied |
| Utility Gas | 65 (45.1%) | 14 (13.9%) |
| Bottled, Tank, or LP Gas | 2 (1.4%) | 0 (0.0%) |
| Electricity | 75 (52.1%) | 83 (82.2%) |
| Fuel Oil or Kerosene | 2 (1.4%) | 4 (4.0%) |
| Coal or Coke | 0 (0.0%) | 0 (0.0%) |
| All other Fuels | 0 (0.0%) | 0 (0.0%) |
| No Fuel Used | 0 (0.0%) | 0 (0.0%) |
| Total | 144 (100.0%) | 101 (100.0%) |
Household Vehicle Usage in Troutville
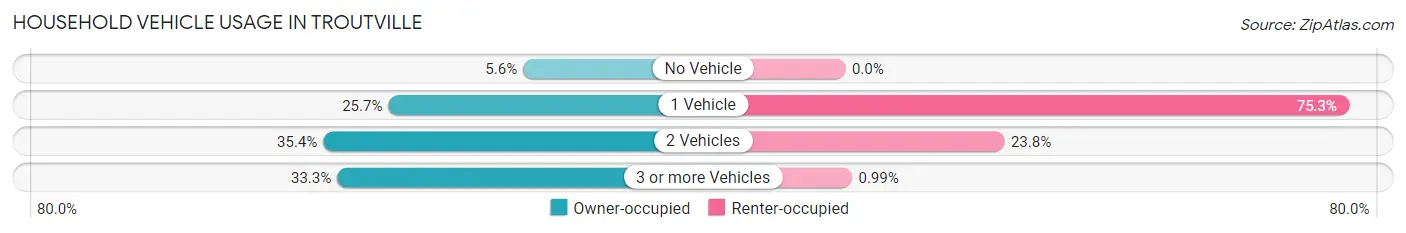
| Vehicles per Household | Owner-occupied | Renter-occupied |
| No Vehicle | 8 (5.6%) | 0 (0.0%) |
| 1 Vehicle | 37 (25.7%) | 76 (75.2%) |
| 2 Vehicles | 51 (35.4%) | 24 (23.8%) |
| 3 or more Vehicles | 48 (33.3%) | 1 (1.0%) |
| Total | 144 (100.0%) | 101 (100.0%) |
Real Estate & Mortgages in Troutville
Real Estate and Mortgage Overview in Troutville
| Characteristic | Without Mortgage | With Mortgage |
| Housing Units | 72 | 72 |
| Median Property Value | $206,000 | $211,500 |
| Median Household Income | $61,250 | $8 |
| Monthly Housing Costs | $450 | $2 |
| Real Estate Taxes | $1,531 | $9 |
Property Value by Mortgage Status in Troutville
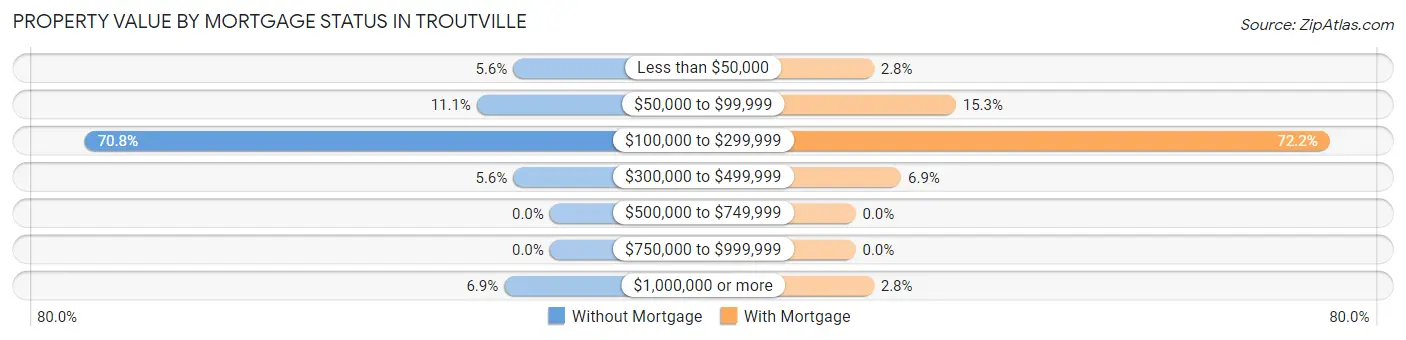
| Property Value | Without Mortgage | With Mortgage |
| Less than $50,000 | 4 (5.6%) | 2 (2.8%) |
| $50,000 to $99,999 | 8 (11.1%) | 11 (15.3%) |
| $100,000 to $299,999 | 51 (70.8%) | 52 (72.2%) |
| $300,000 to $499,999 | 4 (5.6%) | 5 (6.9%) |
| $500,000 to $749,999 | 0 (0.0%) | 0 (0.0%) |
| $750,000 to $999,999 | 0 (0.0%) | 0 (0.0%) |
| $1,000,000 or more | 5 (6.9%) | 2 (2.8%) |
| Total | 72 (100.0%) | 72 (100.0%) |
Household Income by Mortgage Status in Troutville
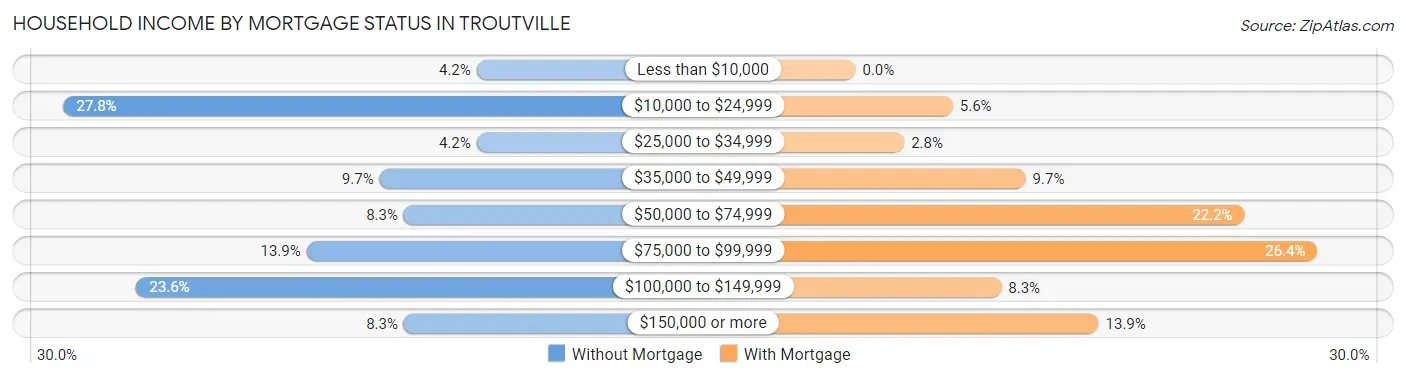
| Household Income | Without Mortgage | With Mortgage |
| Less than $10,000 | 3 (4.2%) | 0 (0.0%) |
| $10,000 to $24,999 | 20 (27.8%) | 4 (5.6%) |
| $25,000 to $34,999 | 3 (4.2%) | 2 (2.8%) |
| $35,000 to $49,999 | 7 (9.7%) | 7 (9.7%) |
| $50,000 to $74,999 | 6 (8.3%) | 16 (22.2%) |
| $75,000 to $99,999 | 10 (13.9%) | 19 (26.4%) |
| $100,000 to $149,999 | 17 (23.6%) | 6 (8.3%) |
| $150,000 or more | 6 (8.3%) | 10 (13.9%) |
| Total | 72 (100.0%) | 72 (100.0%) |
Property Value to Household Income Ratio in Troutville
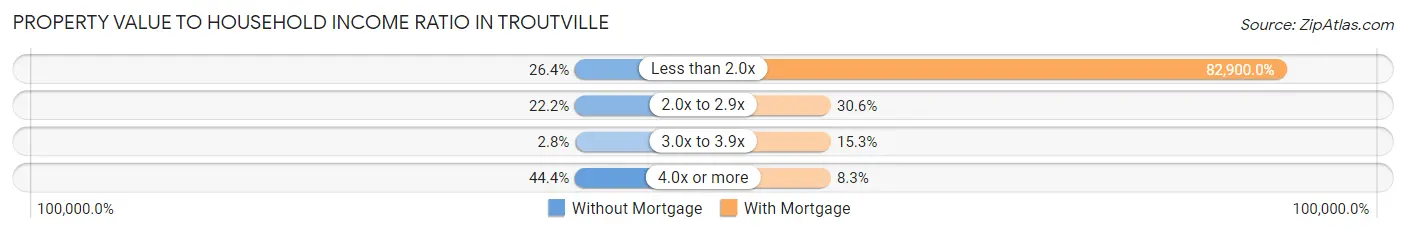
| Value-to-Income Ratio | Without Mortgage | With Mortgage |
| Less than 2.0x | 19 (26.4%) | 59,688 (82,900.0%) |
| 2.0x to 2.9x | 16 (22.2%) | 22 (30.6%) |
| 3.0x to 3.9x | 2 (2.8%) | 11 (15.3%) |
| 4.0x or more | 32 (44.4%) | 6 (8.3%) |
| Total | 72 (100.0%) | 72 (100.0%) |
Real Estate Taxes by Mortgage Status in Troutville
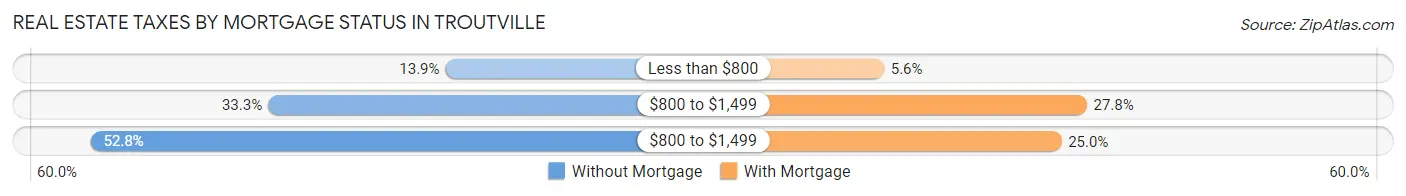
| Property Taxes | Without Mortgage | With Mortgage |
| Less than $800 | 10 (13.9%) | 4 (5.6%) |
| $800 to $1,499 | 24 (33.3%) | 20 (27.8%) |
| $800 to $1,499 | 38 (52.8%) | 18 (25.0%) |
| Total | 72 (100.0%) | 72 (100.0%) |
Health & Disability in Troutville
Health Insurance Coverage by Age in Troutville
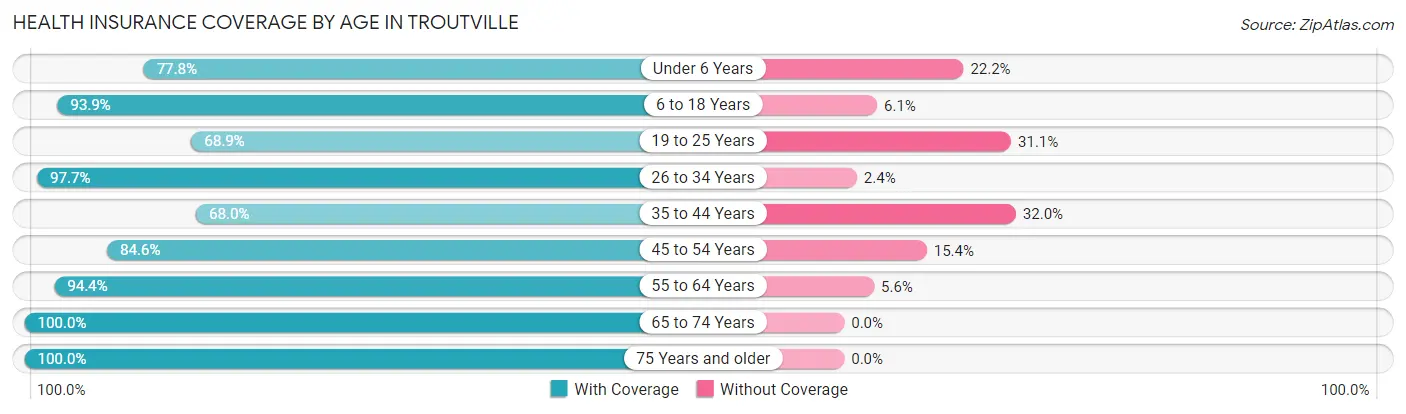
| Age Bracket | With Coverage | Without Coverage |
| Under 6 Years | 7 (77.8%) | 2 (22.2%) |
| 6 to 18 Years | 46 (93.9%) | 3 (6.1%) |
| 19 to 25 Years | 31 (68.9%) | 14 (31.1%) |
| 26 to 34 Years | 83 (97.7%) | 2 (2.4%) |
| 35 to 44 Years | 17 (68.0%) | 8 (32.0%) |
| 45 to 54 Years | 55 (84.6%) | 10 (15.4%) |
| 55 to 64 Years | 51 (94.4%) | 3 (5.6%) |
| 65 to 74 Years | 83 (100.0%) | 0 (0.0%) |
| 75 Years and older | 52 (100.0%) | 0 (0.0%) |
| Total | 425 (91.0%) | 42 (9.0%) |
Health Insurance Coverage by Citizenship Status in Troutville
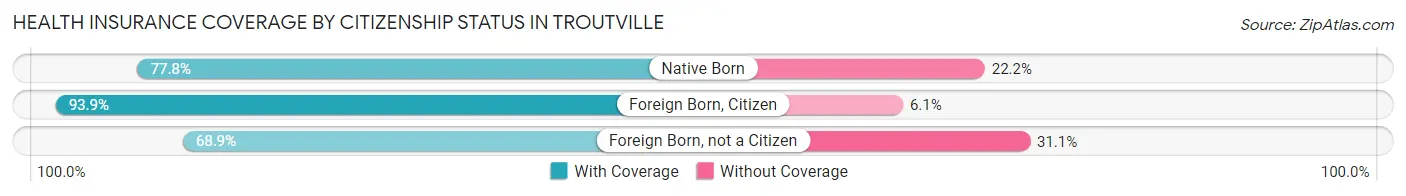
| Citizenship Status | With Coverage | Without Coverage |
| Native Born | 7 (77.8%) | 2 (22.2%) |
| Foreign Born, Citizen | 46 (93.9%) | 3 (6.1%) |
| Foreign Born, not a Citizen | 31 (68.9%) | 14 (31.1%) |
Health Insurance Coverage by Household Income in Troutville
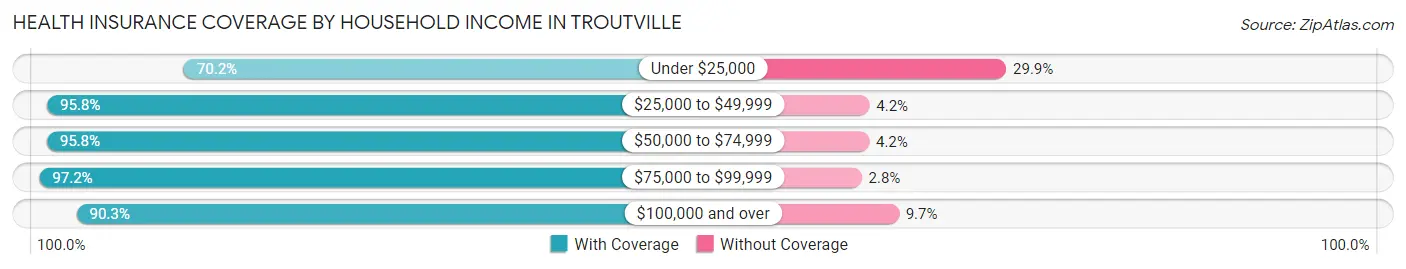
| Household Income | With Coverage | Without Coverage |
| Under $25,000 | 47 (70.2%) | 20 (29.8%) |
| $25,000 to $49,999 | 68 (95.8%) | 3 (4.2%) |
| $50,000 to $74,999 | 138 (95.8%) | 6 (4.2%) |
| $75,000 to $99,999 | 70 (97.2%) | 2 (2.8%) |
| $100,000 and over | 102 (90.3%) | 11 (9.7%) |
Public vs Private Health Insurance Coverage by Age in Troutville
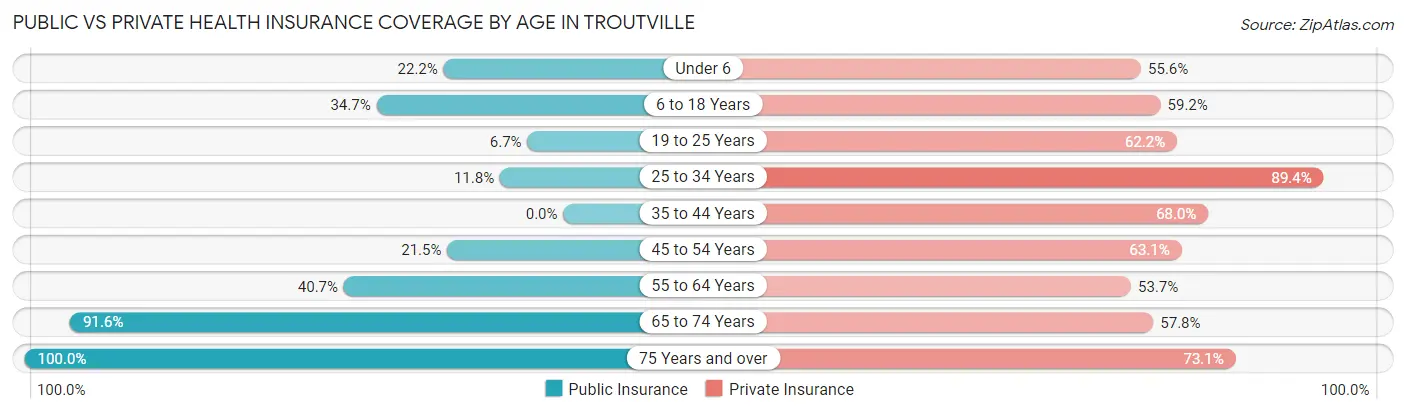
| Age Bracket | Public Insurance | Private Insurance |
| Under 6 | 2 (22.2%) | 5 (55.6%) |
| 6 to 18 Years | 17 (34.7%) | 29 (59.2%) |
| 19 to 25 Years | 3 (6.7%) | 28 (62.2%) |
| 25 to 34 Years | 10 (11.8%) | 76 (89.4%) |
| 35 to 44 Years | 0 (0.0%) | 17 (68.0%) |
| 45 to 54 Years | 14 (21.5%) | 41 (63.1%) |
| 55 to 64 Years | 22 (40.7%) | 29 (53.7%) |
| 65 to 74 Years | 76 (91.6%) | 48 (57.8%) |
| 75 Years and over | 52 (100.0%) | 38 (73.1%) |
| Total | 196 (42.0%) | 311 (66.6%) |
Disability Status by Sex by Age in Troutville
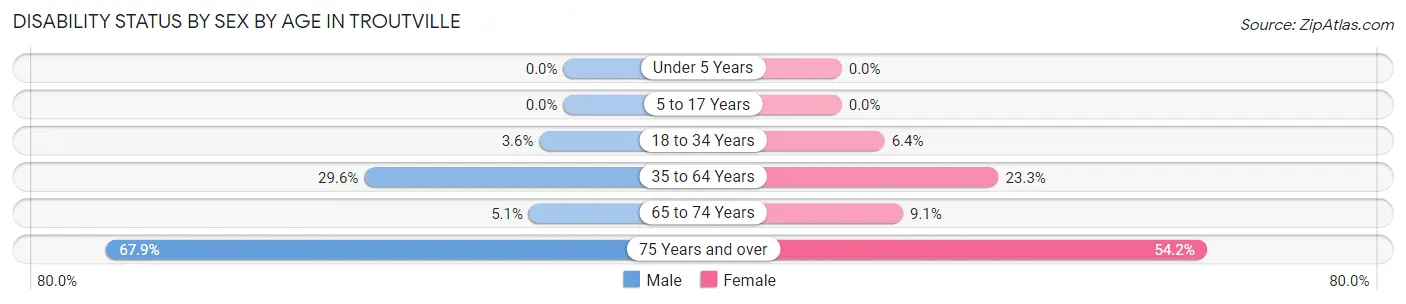
| Age Bracket | Male | Female |
| Under 5 Years | 0 (0.0%) | 0 (0.0%) |
| 5 to 17 Years | 0 (0.0%) | 0 (0.0%) |
| 18 to 34 Years | 3 (3.6%) | 3 (6.4%) |
| 35 to 64 Years | 21 (29.6%) | 17 (23.3%) |
| 65 to 74 Years | 2 (5.1%) | 4 (9.1%) |
| 75 Years and over | 19 (67.9%) | 13 (54.2%) |
Disability Class by Sex by Age in Troutville
Disability Class: Hearing Difficulty
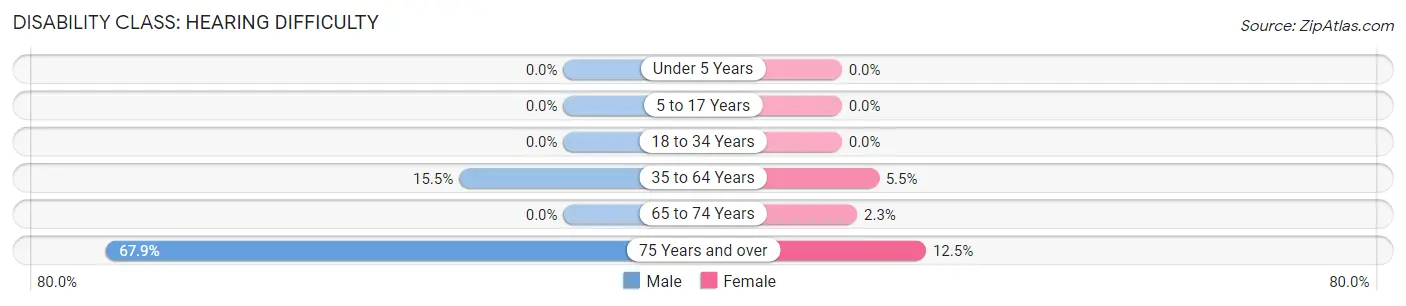
| Age Bracket | Male | Female |
| Under 5 Years | 0 (0.0%) | 0 (0.0%) |
| 5 to 17 Years | 0 (0.0%) | 0 (0.0%) |
| 18 to 34 Years | 0 (0.0%) | 0 (0.0%) |
| 35 to 64 Years | 11 (15.5%) | 4 (5.5%) |
| 65 to 74 Years | 0 (0.0%) | 1 (2.3%) |
| 75 Years and over | 19 (67.9%) | 3 (12.5%) |
Disability Class: Vision Difficulty
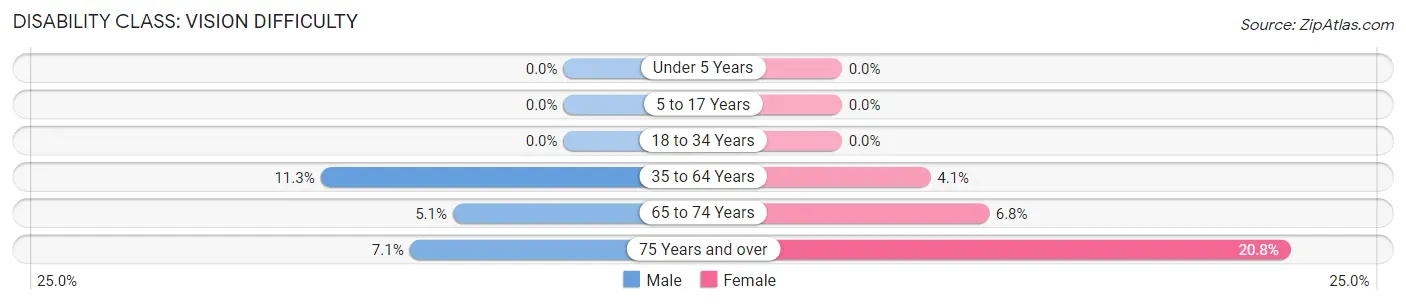
| Age Bracket | Male | Female |
| Under 5 Years | 0 (0.0%) | 0 (0.0%) |
| 5 to 17 Years | 0 (0.0%) | 0 (0.0%) |
| 18 to 34 Years | 0 (0.0%) | 0 (0.0%) |
| 35 to 64 Years | 8 (11.3%) | 3 (4.1%) |
| 65 to 74 Years | 2 (5.1%) | 3 (6.8%) |
| 75 Years and over | 2 (7.1%) | 5 (20.8%) |
Disability Class: Cognitive Difficulty
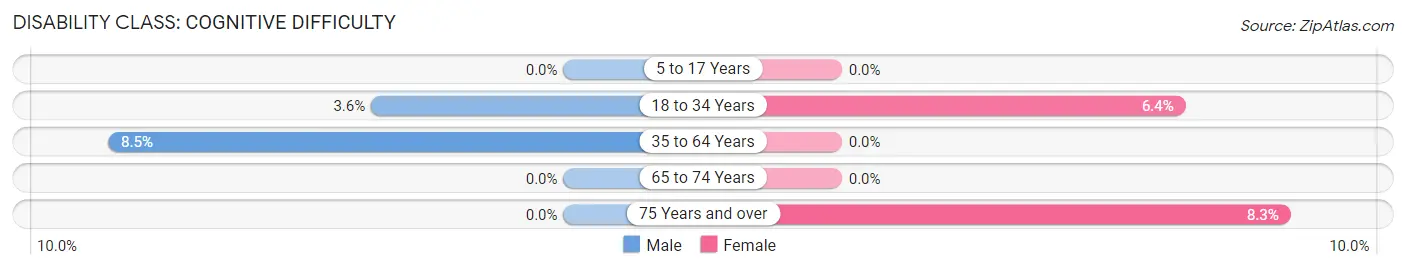
| Age Bracket | Male | Female |
| 5 to 17 Years | 0 (0.0%) | 0 (0.0%) |
| 18 to 34 Years | 3 (3.6%) | 3 (6.4%) |
| 35 to 64 Years | 6 (8.5%) | 0 (0.0%) |
| 65 to 74 Years | 0 (0.0%) | 0 (0.0%) |
| 75 Years and over | 0 (0.0%) | 2 (8.3%) |
Disability Class: Ambulatory Difficulty
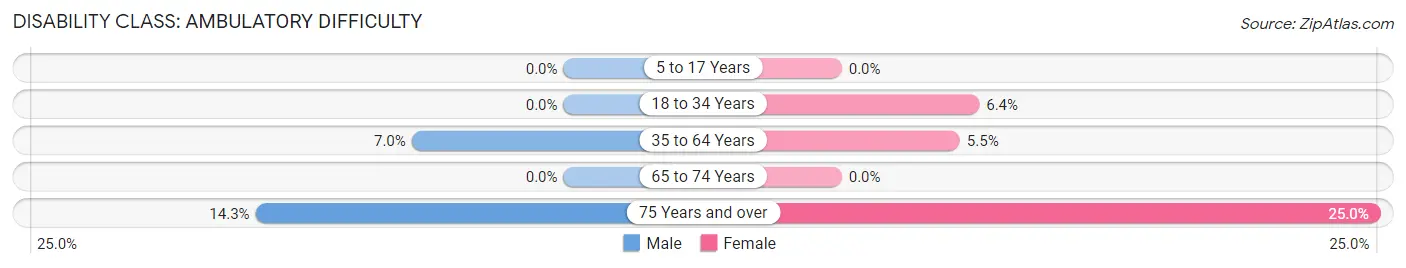
| Age Bracket | Male | Female |
| 5 to 17 Years | 0 (0.0%) | 0 (0.0%) |
| 18 to 34 Years | 0 (0.0%) | 3 (6.4%) |
| 35 to 64 Years | 5 (7.0%) | 4 (5.5%) |
| 65 to 74 Years | 0 (0.0%) | 0 (0.0%) |
| 75 Years and over | 4 (14.3%) | 6 (25.0%) |
Disability Class: Self-Care Difficulty

| Age Bracket | Male | Female |
| 5 to 17 Years | 0 (0.0%) | 0 (0.0%) |
| 18 to 34 Years | 0 (0.0%) | 3 (6.4%) |
| 35 to 64 Years | 2 (2.8%) | 4 (5.5%) |
| 65 to 74 Years | 0 (0.0%) | 0 (0.0%) |
| 75 Years and over | 2 (7.1%) | 0 (0.0%) |
Technology Access in Troutville
Computing Device Access in Troutville
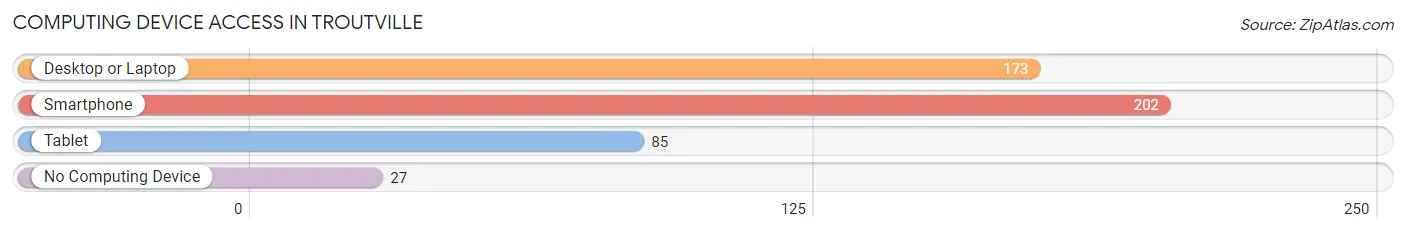
| Device Type | # Households | % Households |
| Desktop or Laptop | 173 | 70.6% |
| Smartphone | 202 | 82.5% |
| Tablet | 85 | 34.7% |
| No Computing Device | 27 | 11.0% |
| Total | 245 | 100.0% |
Internet Access in Troutville
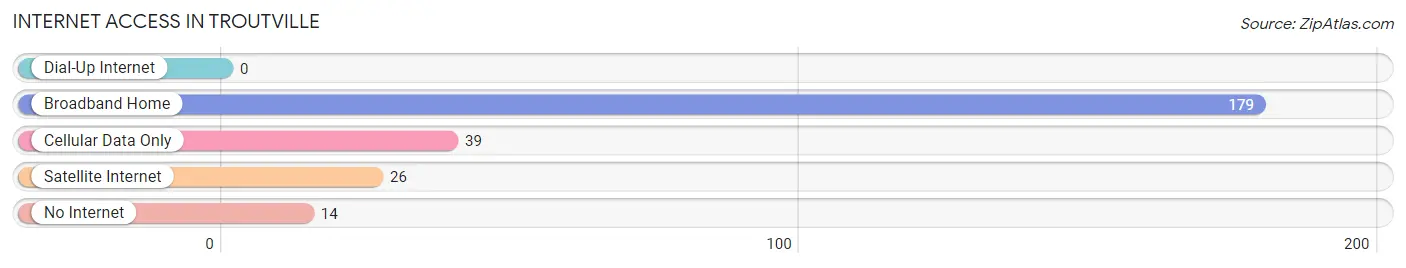
| Internet Type | # Households | % Households |
| Dial-Up Internet | 0 | 0.0% |
| Broadband Home | 179 | 73.1% |
| Cellular Data Only | 39 | 15.9% |
| Satellite Internet | 26 | 10.6% |
| No Internet | 14 | 5.7% |
| Total | 245 | 100.0% |
Troutville Summary
Troutville is a small town located in Botetourt County, Virginia. It is situated in the Roanoke Valley, about 10 miles north of Roanoke and about 20 miles south of Lexington. The town is located along the banks of the Roanoke River and is surrounded by the Blue Ridge Mountains. The population of Troutville was 1,717 at the 2000 census.
History
Troutville was first settled in the late 1700s by a group of German immigrants. The town was originally known as Troutville Station, named after the abundance of trout in the nearby river. The town was officially incorporated in 1883.
In the late 1800s, Troutville was a major stop on the Norfolk and Western Railroad. The railroad brought many new people to the area, and the town grew rapidly. The railroad also helped to make Troutville a major center for the timber industry.
In the early 1900s, Troutville was home to several large sawmills and lumber companies. The town was also home to a number of small businesses, including a general store, a blacksmith shop, and a grist mill.
Geography
Troutville is located in the Roanoke Valley, about 10 miles north of Roanoke and about 20 miles south of Lexington. The town is situated along the banks of the Roanoke River and is surrounded by the Blue Ridge Mountains. The town is located at an elevation of 1,068 feet.
The climate in Troutville is humid subtropical, with hot, humid summers and mild winters. The average annual temperature is 57 degrees Fahrenheit. The average annual precipitation is 43 inches.
Economy
Troutville’s economy is largely based on agriculture and tourism. The town is home to several farms, which produce a variety of crops, including corn, soybeans, and hay. Troutville is also home to several wineries, which produce a variety of wines.
Tourism is an important part of Troutville’s economy. The town is home to several attractions, including the Troutville Historical Museum, the Troutville Railroad Museum, and the Troutville Nature Center. The town is also home to several outdoor recreation areas, including the Troutville Recreation Area and the Troutville Wildlife Management Area.
Demographics
As of the 2000 census, the population of Troutville was 1,717. The racial makeup of the town was 97.2% White, 0.9% African American, 0.3% Native American, 0.2% Asian, 0.1% Pacific Islander, 0.3% from other races, and 0.9% from two or more races. Hispanic or Latino of any race were 1.2% of the population.
The median income for a household in Troutville was $37,500, and the median income for a family was $45,000. The per capita income for the town was $19,000. About 8.2% of families and 10.2% of the population were below the poverty line, including 13.2% of those under age 18 and 8.3% of those age 65 or over.
Common Questions
What is Per Capita Income in Troutville?
Per Capita income in Troutville is $34,208.
What is the Median Family Income in Troutville?
Median Family Income in Troutville is $62,273.
What is the Median Household income in Troutville?
Median Household Income in Troutville is $51,844.
What is Income or Wage Gap in Troutville?
Income or Wage Gap in Troutville is 42.9%.
Women in Troutville earn 57.1 cents for every dollar earned by a man.
What is Inequality or Gini Index in Troutville?
Inequality or Gini Index in Troutville is 0.38.
What is the Total Population of Troutville?
Total Population of Troutville is 467.
What is the Total Male Population of Troutville?
Total Male Population of Troutville is 246.
What is the Total Female Population of Troutville?
Total Female Population of Troutville is 221.
What is the Ratio of Males per 100 Females in Troutville?
There are 111.31 Males per 100 Females in Troutville.
What is the Ratio of Females per 100 Males in Troutville?
There are 89.84 Females per 100 Males in Troutville.
What is the Median Population Age in Troutville?
Median Population Age in Troutville is 49.1 Years.
What is the Average Family Size in Troutville
Average Family Size in Troutville is 2.6 People.
What is the Average Household Size in Troutville
Average Household Size in Troutville is 1.9 People.
How Large is the Labor Force in Troutville?
There are 218 People in the Labor Forcein in Troutville.
What is the Percentage of People in the Labor Force in Troutville?
52.4% of People are in the Labor Force in Troutville.
What is the Unemployment Rate in Troutville?
Unemployment Rate in Troutville is 1.4%.