Zip Codes with the Highest Percentage of Population Employed in Real Estate, Rental & Leasing in Gilmer, TX
RELATED REPORTS & OPTIONS
Real Estate, Rental & Leasing
Gilmer
Compare Zip Codes
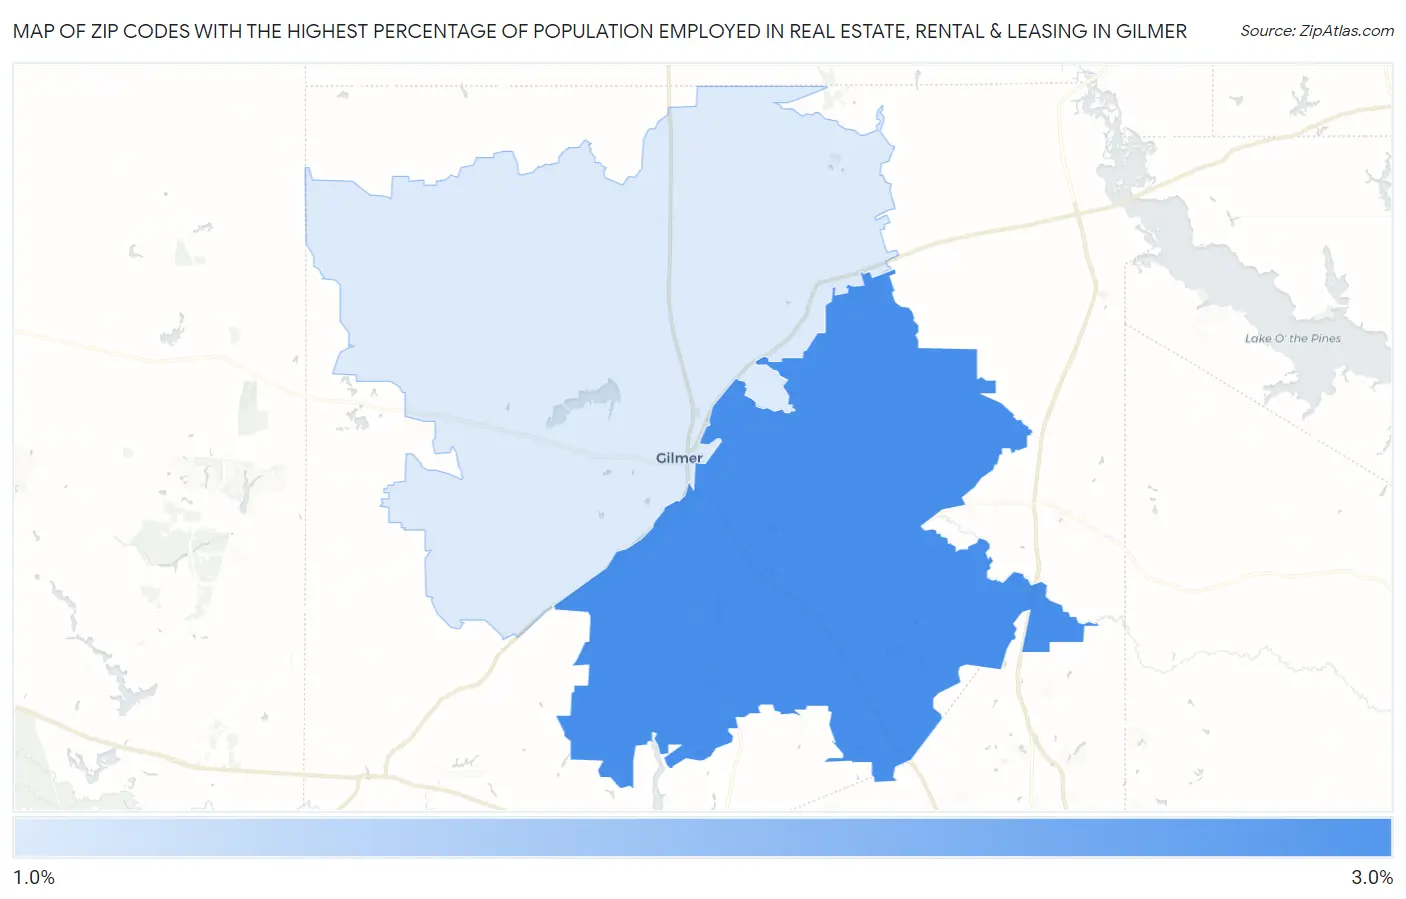
Map of Zip Codes with the Highest Percentage of Population Employed in Real Estate, Rental & Leasing in Gilmer
1.3%
2.9%
Zip Codes with the Highest Percentage of Population Employed in Real Estate, Rental & Leasing in Gilmer, TX
| Zip Code | % Employed | vs State | vs National | |
| 1. | 75645 | 2.9% | 2.0%(+0.881)#290 | 1.9%(+0.997)#4,203 |
| 2. | 75644 | 1.3% | 2.0%(-0.697)#902 | 1.9%(-0.581)#12,646 |
1
Common Questions
What are the Top Zip Codes with the Highest Percentage of Population Employed in Real Estate, Rental & Leasing in Gilmer, TX?
Top Zip Codes with the Highest Percentage of Population Employed in Real Estate, Rental & Leasing in Gilmer, TX are:
What zip code has the Highest Percentage of Population Employed in Real Estate, Rental & Leasing in Gilmer, TX?
75645 has the Highest Percentage of Population Employed in Real Estate, Rental & Leasing in Gilmer, TX with 2.9%.
What is the Percentage of Population Employed in Real Estate, Rental & Leasing in Gilmer, TX?
Percentage of Population Employed in Real Estate, Rental & Leasing in Gilmer is 2.3%.
What is the Percentage of Population Employed in Real Estate, Rental & Leasing in Texas?
Percentage of Population Employed in Real Estate, Rental & Leasing in Texas is 2.0%.
What is the Percentage of Population Employed in Real Estate, Rental & Leasing in the United States?
Percentage of Population Employed in Real Estate, Rental & Leasing in the United States is 1.9%.