Zip Codes with the Highest Percentage of Population Employed in Installation, Maintenance & Repair in North Richland Hills, TX
RELATED REPORTS & OPTIONS
Installation, Maintenance & Repair
North Richland Hills
Compare Zip Codes
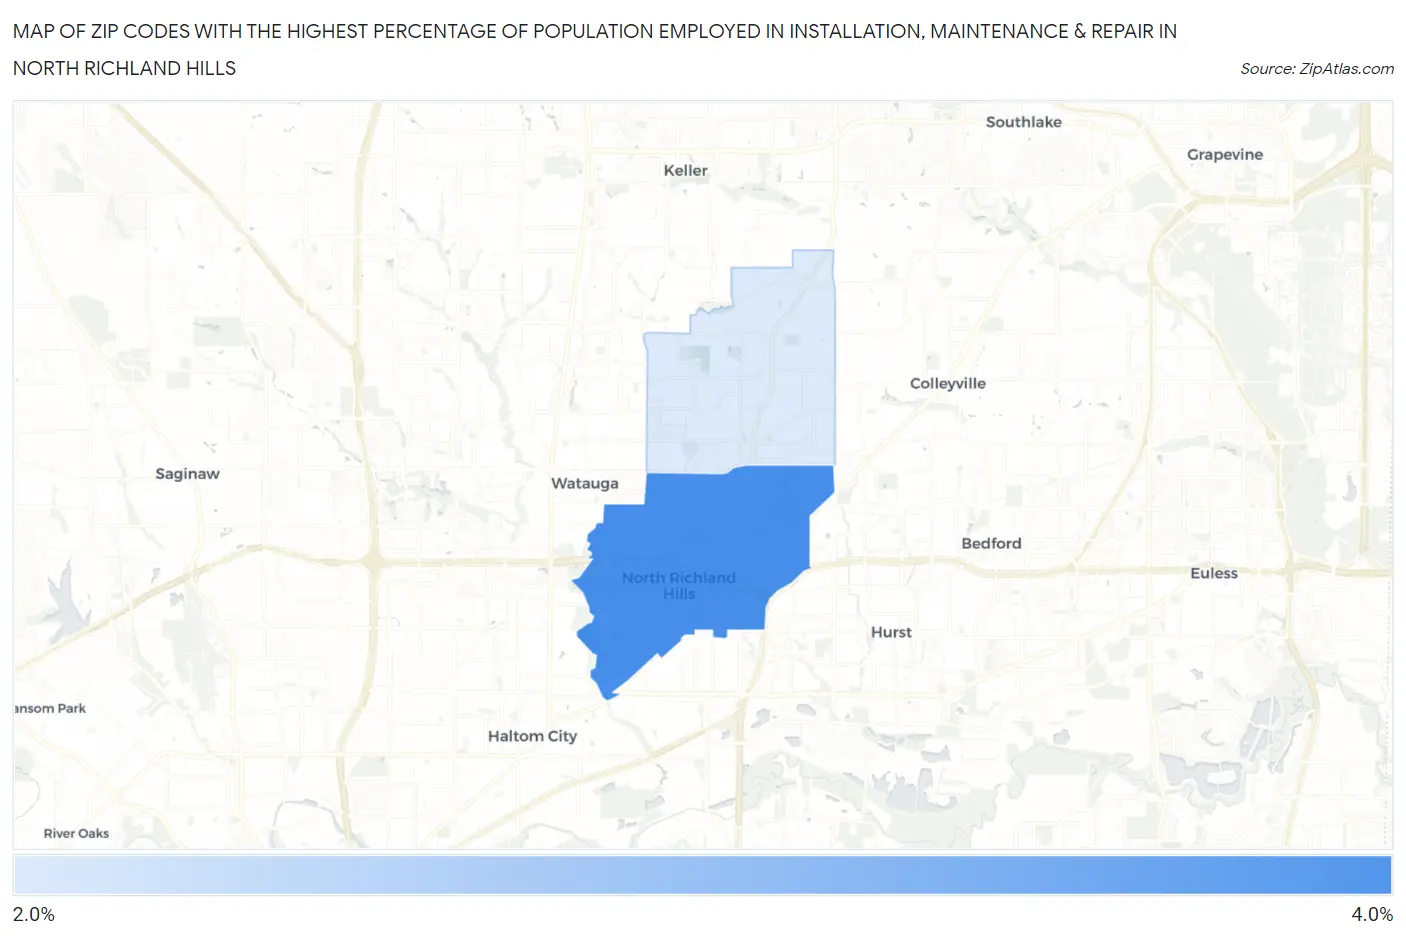
Map of Zip Codes with the Highest Percentage of Population Employed in Installation, Maintenance & Repair in North Richland Hills
2.9%
3.2%
Zip Codes with the Highest Percentage of Population Employed in Installation, Maintenance & Repair in North Richland Hills, TX
| Zip Code | % Employed | vs State | vs National | |
| 1. | 76180 | 3.2% | 3.4%(-0.211)#1,000 | 3.1%(+0.125)#16,067 |
| 2. | 76182 | 2.9% | 3.4%(-0.533)#1,094 | 3.1%(-0.198)#17,664 |
1
Common Questions
What are the Top Zip Codes with the Highest Percentage of Population Employed in Installation, Maintenance & Repair in North Richland Hills, TX?
Top Zip Codes with the Highest Percentage of Population Employed in Installation, Maintenance & Repair in North Richland Hills, TX are:
What zip code has the Highest Percentage of Population Employed in Installation, Maintenance & Repair in North Richland Hills, TX?
76180 has the Highest Percentage of Population Employed in Installation, Maintenance & Repair in North Richland Hills, TX with 3.2%.
What is the Percentage of Population Employed in Installation, Maintenance & Repair in North Richland Hills, TX?
Percentage of Population Employed in Installation, Maintenance & Repair in North Richland Hills is 3.1%.
What is the Percentage of Population Employed in Installation, Maintenance & Repair in Texas?
Percentage of Population Employed in Installation, Maintenance & Repair in Texas is 3.4%.
What is the Percentage of Population Employed in Installation, Maintenance & Repair in the United States?
Percentage of Population Employed in Installation, Maintenance & Repair in the United States is 3.1%.