Zip Codes with the Highest Percentage of Population Employed in Installation, Maintenance & Repair in Garland, TX
RELATED REPORTS & OPTIONS
Installation, Maintenance & Repair
Garland
Compare Zip Codes
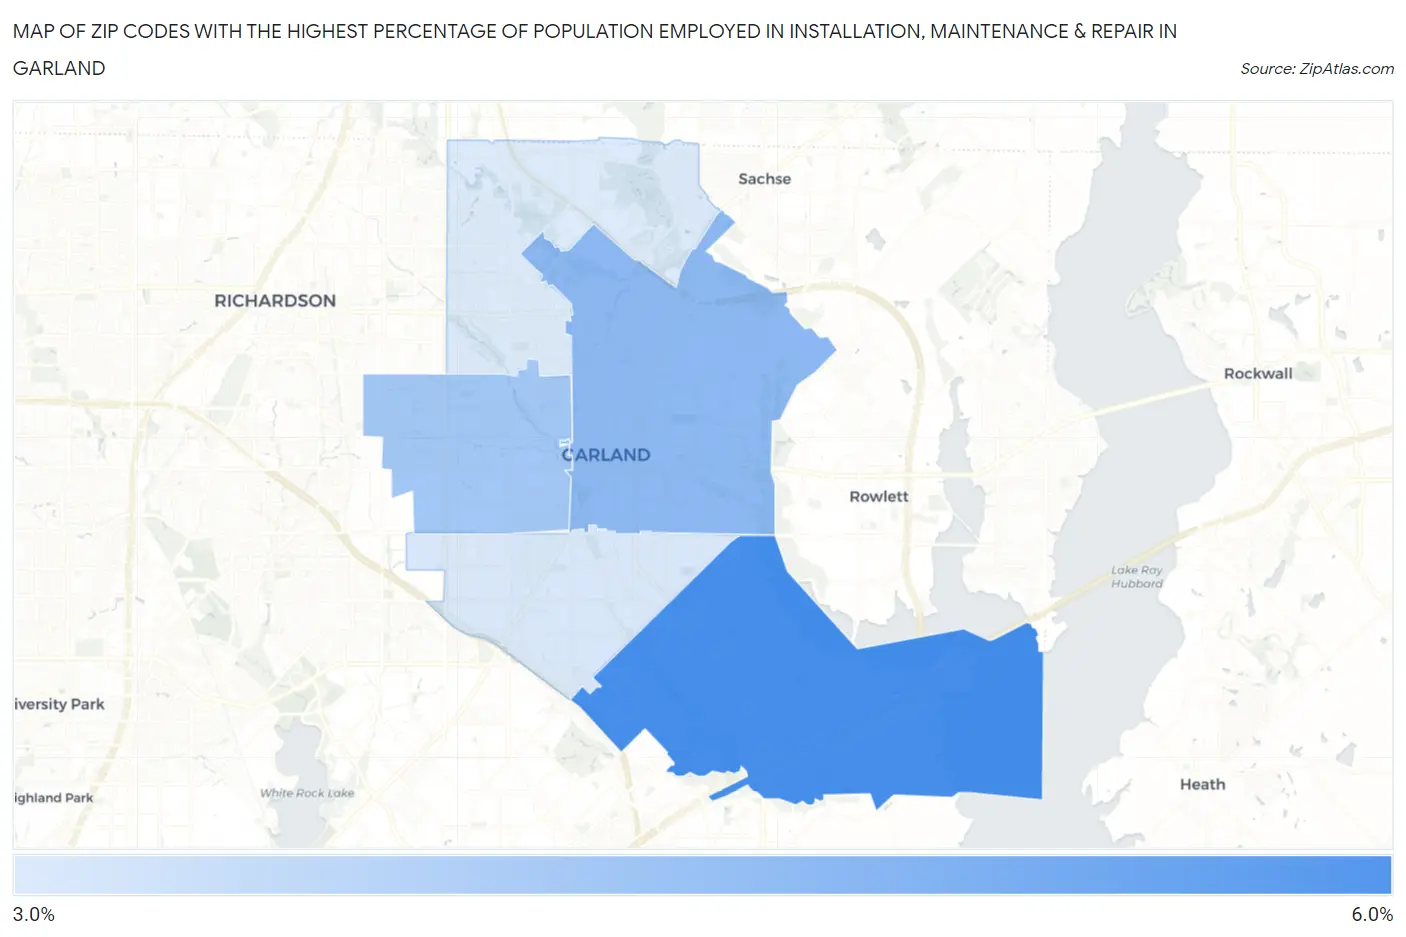
Map of Zip Codes with the Highest Percentage of Population Employed in Installation, Maintenance & Repair in Garland
3.4%
5.7%
Zip Codes with the Highest Percentage of Population Employed in Installation, Maintenance & Repair in Garland, TX
| Zip Code | % Employed | vs State | vs National | |
| 1. | 75043 | 5.7% | 3.4%(+2.29)#396 | 3.1%(+2.63)#6,795 |
| 2. | 75040 | 4.6% | 3.4%(+1.24)#613 | 3.1%(+1.57)#9,908 |
| 3. | 75042 | 4.3% | 3.4%(+0.878)#684 | 3.1%(+1.21)#11,232 |
| 4. | 75041 | 3.5% | 3.4%(+0.070)#901 | 3.1%(+0.406)#14,740 |
| 5. | 75044 | 3.4% | 3.4%(-0.002)#935 | 3.1%(+0.333)#15,081 |
1
Common Questions
What are the Top 3 Zip Codes with the Highest Percentage of Population Employed in Installation, Maintenance & Repair in Garland, TX?
Top 3 Zip Codes with the Highest Percentage of Population Employed in Installation, Maintenance & Repair in Garland, TX are:
What zip code has the Highest Percentage of Population Employed in Installation, Maintenance & Repair in Garland, TX?
75043 has the Highest Percentage of Population Employed in Installation, Maintenance & Repair in Garland, TX with 5.7%.
What is the Percentage of Population Employed in Installation, Maintenance & Repair in Garland, TX?
Percentage of Population Employed in Installation, Maintenance & Repair in Garland is 4.5%.
What is the Percentage of Population Employed in Installation, Maintenance & Repair in Texas?
Percentage of Population Employed in Installation, Maintenance & Repair in Texas is 3.4%.
What is the Percentage of Population Employed in Installation, Maintenance & Repair in the United States?
Percentage of Population Employed in Installation, Maintenance & Repair in the United States is 3.1%.