Zip Codes with the Highest Percentage of Population with a Degree in Science and Engineering in Chattanooga, TN
RELATED REPORTS & OPTIONS
Science and Engineering
Chattanooga
Compare Zip Codes
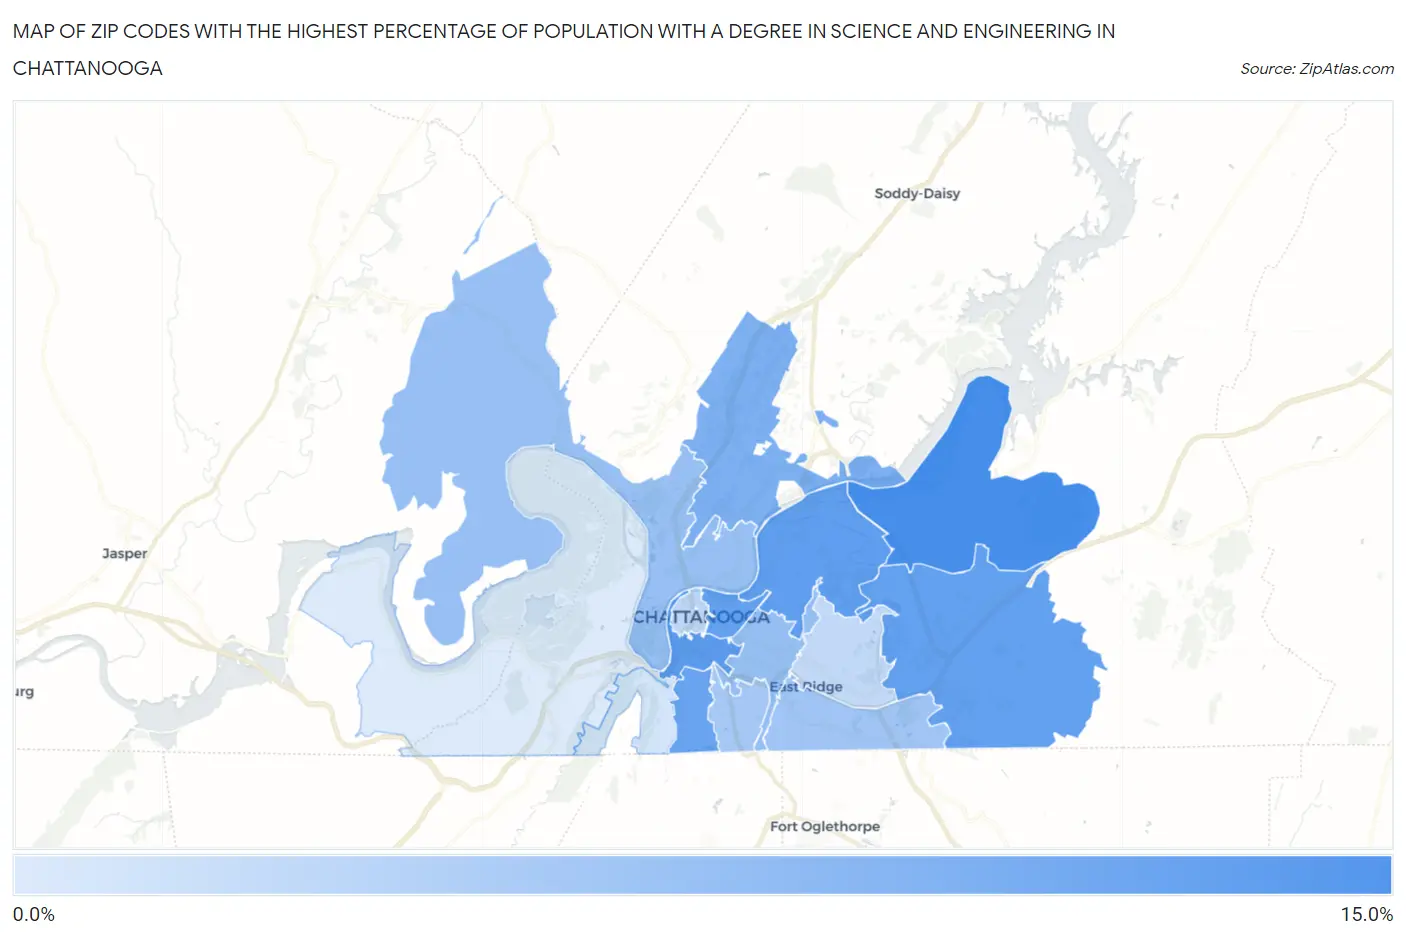
Map of Zip Codes with the Highest Percentage of Population with a Degree in Science and Engineering in Chattanooga
4.1%
14.5%
Zip Codes with the Highest Percentage of Population with a Degree in Science and Engineering in Chattanooga, TN
| Zip Code | % Graduates | vs State | vs National | |
| 1. | 37416 | 14.5% | 10.9%(+3.55)#160 | 9.8%(+4.69)#7,271 |
| 2. | 37408 | 13.0% | 10.9%(+2.11)#199 | 9.8%(+3.25)#9,213 |
| 3. | 37406 | 12.7% | 10.9%(+1.78)#210 | 9.8%(+2.91)#9,710 |
| 4. | 37421 | 12.5% | 10.9%(+1.61)#219 | 9.8%(+2.75)#9,972 |
| 5. | 37403 | 12.5% | 10.9%(+1.58)#222 | 9.8%(+2.72)#10,005 |
| 6. | 37410 | 11.9% | 10.9%(+0.996)#234 | 9.8%(+2.13)#11,043 |
| 7. | 37415 | 10.6% | 10.9%(-0.280)#289 | 9.8%(+0.858)#13,656 |
| 8. | 37404 | 9.0% | 10.9%(-1.95)#372 | 9.8%(-0.815)#17,415 |
| 9. | 37405 | 8.8% | 10.9%(-2.16)#384 | 9.8%(-1.03)#17,899 |
| 10. | 37412 | 8.1% | 10.9%(-2.81)#420 | 9.8%(-1.67)#19,396 |
| 11. | 37407 | 7.8% | 10.9%(-3.11)#429 | 9.8%(-1.97)#20,073 |
| 12. | 37402 | 6.3% | 10.9%(-4.64)#484 | 9.8%(-3.50)#22,955 |
| 13. | 37411 | 6.0% | 10.9%(-4.94)#488 | 9.8%(-3.81)#23,476 |
| 14. | 37409 | 4.7% | 10.9%(-6.26)#510 | 9.8%(-5.12)#25,119 |
| 15. | 37419 | 4.1% | 10.9%(-6.80)#519 | 9.8%(-5.66)#25,630 |
1
Common Questions
What are the Top 10 Zip Codes with the Highest Percentage of Population with a Degree in Science and Engineering in Chattanooga, TN?
Top 10 Zip Codes with the Highest Percentage of Population with a Degree in Science and Engineering in Chattanooga, TN are:
What zip code has the Highest Percentage of Population with a Degree in Science and Engineering in Chattanooga, TN?
37416 has the Highest Percentage of Population with a Degree in Science and Engineering in Chattanooga, TN with 14.5%.
What is the Percentage of Population with a Degree in Science and Engineering in Chattanooga, TN?
Percentage of Population with a Degree in Science and Engineering in Chattanooga is 10.5%.
What is the Percentage of Population with a Degree in Science and Engineering in Tennessee?
Percentage of Population with a Degree in Science and Engineering in Tennessee is 10.9%.
What is the Percentage of Population with a Degree in Science and Engineering in the United States?
Percentage of Population with a Degree in Science and Engineering in the United States is 9.8%.