Zip Codes with the Highest Percentage of Population with a Degree in Science and Engineering in Maryville, TN
RELATED REPORTS & OPTIONS
Science and Engineering
Maryville
Compare Zip Codes
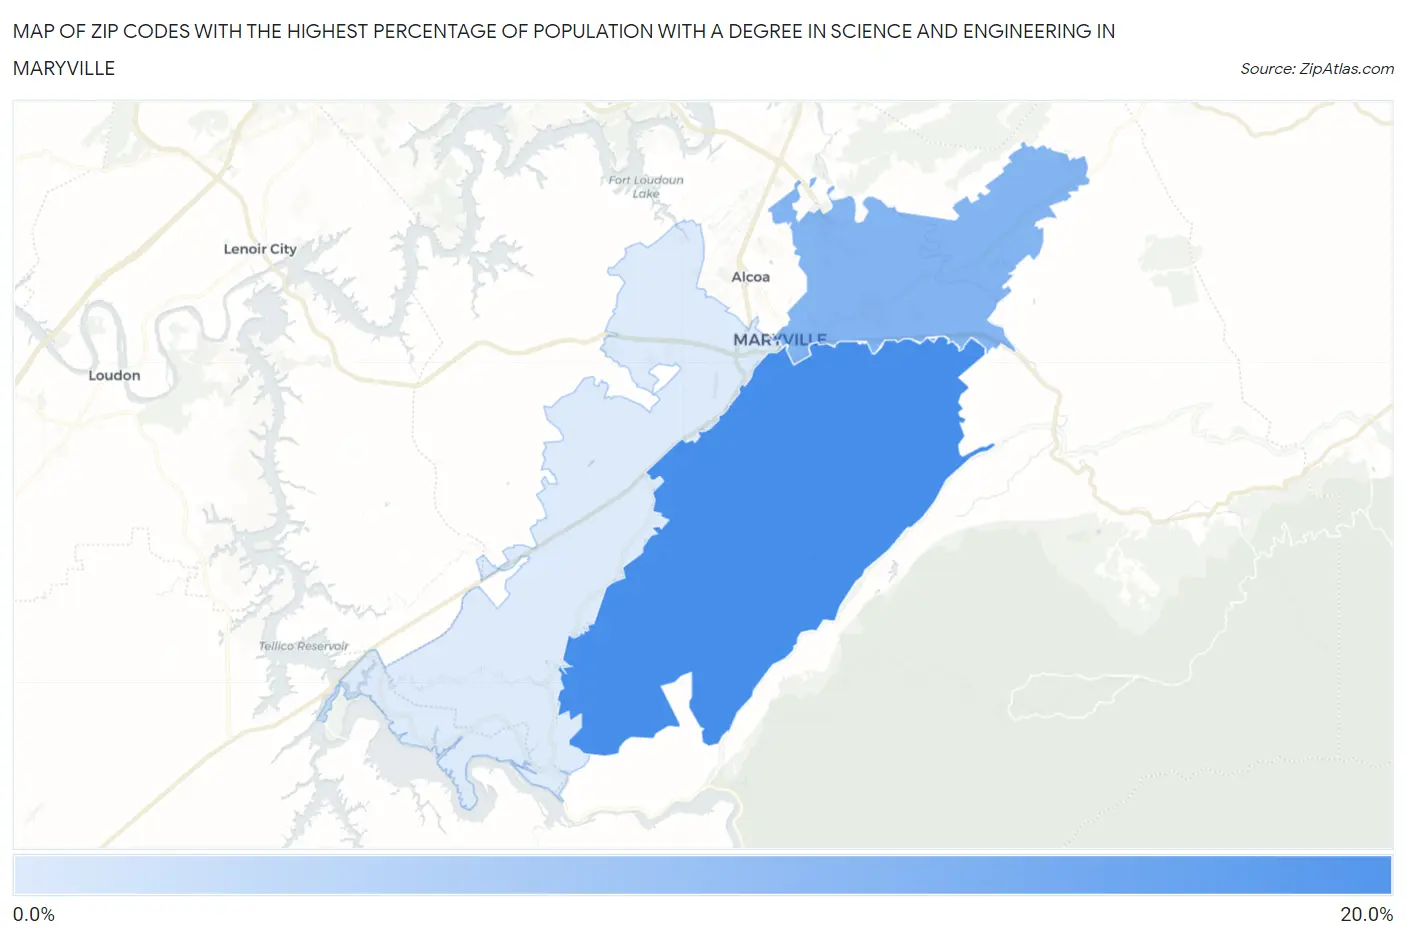
Map of Zip Codes with the Highest Percentage of Population with a Degree in Science and Engineering in Maryville
8.5%
15.9%
Zip Codes with the Highest Percentage of Population with a Degree in Science and Engineering in Maryville, TN
| Zip Code | % Graduates | vs State | vs National | |
| 1. | 37803 | 15.9% | 10.9%(+4.97)#118 | 9.8%(+6.10)#5,814 |
| 2. | 37804 | 12.8% | 10.9%(+1.93)#206 | 9.8%(+3.06)#9,484 |
| 3. | 37801 | 8.5% | 10.9%(-2.45)#396 | 9.8%(-1.31)#18,533 |
1
Common Questions
What are the Top Zip Codes with the Highest Percentage of Population with a Degree in Science and Engineering in Maryville, TN?
Top Zip Codes with the Highest Percentage of Population with a Degree in Science and Engineering in Maryville, TN are:
What zip code has the Highest Percentage of Population with a Degree in Science and Engineering in Maryville, TN?
37803 has the Highest Percentage of Population with a Degree in Science and Engineering in Maryville, TN with 15.9%.
What is the Percentage of Population with a Degree in Science and Engineering in Maryville, TN?
Percentage of Population with a Degree in Science and Engineering in Maryville is 12.7%.
What is the Percentage of Population with a Degree in Science and Engineering in Tennessee?
Percentage of Population with a Degree in Science and Engineering in Tennessee is 10.9%.
What is the Percentage of Population with a Degree in Science and Engineering in the United States?
Percentage of Population with a Degree in Science and Engineering in the United States is 9.8%.