Zip Codes with the Highest Percentage of Population Employed in Administrative & Support Services in Maryville, TN
RELATED REPORTS & OPTIONS
Administrative & Support Services
Maryville
Compare Zip Codes
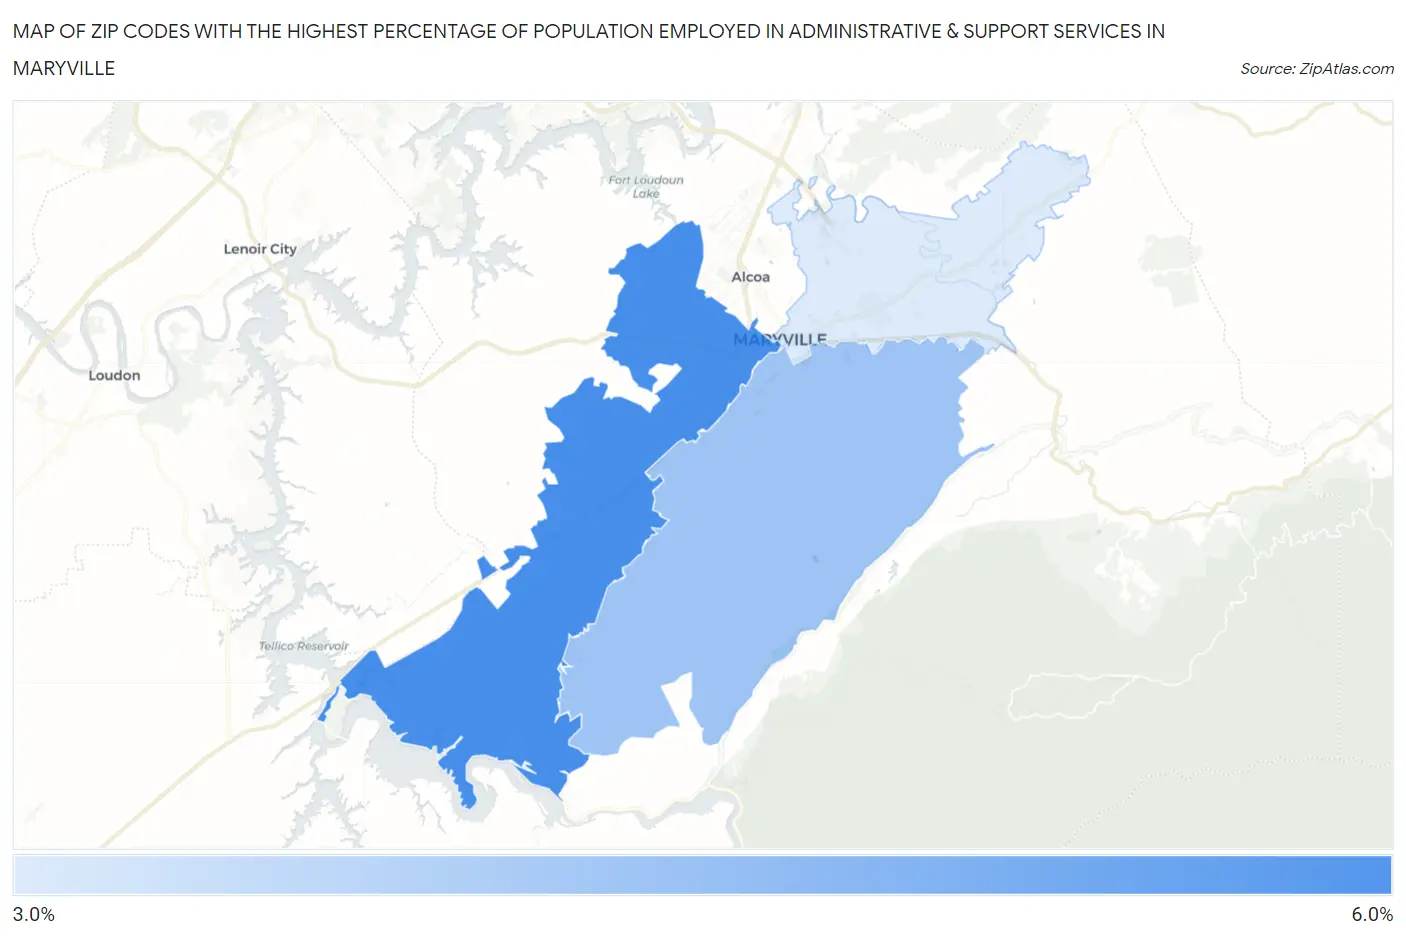
Map of Zip Codes with the Highest Percentage of Population Employed in Administrative & Support Services in Maryville
3.7%
5.8%
Zip Codes with the Highest Percentage of Population Employed in Administrative & Support Services in Maryville, TN
| Zip Code | % Employed | vs State | vs National | |
| 1. | 37801 | 5.8% | 4.4%(+1.41)#111 | 4.1%(+1.62)#5,228 |
| 2. | 37803 | 4.6% | 4.4%(+0.216)#175 | 4.1%(+0.419)#8,474 |
| 3. | 37804 | 3.7% | 4.4%(-0.609)#255 | 4.1%(-0.406)#11,798 |
1
Common Questions
What are the Top Zip Codes with the Highest Percentage of Population Employed in Administrative & Support Services in Maryville, TN?
Top Zip Codes with the Highest Percentage of Population Employed in Administrative & Support Services in Maryville, TN are:
What zip code has the Highest Percentage of Population Employed in Administrative & Support Services in Maryville, TN?
37801 has the Highest Percentage of Population Employed in Administrative & Support Services in Maryville, TN with 5.8%.
What is the Percentage of Population Employed in Administrative & Support Services in Maryville, TN?
Percentage of Population Employed in Administrative & Support Services in Maryville is 3.5%.
What is the Percentage of Population Employed in Administrative & Support Services in Tennessee?
Percentage of Population Employed in Administrative & Support Services in Tennessee is 4.4%.
What is the Percentage of Population Employed in Administrative & Support Services in the United States?
Percentage of Population Employed in Administrative & Support Services in the United States is 4.1%.