Syrian vs Bermudan Receiving Food Stamps
COMPARE
Syrian
Bermudan
Receiving Food Stamps
Receiving Food Stamps Comparison
Syrians
Bermudans
11.0%
RECEIVING FOOD STAMPS
85.5/ 100
METRIC RATING
144th/ 347
METRIC RANK
13.0%
RECEIVING FOOD STAMPS
4.8/ 100
METRIC RATING
221st/ 347
METRIC RANK
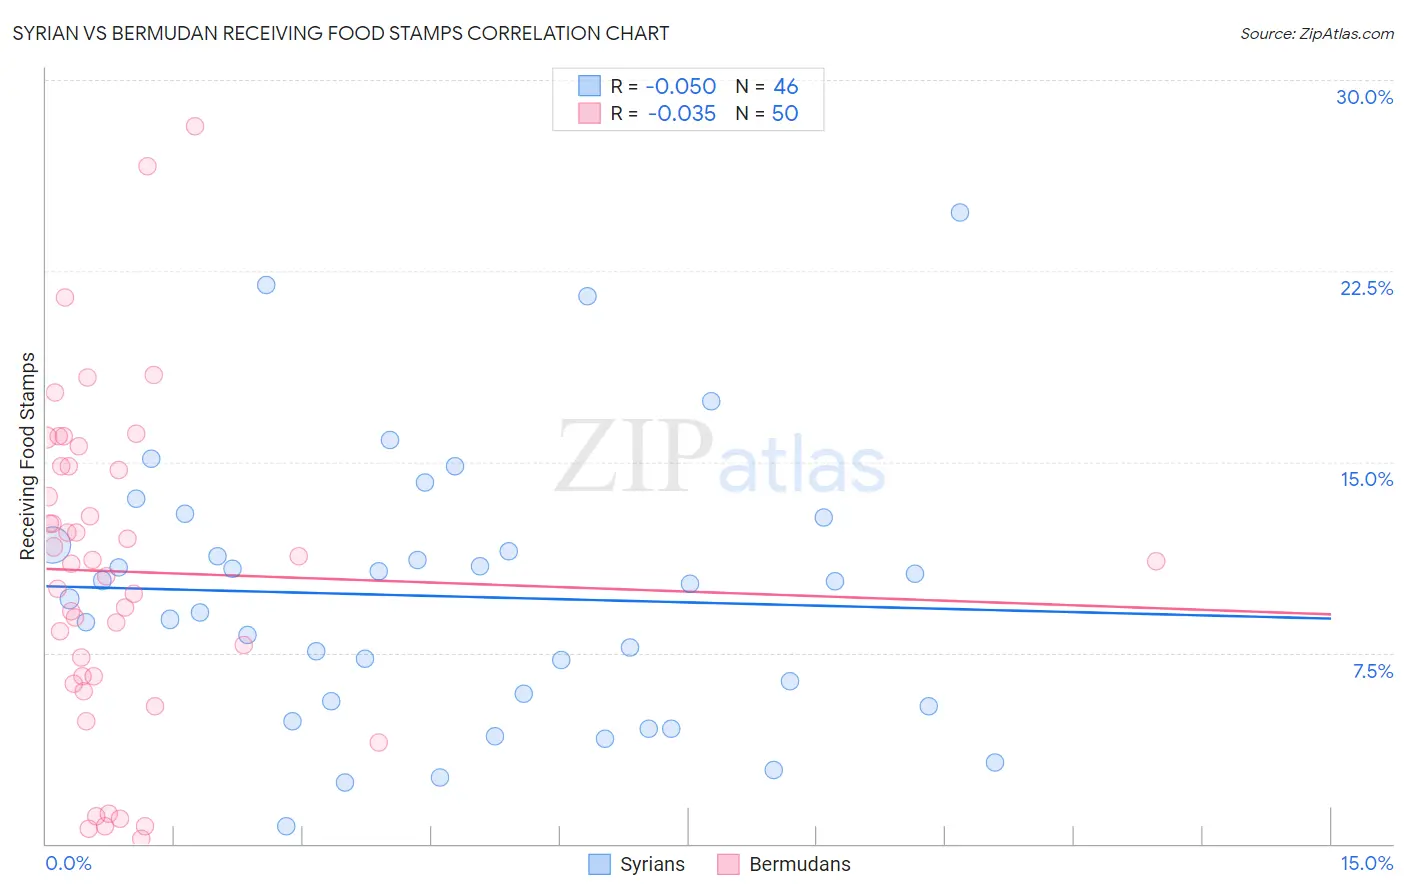
Syrian vs Bermudan Receiving Food Stamps Correlation Chart
The statistical analysis conducted on geographies consisting of 265,711,936 people shows a slight negative correlation between the proportion of Syrians and percentage of population receiving government assistance and/or food stamps in the United States with a correlation coefficient (R) of -0.050 and weighted average of 11.0%. Similarly, the statistical analysis conducted on geographies consisting of 55,651,694 people shows no correlation between the proportion of Bermudans and percentage of population receiving government assistance and/or food stamps in the United States with a correlation coefficient (R) of -0.035 and weighted average of 13.0%, a difference of 17.8%.
Receiving Food Stamps Correlation Summary
| Measurement | Syrian | Bermudan |
| Minimum | 0.68% | 0.20% |
| Maximum | 24.8% | 28.2% |
| Range | 24.1% | 28.0% |
| Mean | 9.7% | 10.7% |
| Median | 9.9% | 11.1% |
| Interquartile 25% (IQ1) | 5.6% | 6.6% |
| Interquartile 75% (IQ3) | 11.7% | 14.8% |
| Interquartile Range (IQR) | 6.1% | 8.2% |
| Standard Deviation (Sample) | 5.3% | 6.3% |
| Standard Deviation (Population) | 5.2% | 6.3% |
Similar Demographics by Receiving Food Stamps
Demographics Similar to Syrians by Receiving Food Stamps
In terms of receiving food stamps, the demographic groups most similar to Syrians are Hungarian (11.0%, a difference of 0.12%), Immigrants from Northern Africa (11.0%, a difference of 0.15%), Chilean (11.0%, a difference of 0.23%), Taiwanese (11.0%, a difference of 0.36%), and Immigrants from Vietnam (11.0%, a difference of 0.40%).
| Demographics | Rating | Rank | Receiving Food Stamps |
| Immigrants | Eastern Europe | 89.8 /100 | #137 | Excellent 10.8% |
| Immigrants | Moldova | 88.5 /100 | #138 | Excellent 10.9% |
| Hmong | 88.4 /100 | #139 | Excellent 10.9% |
| Celtics | 87.8 /100 | #140 | Excellent 10.9% |
| Immigrants | Vietnam | 86.7 /100 | #141 | Excellent 11.0% |
| Chileans | 86.2 /100 | #142 | Excellent 11.0% |
| Immigrants | Northern Africa | 86.0 /100 | #143 | Excellent 11.0% |
| Syrians | 85.5 /100 | #144 | Excellent 11.0% |
| Hungarians | 85.1 /100 | #145 | Excellent 11.0% |
| Taiwanese | 84.2 /100 | #146 | Excellent 11.0% |
| Whites/Caucasians | 83.9 /100 | #147 | Excellent 11.1% |
| Immigrants | South Eastern Asia | 83.3 /100 | #148 | Excellent 11.1% |
| Brazilians | 83.2 /100 | #149 | Excellent 11.1% |
| Soviet Union | 83.1 /100 | #150 | Excellent 11.1% |
| Immigrants | Spain | 81.7 /100 | #151 | Excellent 11.1% |
Demographics Similar to Bermudans by Receiving Food Stamps
In terms of receiving food stamps, the demographic groups most similar to Bermudans are Immigrants (13.0%, a difference of 0.26%), Immigrants from Albania (13.0%, a difference of 0.30%), Immigrants from Colombia (12.9%, a difference of 0.32%), Immigrants from Middle Africa (12.9%, a difference of 0.36%), and Hawaiian (12.9%, a difference of 0.37%).
| Demographics | Rating | Rank | Receiving Food Stamps |
| Immigrants | Africa | 7.6 /100 | #214 | Tragic 12.8% |
| Native Hawaiians | 6.7 /100 | #215 | Tragic 12.8% |
| Immigrants | South America | 6.5 /100 | #216 | Tragic 12.8% |
| Immigrants | Burma/Myanmar | 6.0 /100 | #217 | Tragic 12.9% |
| Hawaiians | 5.4 /100 | #218 | Tragic 12.9% |
| Immigrants | Middle Africa | 5.4 /100 | #219 | Tragic 12.9% |
| Immigrants | Colombia | 5.3 /100 | #220 | Tragic 12.9% |
| Bermudans | 4.8 /100 | #221 | Tragic 13.0% |
| Immigrants | Immigrants | 4.4 /100 | #222 | Tragic 13.0% |
| Immigrants | Albania | 4.4 /100 | #223 | Tragic 13.0% |
| Immigrants | Armenia | 4.3 /100 | #224 | Tragic 13.0% |
| Fijians | 4.3 /100 | #225 | Tragic 13.0% |
| Chickasaw | 3.6 /100 | #226 | Tragic 13.1% |
| Nigerians | 3.5 /100 | #227 | Tragic 13.1% |
| Panamanians | 3.5 /100 | #228 | Tragic 13.1% |