Syrian vs Spaniard Receiving Food Stamps
COMPARE
Syrian
Spaniard
Receiving Food Stamps
Receiving Food Stamps Comparison
Syrians
Spaniards
11.0%
RECEIVING FOOD STAMPS
85.5/ 100
METRIC RATING
144th/ 347
METRIC RANK
11.9%
RECEIVING FOOD STAMPS
39.8/ 100
METRIC RATING
184th/ 347
METRIC RANK
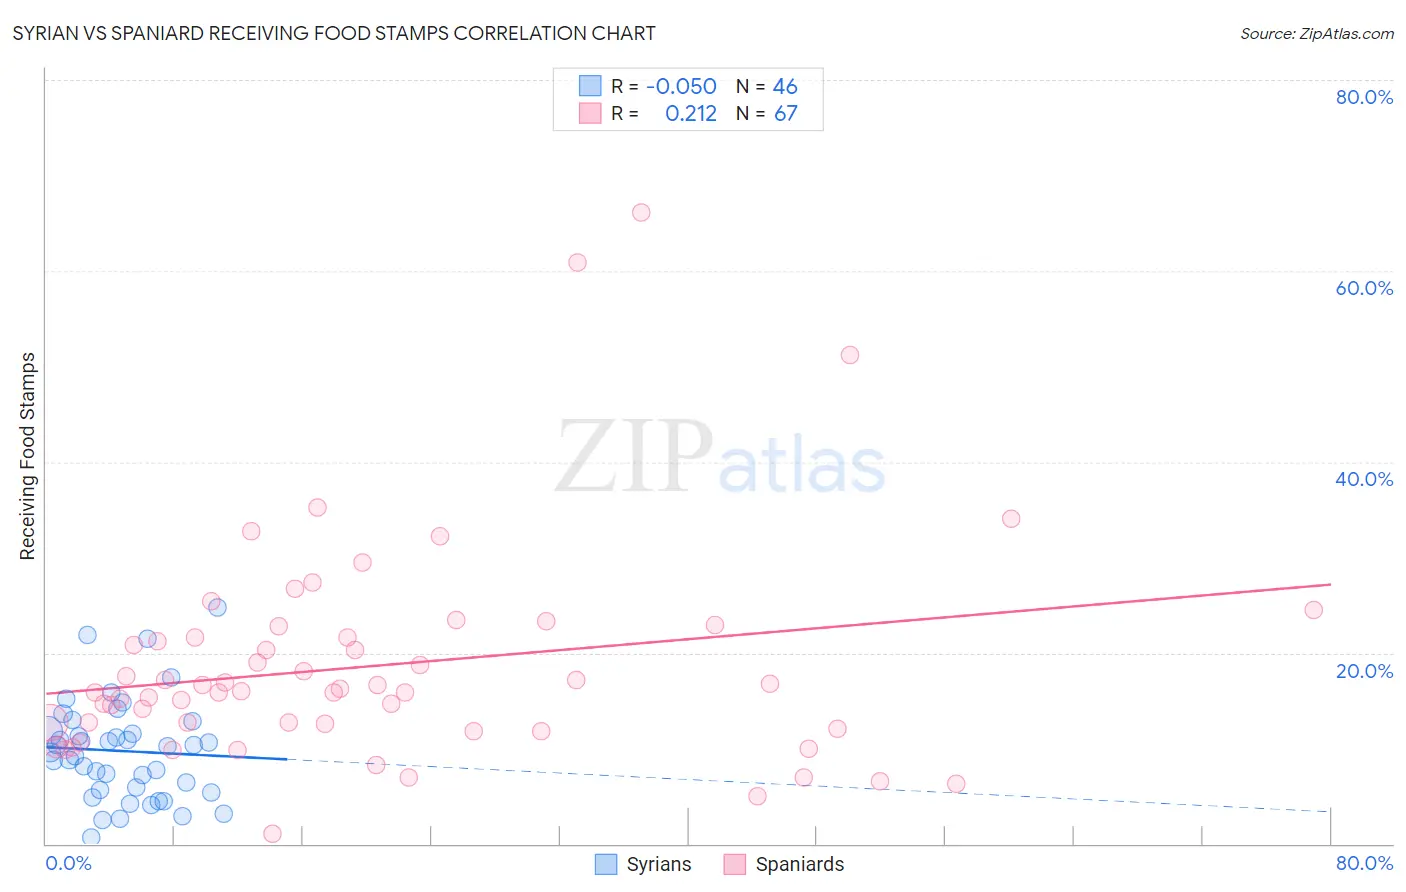
Syrian vs Spaniard Receiving Food Stamps Correlation Chart
The statistical analysis conducted on geographies consisting of 265,711,936 people shows a slight negative correlation between the proportion of Syrians and percentage of population receiving government assistance and/or food stamps in the United States with a correlation coefficient (R) of -0.050 and weighted average of 11.0%. Similarly, the statistical analysis conducted on geographies consisting of 442,043,399 people shows a weak positive correlation between the proportion of Spaniards and percentage of population receiving government assistance and/or food stamps in the United States with a correlation coefficient (R) of 0.212 and weighted average of 11.9%, a difference of 8.2%.
Receiving Food Stamps Correlation Summary
| Measurement | Syrian | Spaniard |
| Minimum | 0.68% | 1.0% |
| Maximum | 24.8% | 66.1% |
| Range | 24.1% | 65.1% |
| Mean | 9.7% | 18.6% |
| Median | 9.9% | 15.9% |
| Interquartile 25% (IQ1) | 5.6% | 12.0% |
| Interquartile 75% (IQ3) | 11.7% | 21.6% |
| Interquartile Range (IQR) | 6.1% | 9.6% |
| Standard Deviation (Sample) | 5.3% | 11.4% |
| Standard Deviation (Population) | 5.2% | 11.4% |
Similar Demographics by Receiving Food Stamps
Demographics Similar to Syrians by Receiving Food Stamps
In terms of receiving food stamps, the demographic groups most similar to Syrians are Hungarian (11.0%, a difference of 0.12%), Immigrants from Northern Africa (11.0%, a difference of 0.15%), Chilean (11.0%, a difference of 0.23%), Taiwanese (11.0%, a difference of 0.36%), and Immigrants from Vietnam (11.0%, a difference of 0.40%).
| Demographics | Rating | Rank | Receiving Food Stamps |
| Immigrants | Eastern Europe | 89.8 /100 | #137 | Excellent 10.8% |
| Immigrants | Moldova | 88.5 /100 | #138 | Excellent 10.9% |
| Hmong | 88.4 /100 | #139 | Excellent 10.9% |
| Celtics | 87.8 /100 | #140 | Excellent 10.9% |
| Immigrants | Vietnam | 86.7 /100 | #141 | Excellent 11.0% |
| Chileans | 86.2 /100 | #142 | Excellent 11.0% |
| Immigrants | Northern Africa | 86.0 /100 | #143 | Excellent 11.0% |
| Syrians | 85.5 /100 | #144 | Excellent 11.0% |
| Hungarians | 85.1 /100 | #145 | Excellent 11.0% |
| Taiwanese | 84.2 /100 | #146 | Excellent 11.0% |
| Whites/Caucasians | 83.9 /100 | #147 | Excellent 11.1% |
| Immigrants | South Eastern Asia | 83.3 /100 | #148 | Excellent 11.1% |
| Brazilians | 83.2 /100 | #149 | Excellent 11.1% |
| Soviet Union | 83.1 /100 | #150 | Excellent 11.1% |
| Immigrants | Spain | 81.7 /100 | #151 | Excellent 11.1% |
Demographics Similar to Spaniards by Receiving Food Stamps
In terms of receiving food stamps, the demographic groups most similar to Spaniards are Immigrants from Uganda (11.9%, a difference of 0.080%), Immigrants from Morocco (11.9%, a difference of 0.13%), South American Indian (11.9%, a difference of 0.28%), Immigrants from Iraq (12.0%, a difference of 0.38%), and Spanish (12.0%, a difference of 0.42%).
| Demographics | Rating | Rank | Receiving Food Stamps |
| Immigrants | Ukraine | 48.4 /100 | #177 | Average 11.8% |
| German Russians | 48.1 /100 | #178 | Average 11.8% |
| Immigrants | Kenya | 46.4 /100 | #179 | Average 11.8% |
| Uruguayans | 44.8 /100 | #180 | Average 11.8% |
| South American Indians | 41.7 /100 | #181 | Average 11.9% |
| Immigrants | Morocco | 40.7 /100 | #182 | Average 11.9% |
| Immigrants | Uganda | 40.3 /100 | #183 | Average 11.9% |
| Spaniards | 39.8 /100 | #184 | Fair 11.9% |
| Immigrants | Iraq | 37.1 /100 | #185 | Fair 12.0% |
| Spanish | 36.9 /100 | #186 | Fair 12.0% |
| Albanians | 35.4 /100 | #187 | Fair 12.0% |
| Sudanese | 33.4 /100 | #188 | Fair 12.0% |
| Immigrants | Cameroon | 32.5 /100 | #189 | Fair 12.0% |
| Immigrants | Peru | 32.2 /100 | #190 | Fair 12.0% |
| Venezuelans | 32.1 /100 | #191 | Fair 12.0% |