Syrian vs Immigrants from Laos Receiving Food Stamps
COMPARE
Syrian
Immigrants from Laos
Receiving Food Stamps
Receiving Food Stamps Comparison
Syrians
Immigrants from Laos
11.0%
RECEIVING FOOD STAMPS
85.5/ 100
METRIC RATING
144th/ 347
METRIC RANK
13.8%
RECEIVING FOOD STAMPS
0.7/ 100
METRIC RATING
248th/ 347
METRIC RANK
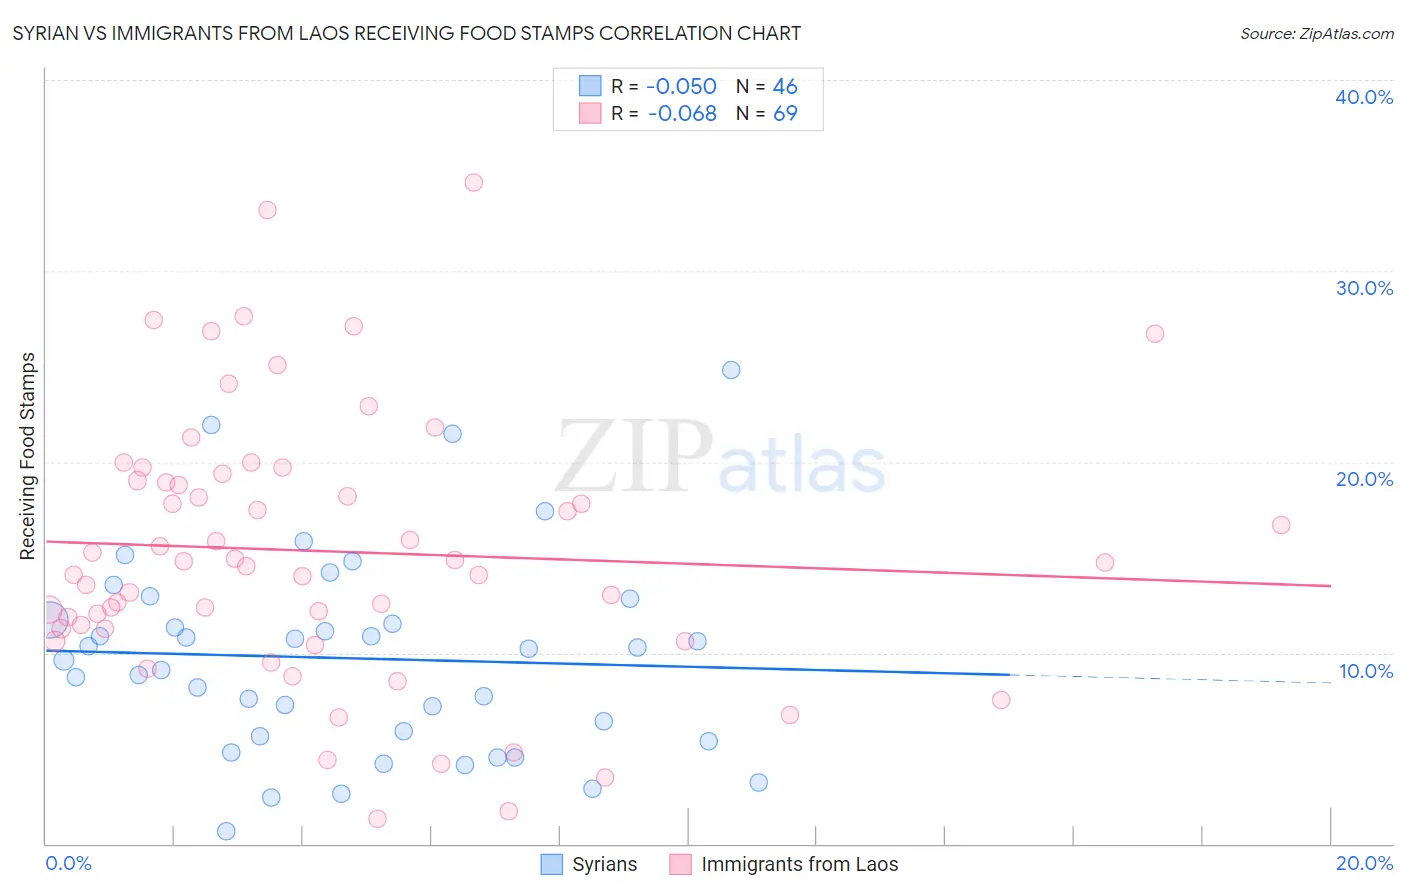
Syrian vs Immigrants from Laos Receiving Food Stamps Correlation Chart
The statistical analysis conducted on geographies consisting of 265,711,936 people shows a slight negative correlation between the proportion of Syrians and percentage of population receiving government assistance and/or food stamps in the United States with a correlation coefficient (R) of -0.050 and weighted average of 11.0%. Similarly, the statistical analysis conducted on geographies consisting of 201,380,139 people shows a slight negative correlation between the proportion of Immigrants from Laos and percentage of population receiving government assistance and/or food stamps in the United States with a correlation coefficient (R) of -0.068 and weighted average of 13.8%, a difference of 25.1%.
Receiving Food Stamps Correlation Summary
| Measurement | Syrian | Immigrants from Laos |
| Minimum | 0.68% | 1.3% |
| Maximum | 24.8% | 34.6% |
| Range | 24.1% | 33.3% |
| Mean | 9.7% | 15.3% |
| Median | 9.9% | 14.7% |
| Interquartile 25% (IQ1) | 5.6% | 11.3% |
| Interquartile 75% (IQ3) | 11.7% | 19.2% |
| Interquartile Range (IQR) | 6.1% | 8.0% |
| Standard Deviation (Sample) | 5.3% | 7.0% |
| Standard Deviation (Population) | 5.2% | 6.9% |
Similar Demographics by Receiving Food Stamps
Demographics Similar to Syrians by Receiving Food Stamps
In terms of receiving food stamps, the demographic groups most similar to Syrians are Hungarian (11.0%, a difference of 0.12%), Immigrants from Northern Africa (11.0%, a difference of 0.15%), Chilean (11.0%, a difference of 0.23%), Taiwanese (11.0%, a difference of 0.36%), and Immigrants from Vietnam (11.0%, a difference of 0.40%).
| Demographics | Rating | Rank | Receiving Food Stamps |
| Immigrants | Eastern Europe | 89.8 /100 | #137 | Excellent 10.8% |
| Immigrants | Moldova | 88.5 /100 | #138 | Excellent 10.9% |
| Hmong | 88.4 /100 | #139 | Excellent 10.9% |
| Celtics | 87.8 /100 | #140 | Excellent 10.9% |
| Immigrants | Vietnam | 86.7 /100 | #141 | Excellent 11.0% |
| Chileans | 86.2 /100 | #142 | Excellent 11.0% |
| Immigrants | Northern Africa | 86.0 /100 | #143 | Excellent 11.0% |
| Syrians | 85.5 /100 | #144 | Excellent 11.0% |
| Hungarians | 85.1 /100 | #145 | Excellent 11.0% |
| Taiwanese | 84.2 /100 | #146 | Excellent 11.0% |
| Whites/Caucasians | 83.9 /100 | #147 | Excellent 11.1% |
| Immigrants | South Eastern Asia | 83.3 /100 | #148 | Excellent 11.1% |
| Brazilians | 83.2 /100 | #149 | Excellent 11.1% |
| Soviet Union | 83.1 /100 | #150 | Excellent 11.1% |
| Immigrants | Spain | 81.7 /100 | #151 | Excellent 11.1% |
Demographics Similar to Immigrants from Laos by Receiving Food Stamps
In terms of receiving food stamps, the demographic groups most similar to Immigrants from Laos are Mexican American Indian (13.8%, a difference of 0.10%), Cree (13.7%, a difference of 0.36%), Immigrants from Somalia (13.7%, a difference of 0.60%), Indonesian (13.9%, a difference of 0.63%), and Cajun (13.7%, a difference of 0.65%).
| Demographics | Rating | Rank | Receiving Food Stamps |
| Choctaw | 1.0 /100 | #241 | Tragic 13.6% |
| Immigrants | Panama | 1.0 /100 | #242 | Tragic 13.6% |
| Somalis | 0.9 /100 | #243 | Tragic 13.7% |
| Cajuns | 0.9 /100 | #244 | Tragic 13.7% |
| Immigrants | Somalia | 0.9 /100 | #245 | Tragic 13.7% |
| Cree | 0.8 /100 | #246 | Tragic 13.7% |
| Mexican American Indians | 0.7 /100 | #247 | Tragic 13.8% |
| Immigrants | Laos | 0.7 /100 | #248 | Tragic 13.8% |
| Indonesians | 0.6 /100 | #249 | Tragic 13.9% |
| Immigrants | Cambodia | 0.5 /100 | #250 | Tragic 13.9% |
| Yaqui | 0.5 /100 | #251 | Tragic 13.9% |
| Ghanaians | 0.5 /100 | #252 | Tragic 14.0% |
| Spanish Americans | 0.4 /100 | #253 | Tragic 14.0% |
| Marshallese | 0.3 /100 | #254 | Tragic 14.1% |
| Sub-Saharan Africans | 0.3 /100 | #255 | Tragic 14.1% |