Syrian vs Dutch West Indian Receiving Food Stamps
COMPARE
Syrian
Dutch West Indian
Receiving Food Stamps
Receiving Food Stamps Comparison
Syrians
Dutch West Indians
11.0%
RECEIVING FOOD STAMPS
85.5/ 100
METRIC RATING
144th/ 347
METRIC RANK
14.3%
RECEIVING FOOD STAMPS
0.2/ 100
METRIC RATING
267th/ 347
METRIC RANK
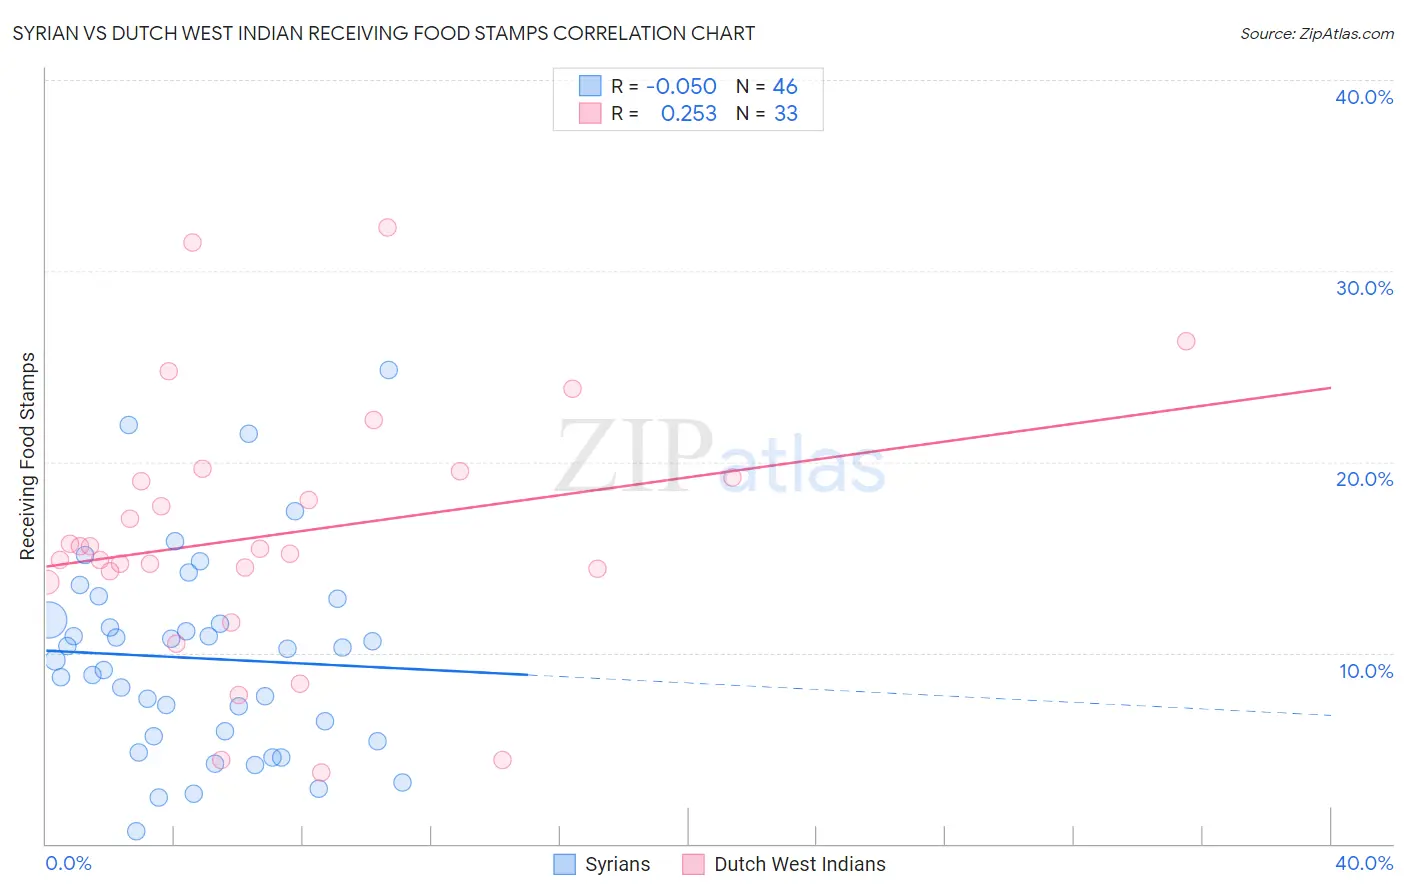
Syrian vs Dutch West Indian Receiving Food Stamps Correlation Chart
The statistical analysis conducted on geographies consisting of 265,711,936 people shows a slight negative correlation between the proportion of Syrians and percentage of population receiving government assistance and/or food stamps in the United States with a correlation coefficient (R) of -0.050 and weighted average of 11.0%. Similarly, the statistical analysis conducted on geographies consisting of 85,754,540 people shows a weak positive correlation between the proportion of Dutch West Indians and percentage of population receiving government assistance and/or food stamps in the United States with a correlation coefficient (R) of 0.253 and weighted average of 14.3%, a difference of 30.1%.
Receiving Food Stamps Correlation Summary
| Measurement | Syrian | Dutch West Indian |
| Minimum | 0.68% | 3.8% |
| Maximum | 24.8% | 32.3% |
| Range | 24.1% | 28.5% |
| Mean | 9.7% | 16.2% |
| Median | 9.9% | 15.5% |
| Interquartile 25% (IQ1) | 5.6% | 14.0% |
| Interquartile 75% (IQ3) | 11.7% | 19.4% |
| Interquartile Range (IQR) | 6.1% | 5.4% |
| Standard Deviation (Sample) | 5.3% | 6.7% |
| Standard Deviation (Population) | 5.2% | 6.6% |
Similar Demographics by Receiving Food Stamps
Demographics Similar to Syrians by Receiving Food Stamps
In terms of receiving food stamps, the demographic groups most similar to Syrians are Hungarian (11.0%, a difference of 0.12%), Immigrants from Northern Africa (11.0%, a difference of 0.15%), Chilean (11.0%, a difference of 0.23%), Taiwanese (11.0%, a difference of 0.36%), and Immigrants from Vietnam (11.0%, a difference of 0.40%).
| Demographics | Rating | Rank | Receiving Food Stamps |
| Immigrants | Eastern Europe | 89.8 /100 | #137 | Excellent 10.8% |
| Immigrants | Moldova | 88.5 /100 | #138 | Excellent 10.9% |
| Hmong | 88.4 /100 | #139 | Excellent 10.9% |
| Celtics | 87.8 /100 | #140 | Excellent 10.9% |
| Immigrants | Vietnam | 86.7 /100 | #141 | Excellent 11.0% |
| Chileans | 86.2 /100 | #142 | Excellent 11.0% |
| Immigrants | Northern Africa | 86.0 /100 | #143 | Excellent 11.0% |
| Syrians | 85.5 /100 | #144 | Excellent 11.0% |
| Hungarians | 85.1 /100 | #145 | Excellent 11.0% |
| Taiwanese | 84.2 /100 | #146 | Excellent 11.0% |
| Whites/Caucasians | 83.9 /100 | #147 | Excellent 11.1% |
| Immigrants | South Eastern Asia | 83.3 /100 | #148 | Excellent 11.1% |
| Brazilians | 83.2 /100 | #149 | Excellent 11.1% |
| Soviet Union | 83.1 /100 | #150 | Excellent 11.1% |
| Immigrants | Spain | 81.7 /100 | #151 | Excellent 11.1% |
Demographics Similar to Dutch West Indians by Receiving Food Stamps
In terms of receiving food stamps, the demographic groups most similar to Dutch West Indians are Cheyenne (14.3%, a difference of 0.22%), Blackfeet (14.3%, a difference of 0.30%), Immigrants from Uzbekistan (14.3%, a difference of 0.36%), Paiute (14.3%, a difference of 0.45%), and Immigrants from Portugal (14.3%, a difference of 0.45%).
| Demographics | Rating | Rank | Receiving Food Stamps |
| Central Americans | 0.3 /100 | #260 | Tragic 14.1% |
| Immigrants | Congo | 0.3 /100 | #261 | Tragic 14.1% |
| Paiute | 0.2 /100 | #262 | Tragic 14.3% |
| Immigrants | Portugal | 0.2 /100 | #263 | Tragic 14.3% |
| Immigrants | Uzbekistan | 0.2 /100 | #264 | Tragic 14.3% |
| Blackfeet | 0.2 /100 | #265 | Tragic 14.3% |
| Cheyenne | 0.2 /100 | #266 | Tragic 14.3% |
| Dutch West Indians | 0.2 /100 | #267 | Tragic 14.3% |
| Guatemalans | 0.1 /100 | #268 | Tragic 14.4% |
| Nepalese | 0.1 /100 | #269 | Tragic 14.6% |
| Mexicans | 0.1 /100 | #270 | Tragic 14.6% |
| Immigrants | Guatemala | 0.1 /100 | #271 | Tragic 14.6% |
| Chippewa | 0.1 /100 | #272 | Tragic 14.7% |
| Alaskan Athabascans | 0.1 /100 | #273 | Tragic 14.7% |
| Immigrants | Western Africa | 0.1 /100 | #274 | Tragic 14.7% |