Syrian vs Immigrants from Bahamas Receiving Food Stamps
COMPARE
Syrian
Immigrants from Bahamas
Receiving Food Stamps
Receiving Food Stamps Comparison
Syrians
Immigrants from Bahamas
11.0%
RECEIVING FOOD STAMPS
85.5/ 100
METRIC RATING
144th/ 347
METRIC RANK
15.8%
RECEIVING FOOD STAMPS
0.0/ 100
METRIC RATING
297th/ 347
METRIC RANK
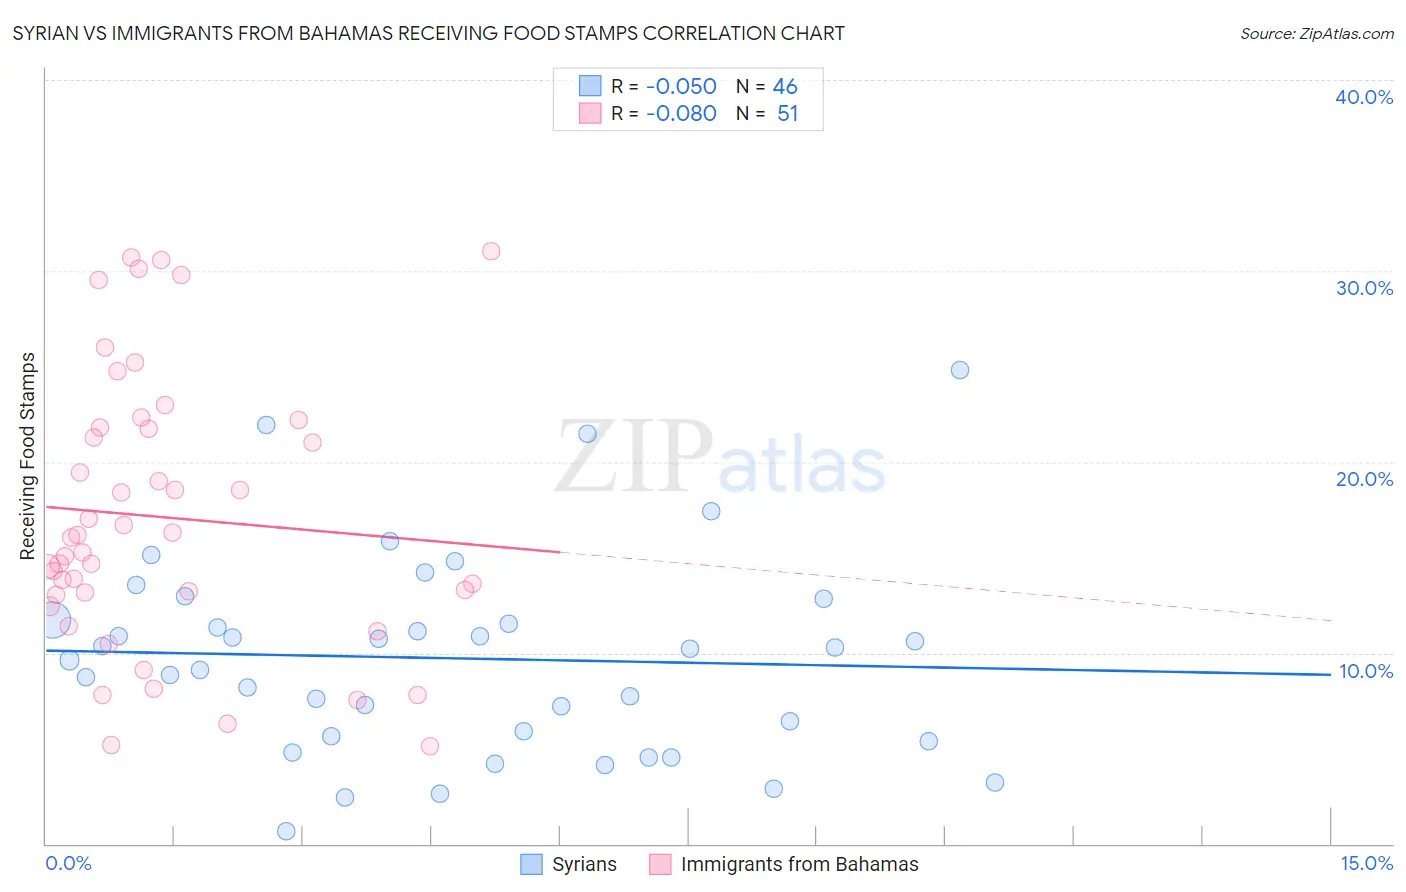
Syrian vs Immigrants from Bahamas Receiving Food Stamps Correlation Chart
The statistical analysis conducted on geographies consisting of 265,711,936 people shows a slight negative correlation between the proportion of Syrians and percentage of population receiving government assistance and/or food stamps in the United States with a correlation coefficient (R) of -0.050 and weighted average of 11.0%. Similarly, the statistical analysis conducted on geographies consisting of 104,572,016 people shows a slight negative correlation between the proportion of Immigrants from Bahamas and percentage of population receiving government assistance and/or food stamps in the United States with a correlation coefficient (R) of -0.080 and weighted average of 15.8%, a difference of 43.1%.
Receiving Food Stamps Correlation Summary
| Measurement | Syrian | Immigrants from Bahamas |
| Minimum | 0.68% | 5.1% |
| Maximum | 24.8% | 31.0% |
| Range | 24.1% | 25.9% |
| Mean | 9.7% | 17.1% |
| Median | 9.9% | 16.0% |
| Interquartile 25% (IQ1) | 5.6% | 13.1% |
| Interquartile 75% (IQ3) | 11.7% | 21.8% |
| Interquartile Range (IQR) | 6.1% | 8.7% |
| Standard Deviation (Sample) | 5.3% | 7.1% |
| Standard Deviation (Population) | 5.2% | 7.0% |
Similar Demographics by Receiving Food Stamps
Demographics Similar to Syrians by Receiving Food Stamps
In terms of receiving food stamps, the demographic groups most similar to Syrians are Hungarian (11.0%, a difference of 0.12%), Immigrants from Northern Africa (11.0%, a difference of 0.15%), Chilean (11.0%, a difference of 0.23%), Taiwanese (11.0%, a difference of 0.36%), and Immigrants from Vietnam (11.0%, a difference of 0.40%).
| Demographics | Rating | Rank | Receiving Food Stamps |
| Immigrants | Eastern Europe | 89.8 /100 | #137 | Excellent 10.8% |
| Immigrants | Moldova | 88.5 /100 | #138 | Excellent 10.9% |
| Hmong | 88.4 /100 | #139 | Excellent 10.9% |
| Celtics | 87.8 /100 | #140 | Excellent 10.9% |
| Immigrants | Vietnam | 86.7 /100 | #141 | Excellent 11.0% |
| Chileans | 86.2 /100 | #142 | Excellent 11.0% |
| Immigrants | Northern Africa | 86.0 /100 | #143 | Excellent 11.0% |
| Syrians | 85.5 /100 | #144 | Excellent 11.0% |
| Hungarians | 85.1 /100 | #145 | Excellent 11.0% |
| Taiwanese | 84.2 /100 | #146 | Excellent 11.0% |
| Whites/Caucasians | 83.9 /100 | #147 | Excellent 11.1% |
| Immigrants | South Eastern Asia | 83.3 /100 | #148 | Excellent 11.1% |
| Brazilians | 83.2 /100 | #149 | Excellent 11.1% |
| Soviet Union | 83.1 /100 | #150 | Excellent 11.1% |
| Immigrants | Spain | 81.7 /100 | #151 | Excellent 11.1% |
Demographics Similar to Immigrants from Bahamas by Receiving Food Stamps
In terms of receiving food stamps, the demographic groups most similar to Immigrants from Bahamas are Tsimshian (15.7%, a difference of 0.16%), Immigrants from Honduras (15.7%, a difference of 0.17%), Immigrants from Trinidad and Tobago (15.8%, a difference of 0.25%), Immigrants from Latin America (15.7%, a difference of 0.49%), and Hispanic or Latino (15.8%, a difference of 0.53%).
| Demographics | Rating | Rank | Receiving Food Stamps |
| Senegalese | 0.0 /100 | #290 | Tragic 15.4% |
| Hondurans | 0.0 /100 | #291 | Tragic 15.5% |
| Alaska Natives | 0.0 /100 | #292 | Tragic 15.6% |
| Vietnamese | 0.0 /100 | #293 | Tragic 15.7% |
| Immigrants | Latin America | 0.0 /100 | #294 | Tragic 15.7% |
| Immigrants | Honduras | 0.0 /100 | #295 | Tragic 15.7% |
| Tsimshian | 0.0 /100 | #296 | Tragic 15.7% |
| Immigrants | Bahamas | 0.0 /100 | #297 | Tragic 15.8% |
| Immigrants | Trinidad and Tobago | 0.0 /100 | #298 | Tragic 15.8% |
| Hispanics or Latinos | 0.0 /100 | #299 | Tragic 15.8% |
| Immigrants | Bangladesh | 0.0 /100 | #300 | Tragic 15.9% |
| Trinidadians and Tobagonians | 0.0 /100 | #301 | Tragic 16.0% |
| Immigrants | West Indies | 0.0 /100 | #302 | Tragic 16.1% |
| Nicaraguans | 0.0 /100 | #303 | Tragic 16.1% |
| West Indians | 0.0 /100 | #304 | Tragic 16.3% |