Immigrants from Honduras vs Bermudan Receiving Food Stamps
COMPARE
Immigrants from Honduras
Bermudan
Receiving Food Stamps
Receiving Food Stamps Comparison
Immigrants from Honduras
Bermudans
15.7%
RECEIVING FOOD STAMPS
0.0/ 100
METRIC RATING
295th/ 347
METRIC RANK
13.0%
RECEIVING FOOD STAMPS
4.8/ 100
METRIC RATING
221st/ 347
METRIC RANK
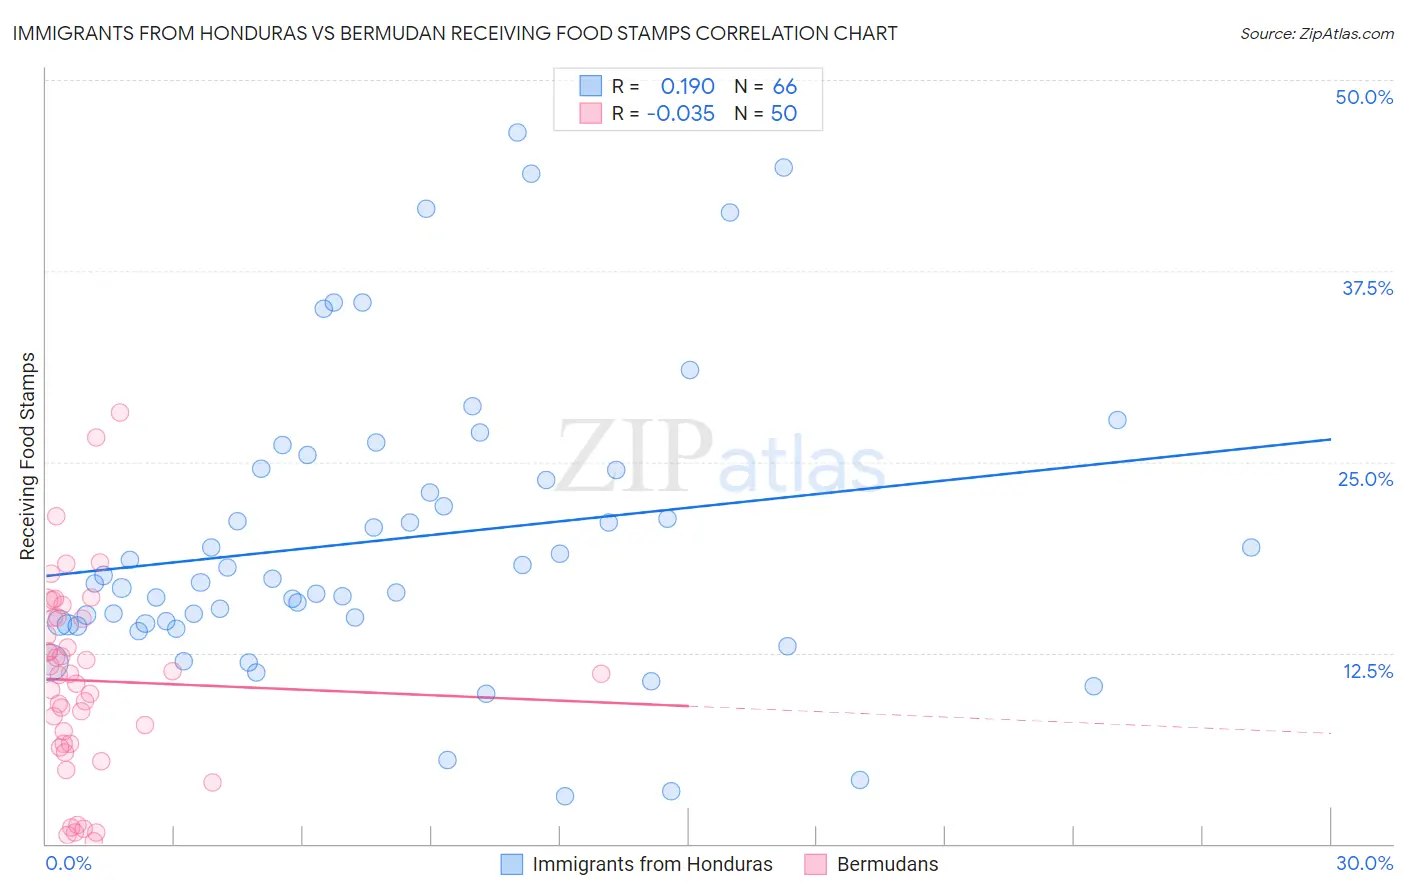
Immigrants from Honduras vs Bermudan Receiving Food Stamps Correlation Chart
The statistical analysis conducted on geographies consisting of 322,297,713 people shows a poor positive correlation between the proportion of Immigrants from Honduras and percentage of population receiving government assistance and/or food stamps in the United States with a correlation coefficient (R) of 0.190 and weighted average of 15.7%. Similarly, the statistical analysis conducted on geographies consisting of 55,651,694 people shows no correlation between the proportion of Bermudans and percentage of population receiving government assistance and/or food stamps in the United States with a correlation coefficient (R) of -0.035 and weighted average of 13.0%, a difference of 21.3%.
Receiving Food Stamps Correlation Summary
| Measurement | Immigrants from Honduras | Bermudan |
| Minimum | 3.1% | 0.20% |
| Maximum | 46.6% | 28.2% |
| Range | 43.5% | 28.0% |
| Mean | 19.9% | 10.7% |
| Median | 17.2% | 11.1% |
| Interquartile 25% (IQ1) | 14.4% | 6.6% |
| Interquartile 75% (IQ3) | 24.5% | 14.8% |
| Interquartile Range (IQR) | 10.1% | 8.2% |
| Standard Deviation (Sample) | 9.7% | 6.3% |
| Standard Deviation (Population) | 9.6% | 6.3% |
Similar Demographics by Receiving Food Stamps
Demographics Similar to Immigrants from Honduras by Receiving Food Stamps
In terms of receiving food stamps, the demographic groups most similar to Immigrants from Honduras are Tsimshian (15.7%, a difference of 0.010%), Immigrants from Bahamas (15.8%, a difference of 0.17%), Immigrants from Latin America (15.7%, a difference of 0.32%), Immigrants from Trinidad and Tobago (15.8%, a difference of 0.42%), and Vietnamese (15.7%, a difference of 0.43%).
| Demographics | Rating | Rank | Receiving Food Stamps |
| Immigrants | Belize | 0.0 /100 | #288 | Tragic 15.2% |
| Immigrants | Senegal | 0.0 /100 | #289 | Tragic 15.3% |
| Senegalese | 0.0 /100 | #290 | Tragic 15.4% |
| Hondurans | 0.0 /100 | #291 | Tragic 15.5% |
| Alaska Natives | 0.0 /100 | #292 | Tragic 15.6% |
| Vietnamese | 0.0 /100 | #293 | Tragic 15.7% |
| Immigrants | Latin America | 0.0 /100 | #294 | Tragic 15.7% |
| Immigrants | Honduras | 0.0 /100 | #295 | Tragic 15.7% |
| Tsimshian | 0.0 /100 | #296 | Tragic 15.7% |
| Immigrants | Bahamas | 0.0 /100 | #297 | Tragic 15.8% |
| Immigrants | Trinidad and Tobago | 0.0 /100 | #298 | Tragic 15.8% |
| Hispanics or Latinos | 0.0 /100 | #299 | Tragic 15.8% |
| Immigrants | Bangladesh | 0.0 /100 | #300 | Tragic 15.9% |
| Trinidadians and Tobagonians | 0.0 /100 | #301 | Tragic 16.0% |
| Immigrants | West Indies | 0.0 /100 | #302 | Tragic 16.1% |
Demographics Similar to Bermudans by Receiving Food Stamps
In terms of receiving food stamps, the demographic groups most similar to Bermudans are Immigrants (13.0%, a difference of 0.26%), Immigrants from Albania (13.0%, a difference of 0.30%), Immigrants from Colombia (12.9%, a difference of 0.32%), Immigrants from Middle Africa (12.9%, a difference of 0.36%), and Hawaiian (12.9%, a difference of 0.37%).
| Demographics | Rating | Rank | Receiving Food Stamps |
| Immigrants | Africa | 7.6 /100 | #214 | Tragic 12.8% |
| Native Hawaiians | 6.7 /100 | #215 | Tragic 12.8% |
| Immigrants | South America | 6.5 /100 | #216 | Tragic 12.8% |
| Immigrants | Burma/Myanmar | 6.0 /100 | #217 | Tragic 12.9% |
| Hawaiians | 5.4 /100 | #218 | Tragic 12.9% |
| Immigrants | Middle Africa | 5.4 /100 | #219 | Tragic 12.9% |
| Immigrants | Colombia | 5.3 /100 | #220 | Tragic 12.9% |
| Bermudans | 4.8 /100 | #221 | Tragic 13.0% |
| Immigrants | Immigrants | 4.4 /100 | #222 | Tragic 13.0% |
| Immigrants | Albania | 4.4 /100 | #223 | Tragic 13.0% |
| Immigrants | Armenia | 4.3 /100 | #224 | Tragic 13.0% |
| Fijians | 4.3 /100 | #225 | Tragic 13.0% |
| Chickasaw | 3.6 /100 | #226 | Tragic 13.1% |
| Nigerians | 3.5 /100 | #227 | Tragic 13.1% |
| Panamanians | 3.5 /100 | #228 | Tragic 13.1% |