Assyrian/Chaldean/Syriac vs Bermudan Receiving Food Stamps
COMPARE
Assyrian/Chaldean/Syriac
Bermudan
Receiving Food Stamps
Receiving Food Stamps Comparison
Assyrians/Chaldeans/Syriacs
Bermudans
10.6%
RECEIVING FOOD STAMPS
94.1/ 100
METRIC RATING
118th/ 347
METRIC RANK
13.0%
RECEIVING FOOD STAMPS
4.8/ 100
METRIC RATING
221st/ 347
METRIC RANK
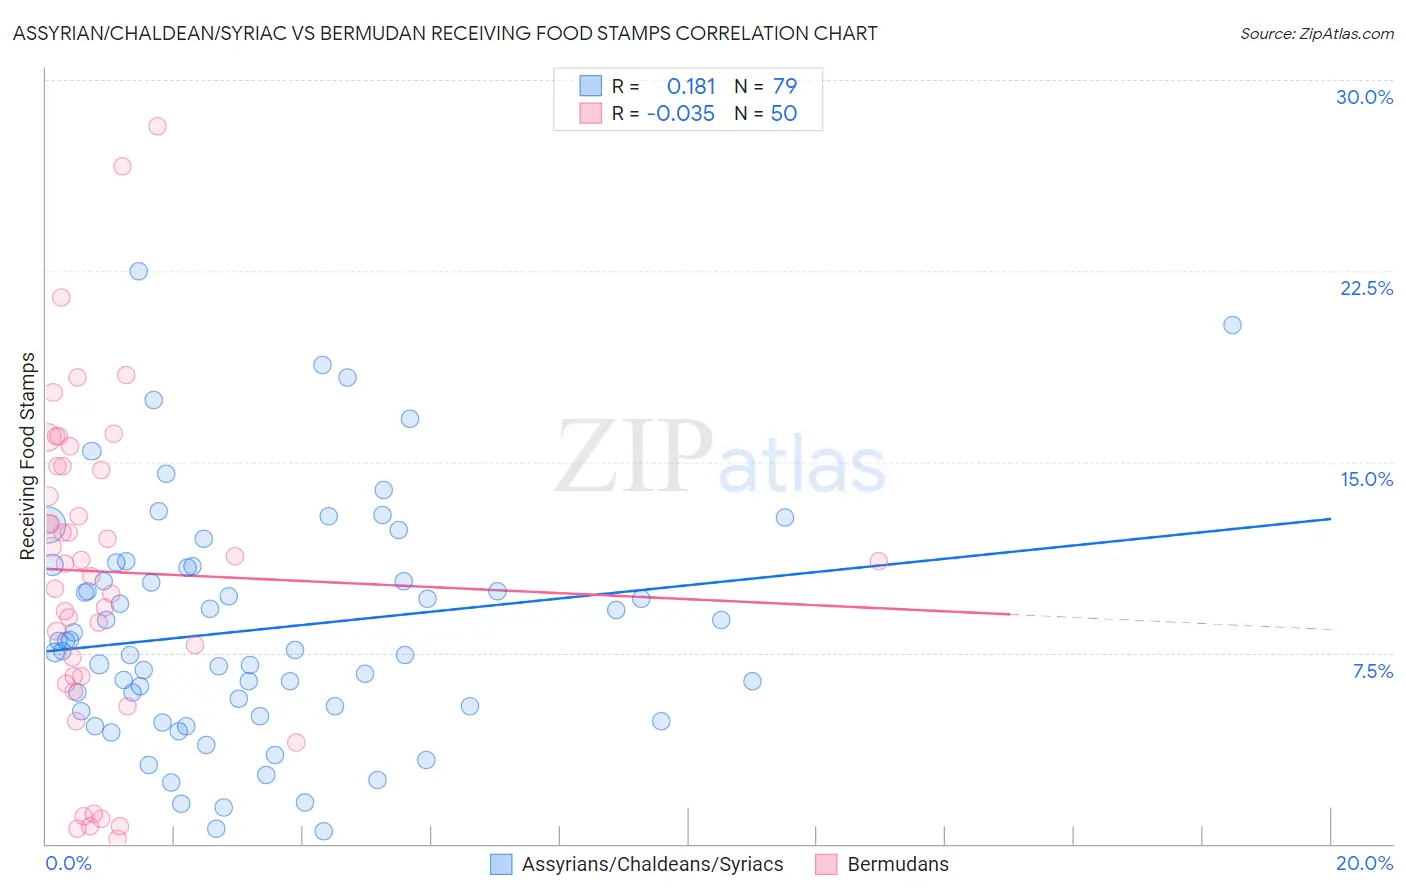
Assyrian/Chaldean/Syriac vs Bermudan Receiving Food Stamps Correlation Chart
The statistical analysis conducted on geographies consisting of 110,240,637 people shows a poor positive correlation between the proportion of Assyrians/Chaldeans/Syriacs and percentage of population receiving government assistance and/or food stamps in the United States with a correlation coefficient (R) of 0.181 and weighted average of 10.6%. Similarly, the statistical analysis conducted on geographies consisting of 55,651,694 people shows no correlation between the proportion of Bermudans and percentage of population receiving government assistance and/or food stamps in the United States with a correlation coefficient (R) of -0.035 and weighted average of 13.0%, a difference of 22.3%.
Receiving Food Stamps Correlation Summary
| Measurement | Assyrian/Chaldean/Syriac | Bermudan |
| Minimum | 0.50% | 0.20% |
| Maximum | 22.5% | 28.2% |
| Range | 22.0% | 28.0% |
| Mean | 8.4% | 10.7% |
| Median | 7.6% | 11.1% |
| Interquartile 25% (IQ1) | 5.2% | 6.6% |
| Interquartile 75% (IQ3) | 10.9% | 14.8% |
| Interquartile Range (IQR) | 5.7% | 8.2% |
| Standard Deviation (Sample) | 4.6% | 6.3% |
| Standard Deviation (Population) | 4.6% | 6.3% |
Similar Demographics by Receiving Food Stamps
Demographics Similar to Assyrians/Chaldeans/Syriacs by Receiving Food Stamps
In terms of receiving food stamps, the demographic groups most similar to Assyrians/Chaldeans/Syriacs are Immigrants from Poland (10.6%, a difference of 0.16%), Ethiopian (10.6%, a difference of 0.17%), Slavic (10.6%, a difference of 0.20%), Sri Lankan (10.6%, a difference of 0.27%), and Immigrants from Nepal (10.6%, a difference of 0.34%).
| Demographics | Rating | Rank | Receiving Food Stamps |
| Romanians | 95.8 /100 | #111 | Exceptional 10.4% |
| Mongolians | 95.8 /100 | #112 | Exceptional 10.5% |
| Icelanders | 95.4 /100 | #113 | Exceptional 10.5% |
| Scotch-Irish | 95.1 /100 | #114 | Exceptional 10.5% |
| Immigrants | Saudi Arabia | 94.9 /100 | #115 | Exceptional 10.5% |
| Canadians | 94.8 /100 | #116 | Exceptional 10.5% |
| Immigrants | Nepal | 94.6 /100 | #117 | Exceptional 10.6% |
| Assyrians/Chaldeans/Syriacs | 94.1 /100 | #118 | Exceptional 10.6% |
| Immigrants | Poland | 93.9 /100 | #119 | Exceptional 10.6% |
| Ethiopians | 93.9 /100 | #120 | Exceptional 10.6% |
| Slavs | 93.8 /100 | #121 | Exceptional 10.6% |
| Sri Lankans | 93.7 /100 | #122 | Exceptional 10.6% |
| Immigrants | Philippines | 93.3 /100 | #123 | Exceptional 10.7% |
| Paraguayans | 93.0 /100 | #124 | Exceptional 10.7% |
| Ukrainians | 92.8 /100 | #125 | Exceptional 10.7% |
Demographics Similar to Bermudans by Receiving Food Stamps
In terms of receiving food stamps, the demographic groups most similar to Bermudans are Immigrants (13.0%, a difference of 0.26%), Immigrants from Albania (13.0%, a difference of 0.30%), Immigrants from Colombia (12.9%, a difference of 0.32%), Immigrants from Middle Africa (12.9%, a difference of 0.36%), and Hawaiian (12.9%, a difference of 0.37%).
| Demographics | Rating | Rank | Receiving Food Stamps |
| Immigrants | Africa | 7.6 /100 | #214 | Tragic 12.8% |
| Native Hawaiians | 6.7 /100 | #215 | Tragic 12.8% |
| Immigrants | South America | 6.5 /100 | #216 | Tragic 12.8% |
| Immigrants | Burma/Myanmar | 6.0 /100 | #217 | Tragic 12.9% |
| Hawaiians | 5.4 /100 | #218 | Tragic 12.9% |
| Immigrants | Middle Africa | 5.4 /100 | #219 | Tragic 12.9% |
| Immigrants | Colombia | 5.3 /100 | #220 | Tragic 12.9% |
| Bermudans | 4.8 /100 | #221 | Tragic 13.0% |
| Immigrants | Immigrants | 4.4 /100 | #222 | Tragic 13.0% |
| Immigrants | Albania | 4.4 /100 | #223 | Tragic 13.0% |
| Immigrants | Armenia | 4.3 /100 | #224 | Tragic 13.0% |
| Fijians | 4.3 /100 | #225 | Tragic 13.0% |
| Chickasaw | 3.6 /100 | #226 | Tragic 13.1% |
| Nigerians | 3.5 /100 | #227 | Tragic 13.1% |
| Panamanians | 3.5 /100 | #228 | Tragic 13.1% |