Spaniard vs Scottish Married-Couple Family Poverty
COMPARE
Spaniard
Scottish
Married-Couple Family Poverty
Married-Couple Family Poverty Comparison
Spaniards
Scottish
5.4%
MARRIED-COUPLE FAMILY POVERTY
27.4/ 100
METRIC RATING
196th/ 347
METRIC RANK
4.3%
MARRIED-COUPLE FAMILY POVERTY
99.8/ 100
METRIC RATING
42nd/ 347
METRIC RANK
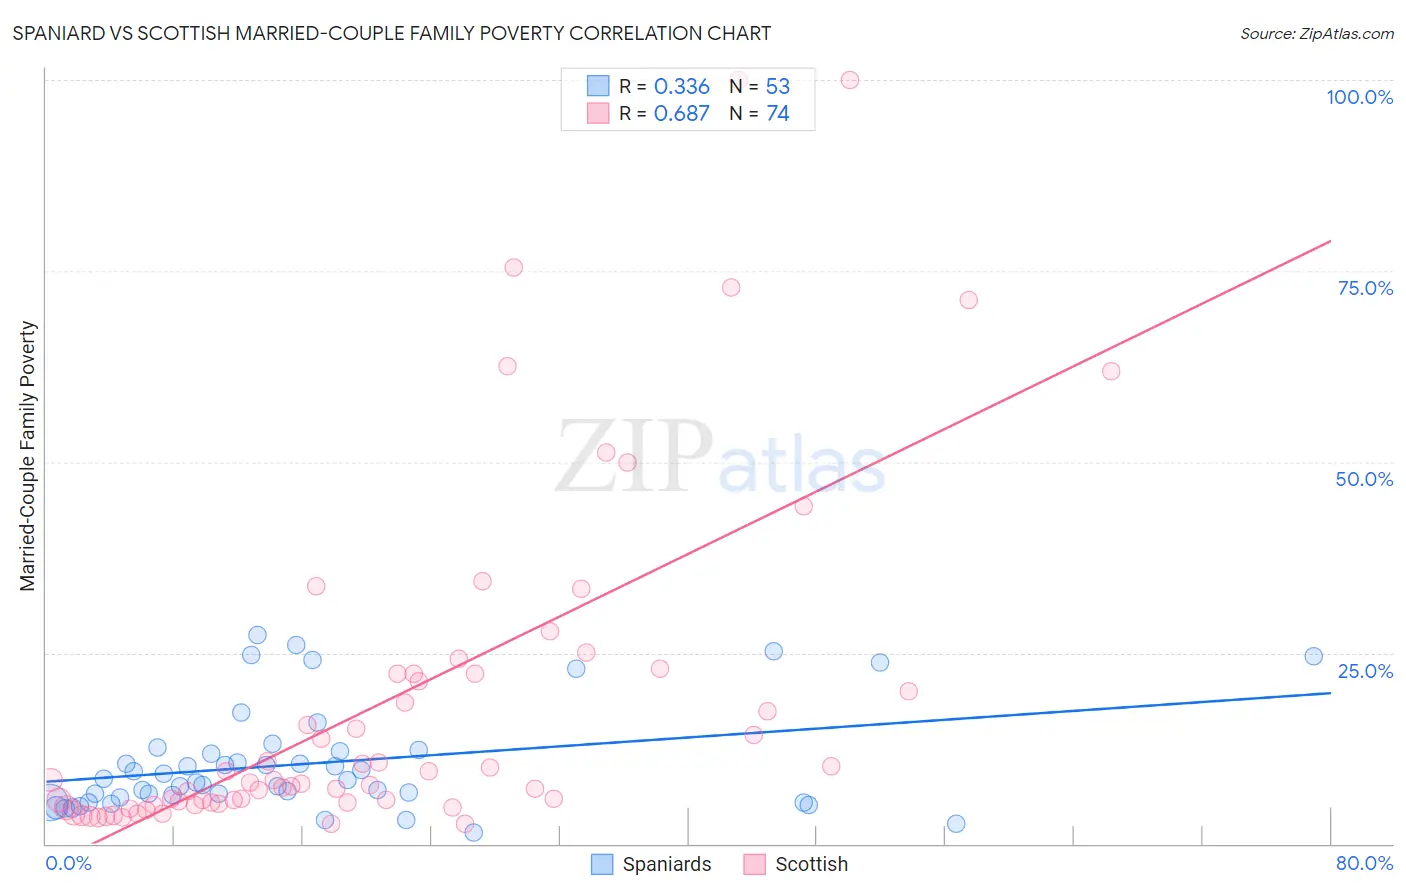
Spaniard vs Scottish Married-Couple Family Poverty Correlation Chart
The statistical analysis conducted on geographies consisting of 439,020,295 people shows a mild positive correlation between the proportion of Spaniards and poverty level among married-couple families in the United States with a correlation coefficient (R) of 0.336 and weighted average of 5.4%. Similarly, the statistical analysis conducted on geographies consisting of 552,662,179 people shows a significant positive correlation between the proportion of Scottish and poverty level among married-couple families in the United States with a correlation coefficient (R) of 0.687 and weighted average of 4.3%, a difference of 25.8%.
Married-Couple Family Poverty Correlation Summary
| Measurement | Spaniard | Scottish |
| Minimum | 1.5% | 2.6% |
| Maximum | 27.3% | 100.0% |
| Range | 25.8% | 97.4% |
| Mean | 10.5% | 18.6% |
| Median | 8.3% | 8.2% |
| Interquartile 25% (IQ1) | 5.7% | 5.4% |
| Interquartile 75% (IQ3) | 12.2% | 22.2% |
| Interquartile Range (IQR) | 6.5% | 16.8% |
| Standard Deviation (Sample) | 6.9% | 22.5% |
| Standard Deviation (Population) | 6.8% | 22.4% |
Similar Demographics by Married-Couple Family Poverty
Demographics Similar to Spaniards by Married-Couple Family Poverty
In terms of married-couple family poverty, the demographic groups most similar to Spaniards are Immigrants from the Azores (5.4%, a difference of 0.020%), Immigrants from Israel (5.4%, a difference of 0.060%), Liberian (5.4%, a difference of 0.15%), Immigrants from Belarus (5.4%, a difference of 0.18%), and Malaysian (5.4%, a difference of 0.29%).
| Demographics | Rating | Rank | Married-Couple Family Poverty |
| South American Indians | 32.5 /100 | #189 | Fair 5.3% |
| Ugandans | 31.6 /100 | #190 | Fair 5.3% |
| Immigrants | Cabo Verde | 30.9 /100 | #191 | Fair 5.3% |
| Cape Verdeans | 30.7 /100 | #192 | Fair 5.3% |
| Malaysians | 29.5 /100 | #193 | Fair 5.4% |
| Immigrants | Israel | 27.8 /100 | #194 | Fair 5.4% |
| Immigrants | Azores | 27.5 /100 | #195 | Fair 5.4% |
| Spaniards | 27.4 /100 | #196 | Fair 5.4% |
| Liberians | 26.3 /100 | #197 | Fair 5.4% |
| Immigrants | Belarus | 26.2 /100 | #198 | Fair 5.4% |
| Uruguayans | 25.0 /100 | #199 | Fair 5.4% |
| Immigrants | Morocco | 24.3 /100 | #200 | Fair 5.4% |
| Lebanese | 24.1 /100 | #201 | Fair 5.4% |
| Immigrants | Middle Africa | 23.8 /100 | #202 | Fair 5.4% |
| Immigrants | Peru | 21.8 /100 | #203 | Fair 5.4% |
Demographics Similar to Scottish by Married-Couple Family Poverty
In terms of married-couple family poverty, the demographic groups most similar to Scottish are Northern European (4.3%, a difference of 0.16%), French Canadian (4.2%, a difference of 0.41%), Swiss (4.3%, a difference of 0.44%), Immigrants from Northern Europe (4.2%, a difference of 0.70%), and Immigrants from Japan (4.3%, a difference of 0.81%).
| Demographics | Rating | Rank | Married-Couple Family Poverty |
| Europeans | 99.9 /100 | #35 | Exceptional 4.2% |
| English | 99.9 /100 | #36 | Exceptional 4.2% |
| Iranians | 99.9 /100 | #37 | Exceptional 4.2% |
| Belgians | 99.9 /100 | #38 | Exceptional 4.2% |
| Immigrants | Northern Europe | 99.8 /100 | #39 | Exceptional 4.2% |
| French Canadians | 99.8 /100 | #40 | Exceptional 4.2% |
| Northern Europeans | 99.8 /100 | #41 | Exceptional 4.3% |
| Scottish | 99.8 /100 | #42 | Exceptional 4.3% |
| Swiss | 99.8 /100 | #43 | Exceptional 4.3% |
| Immigrants | Japan | 99.8 /100 | #44 | Exceptional 4.3% |
| Serbians | 99.8 /100 | #45 | Exceptional 4.3% |
| British | 99.8 /100 | #46 | Exceptional 4.3% |
| Immigrants | South Central Asia | 99.8 /100 | #47 | Exceptional 4.3% |
| Australians | 99.7 /100 | #48 | Exceptional 4.3% |
| Turks | 99.7 /100 | #49 | Exceptional 4.3% |