Spaniard vs Immigrants from Eastern Africa Married-Couple Family Poverty
COMPARE
Spaniard
Immigrants from Eastern Africa
Married-Couple Family Poverty
Married-Couple Family Poverty Comparison
Spaniards
Immigrants from Eastern Africa
5.4%
MARRIED-COUPLE FAMILY POVERTY
27.4/ 100
METRIC RATING
196th/ 347
METRIC RANK
5.2%
MARRIED-COUPLE FAMILY POVERTY
50.0/ 100
METRIC RATING
174th/ 347
METRIC RANK
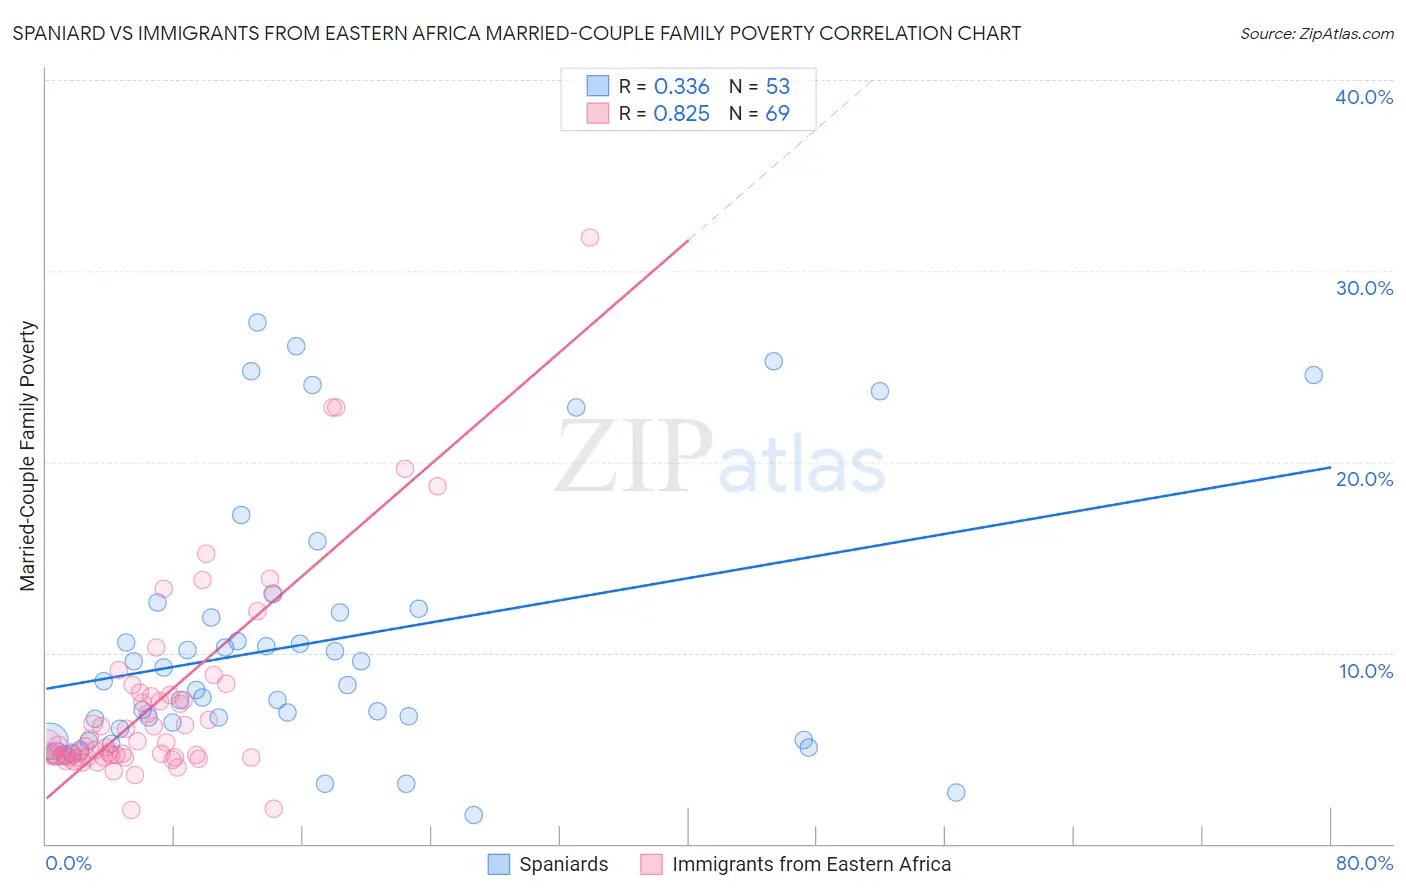
Spaniard vs Immigrants from Eastern Africa Married-Couple Family Poverty Correlation Chart
The statistical analysis conducted on geographies consisting of 439,020,295 people shows a mild positive correlation between the proportion of Spaniards and poverty level among married-couple families in the United States with a correlation coefficient (R) of 0.336 and weighted average of 5.4%. Similarly, the statistical analysis conducted on geographies consisting of 352,572,169 people shows a very strong positive correlation between the proportion of Immigrants from Eastern Africa and poverty level among married-couple families in the United States with a correlation coefficient (R) of 0.825 and weighted average of 5.2%, a difference of 2.8%.
Married-Couple Family Poverty Correlation Summary
| Measurement | Spaniard | Immigrants from Eastern Africa |
| Minimum | 1.5% | 1.7% |
| Maximum | 27.3% | 31.7% |
| Range | 25.8% | 30.0% |
| Mean | 10.5% | 7.5% |
| Median | 8.3% | 5.2% |
| Interquartile 25% (IQ1) | 5.7% | 4.5% |
| Interquartile 75% (IQ3) | 12.2% | 7.8% |
| Interquartile Range (IQR) | 6.5% | 3.3% |
| Standard Deviation (Sample) | 6.9% | 5.4% |
| Standard Deviation (Population) | 6.8% | 5.3% |
Similar Demographics by Married-Couple Family Poverty
Demographics Similar to Spaniards by Married-Couple Family Poverty
In terms of married-couple family poverty, the demographic groups most similar to Spaniards are Immigrants from the Azores (5.4%, a difference of 0.020%), Immigrants from Israel (5.4%, a difference of 0.060%), Liberian (5.4%, a difference of 0.15%), Immigrants from Belarus (5.4%, a difference of 0.18%), and Malaysian (5.4%, a difference of 0.29%).
| Demographics | Rating | Rank | Married-Couple Family Poverty |
| South American Indians | 32.5 /100 | #189 | Fair 5.3% |
| Ugandans | 31.6 /100 | #190 | Fair 5.3% |
| Immigrants | Cabo Verde | 30.9 /100 | #191 | Fair 5.3% |
| Cape Verdeans | 30.7 /100 | #192 | Fair 5.3% |
| Malaysians | 29.5 /100 | #193 | Fair 5.4% |
| Immigrants | Israel | 27.8 /100 | #194 | Fair 5.4% |
| Immigrants | Azores | 27.5 /100 | #195 | Fair 5.4% |
| Spaniards | 27.4 /100 | #196 | Fair 5.4% |
| Liberians | 26.3 /100 | #197 | Fair 5.4% |
| Immigrants | Belarus | 26.2 /100 | #198 | Fair 5.4% |
| Uruguayans | 25.0 /100 | #199 | Fair 5.4% |
| Immigrants | Morocco | 24.3 /100 | #200 | Fair 5.4% |
| Lebanese | 24.1 /100 | #201 | Fair 5.4% |
| Immigrants | Middle Africa | 23.8 /100 | #202 | Fair 5.4% |
| Immigrants | Peru | 21.8 /100 | #203 | Fair 5.4% |
Demographics Similar to Immigrants from Eastern Africa by Married-Couple Family Poverty
In terms of married-couple family poverty, the demographic groups most similar to Immigrants from Eastern Africa are Alsatian (5.2%, a difference of 0.14%), Immigrants from Northern Africa (5.2%, a difference of 0.16%), Marshallese (5.2%, a difference of 0.24%), Menominee (5.2%, a difference of 0.25%), and Bermudan (5.2%, a difference of 0.33%).
| Demographics | Rating | Rank | Married-Couple Family Poverty |
| Costa Ricans | 61.5 /100 | #167 | Good 5.1% |
| Immigrants | Uganda | 54.9 /100 | #168 | Average 5.2% |
| Ottawa | 54.5 /100 | #169 | Average 5.2% |
| Immigrants | Argentina | 54.4 /100 | #170 | Average 5.2% |
| Bermudans | 52.9 /100 | #171 | Average 5.2% |
| Immigrants | Northern Africa | 51.3 /100 | #172 | Average 5.2% |
| Alsatians | 51.2 /100 | #173 | Average 5.2% |
| Immigrants | Eastern Africa | 50.0 /100 | #174 | Average 5.2% |
| Marshallese | 47.9 /100 | #175 | Average 5.2% |
| Menominee | 47.8 /100 | #176 | Average 5.2% |
| Immigrants | Kazakhstan | 45.1 /100 | #177 | Average 5.2% |
| Immigrants | Ukraine | 44.9 /100 | #178 | Average 5.2% |
| Spanish | 41.4 /100 | #179 | Average 5.3% |
| Immigrants | Sierra Leone | 39.3 /100 | #180 | Fair 5.3% |
| Immigrants | Chile | 38.8 /100 | #181 | Fair 5.3% |