Nonimmigrants vs Celtic Married-Couple Family Poverty

COMPARE

Nonimmigrants
Race
Ancestry
AfghanAfricanAlaska NativeAlaskan AthabascanAlbanianAleutAlsatianAmericanApacheArabArapahoArgentineanArmenianAssyrian/Chaldean/SyriacAustralianAustrianBahamianBangladeshiBarbadianBasqueBelgianBelizeanBermudanBhutaneseBlackfeetBolivianBrazilianBritishBritish West IndianBulgarianBurmeseCajunCambodianCanadianCape VerdeanCarpatho RusynCentral AmericanCentral American IndianCherokeeCheyenneChickasawChileanChineseChippewaChoctawColombianColvilleComancheCosta RicanCreeCreekCroatianCrowCubanCypriotCzechCzechoslovakianDanishDelawareDominicanDutchDutch West IndianEastern EuropeanEcuadorianEgyptianEnglishEstonianEthiopianEuropeanFijianFilipinoFinnishFrenchFrench American IndianFrench CanadianGermanGerman RussianGhanaianGreekGuamanian/ChamorroGuatemalanGuyaneseHaitianHmongHonduranHopiHoumaHungarianIcelanderIndian (Asian)IndonesianInupiatIranianIraqiIrishIroquoisIsraeliItalianJamaicanJapaneseJordanianKenyanKiowaKoreanLaotianLatvianLebaneseLiberianLithuanianLumbeeLuxembourgerMacedonianMalaysianMalteseMarshalleseMenomineeMexicanMexican American IndianMongolianMoroccanNative HawaiianNavajoNepaleseNew ZealanderNicaraguanNigerianNorthern EuropeanNorwegianOkinawanOsageOttawaPaiutePakistaniPalestinianPanamanianParaguayanPennsylvania GermanPeruvianPimaPolishPortuguesePotawatomiPuebloPuerto RicanPuget Sound SalishRomanianRussianSalvadoranSamoanScandinavianScotch-IrishScottishSeminoleSenegaleseSerbianShoshoneSierra LeoneanSiouxSlavicSlovakSloveneSomaliSouth AfricanSouth AmericanSouth American IndianSoviet UnionSpaniardSpanishSpanish AmericanSpanish American IndianSri LankanSubsaharan AfricanSudaneseSwedishSwissSyrianTaiwaneseThaiTlingit-HaidaTohono O'OdhamTonganTrinidadian and TobagonianTsimshianTurkishU.S. Virgin IslanderUgandanUkrainianUruguayanUteVenezuelanVietnameseWelshWest IndianYakamaYaquiYugoslavianYumanYup'ikZimbabwean
Immigration
NonimmigrantsImmigrantsAfghanistanAfricaAlbaniaArgentinaArmeniaAsiaAustraliaAustriaBahamasBangladeshBarbadosBelarusBelgiumBelizeBoliviaBosnia and HerzegovinaBrazilBulgariaBurma/MyanmarCabo VerdeCambodiaCameroonCanadaCaribbeanCentral AmericaChileChinaColombiaCongoCosta RicaCroatiaCubaCzechoslovakiaDenmarkDominicaDominican RepublicEastern AfricaEastern AsiaEastern EuropeEcuadorEgyptEl SalvadorEnglandEritreaEthiopiaEuropeFijiFranceGermanyGhanaGreeceGrenadaGuatemalaGuyanaHaitiHondurasHong KongHungaryIndiaIndonesiaIranIraqIrelandIsraelItalyJamaicaJapanJordanKazakhstanKenyaKoreaKuwaitLaosLatin AmericaLatviaLebanonLiberiaLithuaniaMalaysiaMexicoMicronesiaMiddle AfricaMoldovaMoroccoNepalNetherlandsNicaraguaNigeriaNorth AmericaNorth MacedoniaNorthern AfricaNorthern EuropeNorwayOceaniaPakistanPanamaPeruPhilippinesPolandPortugalRomaniaRussiaSaudi ArabiaScotlandSenegalSerbiaSierra LeoneSingaporeSomaliaSouth AfricaSouth AmericaSouth Central AsiaSouth Eastern AsiaSouthern EuropeSpainSri LankaSt. Vincent and the GrenadinesSudanSwedenSwitzerlandSyriaTaiwanThailandTrinidad and TobagoTurkeyUgandaUkraineUruguayUzbekistanVenezuelaVietnamWest IndiesWestern AfricaWestern AsiaWestern EuropeYemenZaireZimbabweAzores
Celtic
Race
Ancestry
AfghanAfricanAlaska NativeAlaskan AthabascanAlbanianAleutAlsatianAmericanApacheArabArapahoArgentineanArmenianAssyrian/Chaldean/SyriacAustralianAustrianBahamianBangladeshiBarbadianBasqueBelgianBelizeanBermudanBhutaneseBlackfeetBolivianBrazilianBritishBritish West IndianBulgarianBurmeseCajunCambodianCanadianCape VerdeanCarpatho RusynCelticCentral AmericanCentral American IndianCherokeeCheyenneChickasawChileanChineseChippewaChoctawColombianColvilleComancheCosta RicanCreeCreekCroatianCrowCubanCypriotCzechCzechoslovakianDanishDelawareDominicanDutchDutch West IndianEastern EuropeanEcuadorianEgyptianEnglishEstonianEthiopianEuropeanFijianFilipinoFinnishFrenchFrench American IndianFrench CanadianGermanGerman RussianGhanaianGreekGuamanian/ChamorroGuatemalanGuyaneseHaitianHmongHonduranHopiHoumaHungarianIcelanderIndian (Asian)IndonesianInupiatIranianIraqiIrishIroquoisIsraeliItalianJamaicanJapaneseJordanianKenyanKiowaKoreanLaotianLatvianLebaneseLiberianLithuanianLumbeeLuxembourgerMacedonianMalaysianMalteseMarshalleseMenomineeMexicanMexican American IndianMongolianMoroccanNative HawaiianNavajoNepaleseNew ZealanderNicaraguanNigerianNorthern EuropeanNorwegianOkinawanOsageOttawaPaiutePakistaniPalestinianPanamanianParaguayanPennsylvania GermanPeruvianPimaPolishPortuguesePotawatomiPuebloPuerto RicanPuget Sound SalishRomanianRussianSalvadoranSamoanScandinavianScotch-IrishScottishSeminoleSenegaleseSerbianShoshoneSierra LeoneanSiouxSlavicSlovakSloveneSomaliSouth AfricanSouth AmericanSouth American IndianSoviet UnionSpaniardSpanishSpanish AmericanSpanish American IndianSri LankanSubsaharan AfricanSudaneseSwedishSwissSyrianTaiwaneseThaiTlingit-HaidaTohono O'OdhamTonganTrinidadian and TobagonianTsimshianTurkishU.S. Virgin IslanderUgandanUkrainianUruguayanUteVenezuelanVietnameseWelshWest IndianYakamaYaquiYugoslavianYumanYup'ikZimbabwean
Immigration
ImmigrantsAfghanistanAfricaAlbaniaArgentinaArmeniaAsiaAustraliaAustriaBahamasBangladeshBarbadosBelarusBelgiumBelizeBoliviaBosnia and HerzegovinaBrazilBulgariaBurma/MyanmarCabo VerdeCambodiaCameroonCanadaCaribbeanCentral AmericaChileChinaColombiaCongoCosta RicaCroatiaCubaCzechoslovakiaDenmarkDominicaDominican RepublicEastern AfricaEastern AsiaEastern EuropeEcuadorEgyptEl SalvadorEnglandEritreaEthiopiaEuropeFijiFranceGermanyGhanaGreeceGrenadaGuatemalaGuyanaHaitiHondurasHong KongHungaryIndiaIndonesiaIranIraqIrelandIsraelItalyJamaicaJapanJordanKazakhstanKenyaKoreaKuwaitLaosLatin AmericaLatviaLebanonLiberiaLithuaniaMalaysiaMexicoMicronesiaMiddle AfricaMoldovaMoroccoNepalNetherlandsNicaraguaNigeriaNorth AmericaNorth MacedoniaNorthern AfricaNorthern EuropeNorwayOceaniaPakistanPanamaPeruPhilippinesPolandPortugalRomaniaRussiaSaudi ArabiaScotlandSenegalSerbiaSierra LeoneSingaporeSomaliaSouth AfricaSouth AmericaSouth Central AsiaSouth Eastern AsiaSouthern EuropeSpainSri LankaSt. Vincent and the GrenadinesSudanSwedenSwitzerlandSyriaTaiwanThailandTrinidad and TobagoTurkeyUgandaUkraineUruguayUzbekistanVenezuelaVietnamWest IndiesWestern AfricaWestern AsiaWestern EuropeYemenZaireZimbabweAzores
Married-Couple Family Poverty
Income
Poverty
Unemployment
Labor Participation
Family Structure
Vehicle Availability
Education Level
Disability

Married-Couple Family Poverty Comparison

Nonimmigrants

Celtics

Fair
Exceptional
5.3%
MARRIED-COUPLE FAMILY POVERTY
35.8/ 100
METRIC RATING
184th/ 347
METRIC RANK
4.8%
MARRIED-COUPLE FAMILY POVERTY
94.8/ 100
METRIC RATING
116th/ 347
METRIC RANK

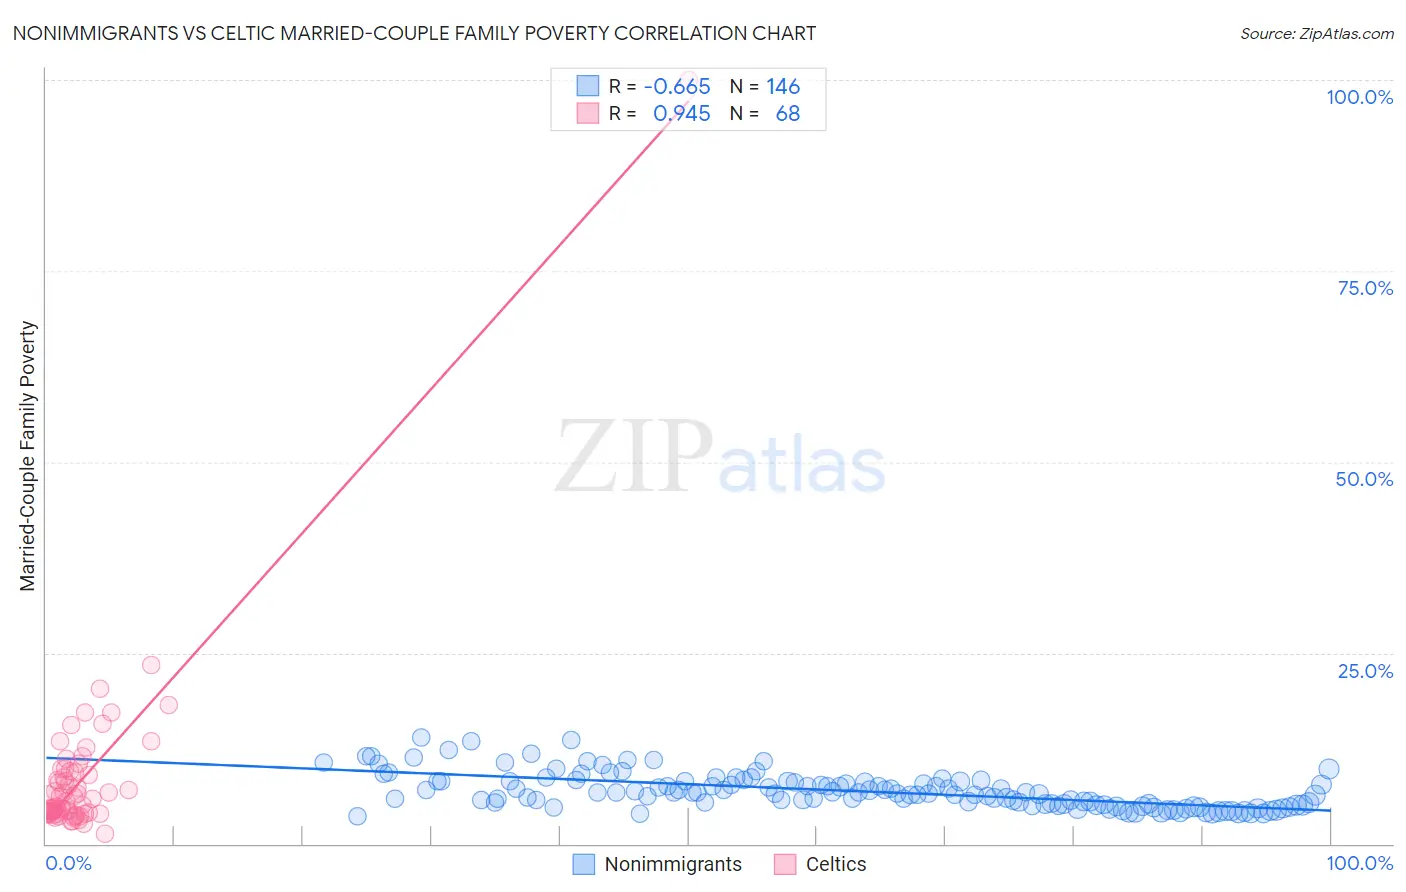
Nonimmigrants vs Celtic Married-Couple Family Poverty Correlation Chart

The statistical analysis conducted on geographies consisting of 567,493,090 people shows a significant negative correlation between the proportion of Nonimmigrants and poverty level among married-couple families in the United States with a correlation coefficient (R) of -0.665 and weighted average of 5.3%. Similarly, the statistical analysis conducted on geographies consisting of 167,973,280 people shows a near-perfect positive correlation between the proportion of Celtics and poverty level among married-couple families in the United States with a correlation coefficient (R) of 0.945 and weighted average of 4.8%, a difference of 11.1%.
Nonimmigrants vs Celtic Married-Couple Family Poverty

Married-Couple Family Poverty Correlation Summary

MeasurementNonimmigrantsCeltic
Minimum3.6%1.3%
Maximum13.9%100.0%
Range10.3%98.7%
Mean6.9%8.7%
Median6.6%5.4%
Interquartile 25% (IQ1)5.1%4.1%
Interquartile 75% (IQ3)8.1%9.4%
Interquartile Range (IQR)3.0%5.4%
Standard Deviation (Sample)2.3%12.2%
Standard Deviation (Population)2.2%12.1%

Similar Demographics by Married-Couple Family Poverty

Demographics Similar to Nonimmigrants by Married-Couple Family Poverty

In terms of married-couple family poverty, the demographic groups most similar to Nonimmigrants are American (5.3%, a difference of 0.060%), Hungarian (5.3%, a difference of 0.13%), Peruvian (5.3%, a difference of 0.22%), Immigrants from Vietnam (5.3%, a difference of 0.24%), and Immigrants from Albania (5.3%, a difference of 0.25%).
DemographicsRating | RankMarried-Couple Family Poverty
Immigrants | Kazakhstan
45.1
/100
|
#177
Average
5.2%
Immigrants | Ukraine
44.9
/100
|
#178
Average
5.2%
Spanish
41.4
/100
|
#179
Average
5.3%
Immigrants | Sierra Leone
39.3
/100
|
#180
Fair
5.3%
Immigrants | Chile
38.8
/100
|
#181
Fair
5.3%
Immigrants | Vietnam
37.7
/100
|
#182
Fair
5.3%
Peruvians
37.6
/100
|
#183
Fair
5.3%
Immigrants | Nonimmigrants
35.8
/100
|
#184
Fair
5.3%
Americans
35.4
/100
|
#185
Fair
5.3%
Hungarians
34.7
/100
|
#186
Fair
5.3%
Immigrants | Albania
33.8
/100
|
#187
Fair
5.3%
Israelis
33.1
/100
|
#188
Fair
5.3%
South American Indians
32.5
/100
|
#189
Fair
5.3%
Ugandans
31.6
/100
|
#190
Fair
5.3%
Immigrants | Cabo Verde
30.9
/100
|
#191
Fair
5.3%

Demographics Similar to Celtics by Married-Couple Family Poverty

In terms of married-couple family poverty, the demographic groups most similar to Celtics are Taiwanese (4.8%, a difference of 0.010%), Kenyan (4.8%, a difference of 0.10%), Immigrants from Philippines (4.8%, a difference of 0.12%), Immigrants from Indonesia (4.8%, a difference of 0.16%), and Immigrants from Eastern Asia (4.8%, a difference of 0.48%).
DemographicsRating | RankMarried-Couple Family Poverty
Immigrants | Hong Kong
96.4
/100
|
#109
Exceptional
4.7%
Immigrants | Bolivia
96.2
/100
|
#110
Exceptional
4.7%
Pakistanis
96.2
/100
|
#111
Exceptional
4.7%
Tongans
95.9
/100
|
#112
Exceptional
4.7%
Immigrants | Nepal
95.9
/100
|
#113
Exceptional
4.7%
Immigrants | Indonesia
95.1
/100
|
#114
Exceptional
4.8%
Taiwanese
94.8
/100
|
#115
Exceptional
4.8%
Celtics
94.8
/100
|
#116
Exceptional
4.8%
Kenyans
94.7
/100
|
#117
Exceptional
4.8%
Immigrants | Philippines
94.6
/100
|
#118
Exceptional
4.8%
Immigrants | Eastern Asia
94.0
/100
|
#119
Exceptional
4.8%
Immigrants | Southern Europe
93.4
/100
|
#120
Exceptional
4.8%
Indians (Asian)
93.2
/100
|
#121
Exceptional
4.8%
Whites/Caucasians
93.1
/100
|
#122
Exceptional
4.8%
Jordanians
93.1
/100
|
#123
Exceptional
4.8%