Immigrants from Zaire vs Celtic Married-Couple Family Poverty
COMPARE
Immigrants from Zaire
Celtic
Married-Couple Family Poverty
Married-Couple Family Poverty Comparison
Immigrants from Zaire
Celtics
5.6%
MARRIED-COUPLE FAMILY POVERTY
5.6/ 100
METRIC RATING
227th/ 347
METRIC RANK
4.8%
MARRIED-COUPLE FAMILY POVERTY
94.8/ 100
METRIC RATING
116th/ 347
METRIC RANK
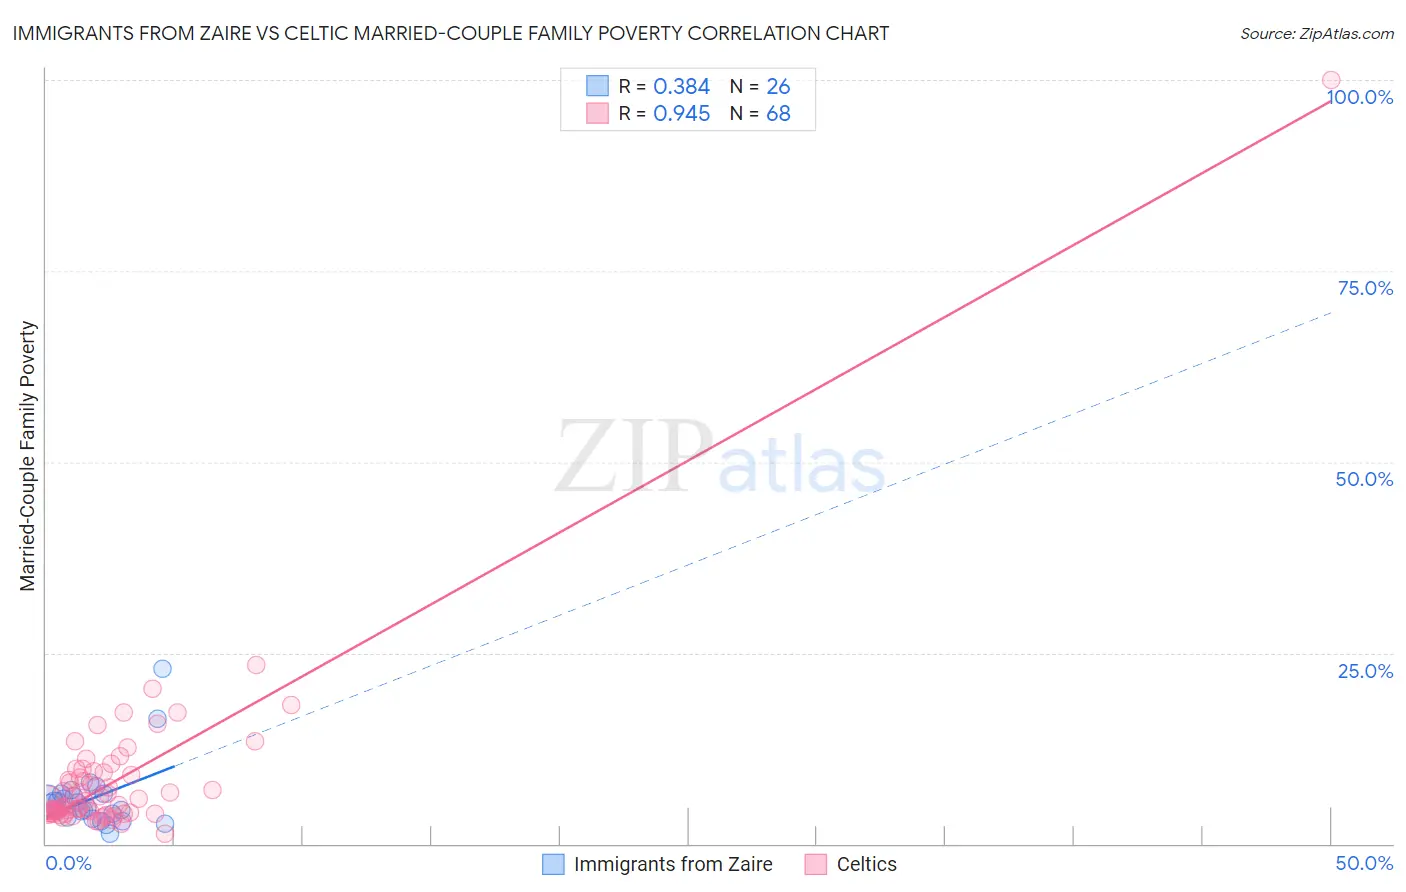
Immigrants from Zaire vs Celtic Married-Couple Family Poverty Correlation Chart
The statistical analysis conducted on geographies consisting of 106,970,215 people shows a mild positive correlation between the proportion of Immigrants from Zaire and poverty level among married-couple families in the United States with a correlation coefficient (R) of 0.384 and weighted average of 5.6%. Similarly, the statistical analysis conducted on geographies consisting of 167,973,280 people shows a near-perfect positive correlation between the proportion of Celtics and poverty level among married-couple families in the United States with a correlation coefficient (R) of 0.945 and weighted average of 4.8%, a difference of 18.2%.
Married-Couple Family Poverty Correlation Summary
| Measurement | Immigrants from Zaire | Celtic |
| Minimum | 1.4% | 1.3% |
| Maximum | 22.9% | 100.0% |
| Range | 21.5% | 98.7% |
| Mean | 6.0% | 8.7% |
| Median | 5.3% | 5.4% |
| Interquartile 25% (IQ1) | 3.5% | 4.1% |
| Interquartile 75% (IQ3) | 6.5% | 9.4% |
| Interquartile Range (IQR) | 3.0% | 5.4% |
| Standard Deviation (Sample) | 4.4% | 12.2% |
| Standard Deviation (Population) | 4.4% | 12.1% |
Similar Demographics by Married-Couple Family Poverty
Demographics Similar to Immigrants from Zaire by Married-Couple Family Poverty
In terms of married-couple family poverty, the demographic groups most similar to Immigrants from Zaire are South American (5.6%, a difference of 0.020%), Arab (5.7%, a difference of 0.13%), Immigrants from Cambodia (5.6%, a difference of 0.24%), Sudanese (5.6%, a difference of 0.38%), and Subsaharan African (5.7%, a difference of 0.38%).
| Demographics | Rating | Rank | Married-Couple Family Poverty |
| Colombians | 9.2 /100 | #220 | Tragic 5.6% |
| Panamanians | 9.2 /100 | #221 | Tragic 5.6% |
| Cajuns | 6.9 /100 | #222 | Tragic 5.6% |
| Immigrants | Fiji | 6.7 /100 | #223 | Tragic 5.6% |
| Sudanese | 6.4 /100 | #224 | Tragic 5.6% |
| Immigrants | Cambodia | 6.1 /100 | #225 | Tragic 5.6% |
| South Americans | 5.7 /100 | #226 | Tragic 5.6% |
| Immigrants | Zaire | 5.6 /100 | #227 | Tragic 5.6% |
| Arabs | 5.4 /100 | #228 | Tragic 5.7% |
| Sub-Saharan Africans | 4.9 /100 | #229 | Tragic 5.7% |
| Moroccans | 4.9 /100 | #230 | Tragic 5.7% |
| Immigrants | Iraq | 4.4 /100 | #231 | Tragic 5.7% |
| Immigrants | Laos | 4.4 /100 | #232 | Tragic 5.7% |
| Immigrants | Colombia | 3.7 /100 | #233 | Tragic 5.7% |
| Immigrants | Uruguay | 3.7 /100 | #234 | Tragic 5.7% |
Demographics Similar to Celtics by Married-Couple Family Poverty
In terms of married-couple family poverty, the demographic groups most similar to Celtics are Taiwanese (4.8%, a difference of 0.010%), Kenyan (4.8%, a difference of 0.10%), Immigrants from Philippines (4.8%, a difference of 0.12%), Immigrants from Indonesia (4.8%, a difference of 0.16%), and Immigrants from Eastern Asia (4.8%, a difference of 0.48%).
| Demographics | Rating | Rank | Married-Couple Family Poverty |
| Immigrants | Hong Kong | 96.4 /100 | #109 | Exceptional 4.7% |
| Immigrants | Bolivia | 96.2 /100 | #110 | Exceptional 4.7% |
| Pakistanis | 96.2 /100 | #111 | Exceptional 4.7% |
| Tongans | 95.9 /100 | #112 | Exceptional 4.7% |
| Immigrants | Nepal | 95.9 /100 | #113 | Exceptional 4.7% |
| Immigrants | Indonesia | 95.1 /100 | #114 | Exceptional 4.8% |
| Taiwanese | 94.8 /100 | #115 | Exceptional 4.8% |
| Celtics | 94.8 /100 | #116 | Exceptional 4.8% |
| Kenyans | 94.7 /100 | #117 | Exceptional 4.8% |
| Immigrants | Philippines | 94.6 /100 | #118 | Exceptional 4.8% |
| Immigrants | Eastern Asia | 94.0 /100 | #119 | Exceptional 4.8% |
| Immigrants | Southern Europe | 93.4 /100 | #120 | Exceptional 4.8% |
| Indians (Asian) | 93.2 /100 | #121 | Exceptional 4.8% |
| Whites/Caucasians | 93.1 /100 | #122 | Exceptional 4.8% |
| Jordanians | 93.1 /100 | #123 | Exceptional 4.8% |