Malaysian vs Immigrants from St. Vincent and the Grenadines Married-Couple Family Poverty
COMPARE
Malaysian
Immigrants from St. Vincent and the Grenadines
Married-Couple Family Poverty
Married-Couple Family Poverty Comparison
Malaysians
Immigrants from St. Vincent and the Grenadines
5.4%
MARRIED-COUPLE FAMILY POVERTY
29.5/ 100
METRIC RATING
193rd/ 347
METRIC RANK
7.1%
MARRIED-COUPLE FAMILY POVERTY
0.0/ 100
METRIC RATING
313th/ 347
METRIC RANK
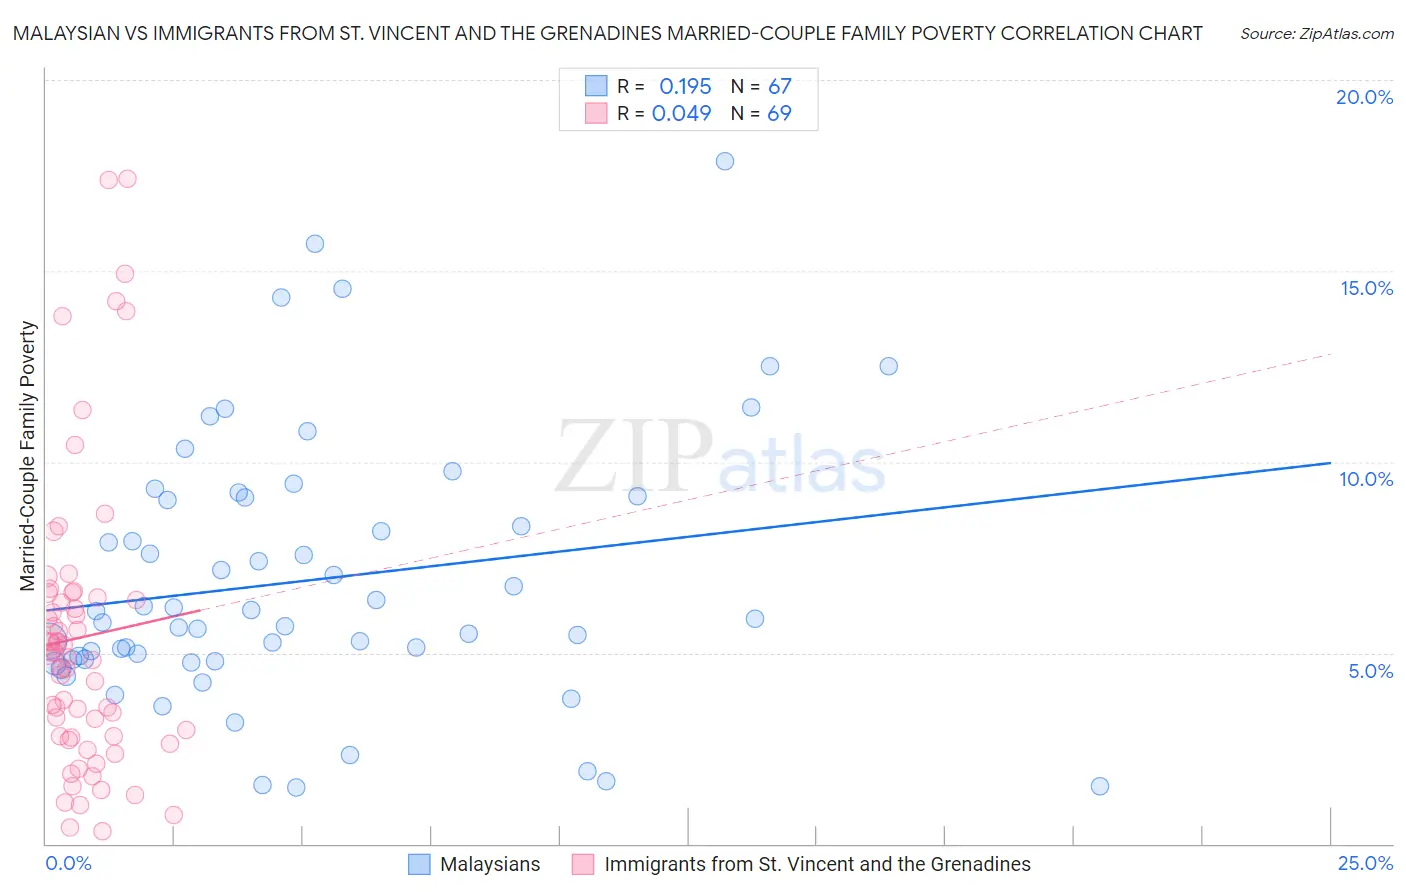
Malaysian vs Immigrants from St. Vincent and the Grenadines Married-Couple Family Poverty Correlation Chart
The statistical analysis conducted on geographies consisting of 224,983,530 people shows a poor positive correlation between the proportion of Malaysians and poverty level among married-couple families in the United States with a correlation coefficient (R) of 0.195 and weighted average of 5.4%. Similarly, the statistical analysis conducted on geographies consisting of 56,063,959 people shows no correlation between the proportion of Immigrants from St. Vincent and the Grenadines and poverty level among married-couple families in the United States with a correlation coefficient (R) of 0.049 and weighted average of 7.1%, a difference of 32.8%.
Married-Couple Family Poverty Correlation Summary
| Measurement | Malaysian | Immigrants from St. Vincent and the Grenadines |
| Minimum | 1.5% | 0.34% |
| Maximum | 17.9% | 17.4% |
| Range | 16.4% | 17.1% |
| Mean | 6.9% | 5.4% |
| Median | 5.9% | 4.9% |
| Interquartile 25% (IQ1) | 4.8% | 2.8% |
| Interquartile 75% (IQ3) | 9.1% | 6.5% |
| Interquartile Range (IQR) | 4.2% | 3.7% |
| Standard Deviation (Sample) | 3.5% | 3.8% |
| Standard Deviation (Population) | 3.4% | 3.8% |
Similar Demographics by Married-Couple Family Poverty
Demographics Similar to Malaysians by Married-Couple Family Poverty
In terms of married-couple family poverty, the demographic groups most similar to Malaysians are Cape Verdean (5.3%, a difference of 0.17%), Immigrants from Cabo Verde (5.3%, a difference of 0.19%), Immigrants from Israel (5.4%, a difference of 0.22%), Immigrants from the Azores (5.4%, a difference of 0.27%), and Ugandan (5.3%, a difference of 0.29%).
| Demographics | Rating | Rank | Married-Couple Family Poverty |
| Hungarians | 34.7 /100 | #186 | Fair 5.3% |
| Immigrants | Albania | 33.8 /100 | #187 | Fair 5.3% |
| Israelis | 33.1 /100 | #188 | Fair 5.3% |
| South American Indians | 32.5 /100 | #189 | Fair 5.3% |
| Ugandans | 31.6 /100 | #190 | Fair 5.3% |
| Immigrants | Cabo Verde | 30.9 /100 | #191 | Fair 5.3% |
| Cape Verdeans | 30.7 /100 | #192 | Fair 5.3% |
| Malaysians | 29.5 /100 | #193 | Fair 5.4% |
| Immigrants | Israel | 27.8 /100 | #194 | Fair 5.4% |
| Immigrants | Azores | 27.5 /100 | #195 | Fair 5.4% |
| Spaniards | 27.4 /100 | #196 | Fair 5.4% |
| Liberians | 26.3 /100 | #197 | Fair 5.4% |
| Immigrants | Belarus | 26.2 /100 | #198 | Fair 5.4% |
| Uruguayans | 25.0 /100 | #199 | Fair 5.4% |
| Immigrants | Morocco | 24.3 /100 | #200 | Fair 5.4% |
Demographics Similar to Immigrants from St. Vincent and the Grenadines by Married-Couple Family Poverty
In terms of married-couple family poverty, the demographic groups most similar to Immigrants from St. Vincent and the Grenadines are Immigrants from Dominica (7.1%, a difference of 0.11%), Immigrants from Armenia (7.1%, a difference of 0.11%), Immigrants from Nicaragua (7.1%, a difference of 0.17%), Hopi (7.1%, a difference of 0.19%), and British West Indian (7.1%, a difference of 0.30%).
| Demographics | Rating | Rank | Married-Couple Family Poverty |
| Immigrants | Haiti | 0.0 /100 | #306 | Tragic 7.0% |
| Guatemalans | 0.0 /100 | #307 | Tragic 7.0% |
| Spanish American Indians | 0.0 /100 | #308 | Tragic 7.1% |
| Hopi | 0.0 /100 | #309 | Tragic 7.1% |
| Immigrants | Nicaragua | 0.0 /100 | #310 | Tragic 7.1% |
| Immigrants | Dominica | 0.0 /100 | #311 | Tragic 7.1% |
| Immigrants | Armenia | 0.0 /100 | #312 | Tragic 7.1% |
| Immigrants | St. Vincent and the Grenadines | 0.0 /100 | #313 | Tragic 7.1% |
| British West Indians | 0.0 /100 | #314 | Tragic 7.1% |
| Inupiat | 0.0 /100 | #315 | Tragic 7.1% |
| Hondurans | 0.0 /100 | #316 | Tragic 7.2% |
| Mexicans | 0.0 /100 | #317 | Tragic 7.2% |
| Immigrants | Guatemala | 0.0 /100 | #318 | Tragic 7.2% |
| Immigrants | Latin America | 0.0 /100 | #319 | Tragic 7.2% |
| Immigrants | Grenada | 0.0 /100 | #320 | Tragic 7.3% |