Irish vs Immigrants from Argentina Married-Couple Family Poverty
COMPARE
Irish
Immigrants from Argentina
Married-Couple Family Poverty
Married-Couple Family Poverty Comparison
Irish
Immigrants from Argentina
4.2%
MARRIED-COUPLE FAMILY POVERTY
99.9/ 100
METRIC RATING
33rd/ 347
METRIC RANK
5.2%
MARRIED-COUPLE FAMILY POVERTY
54.4/ 100
METRIC RATING
170th/ 347
METRIC RANK
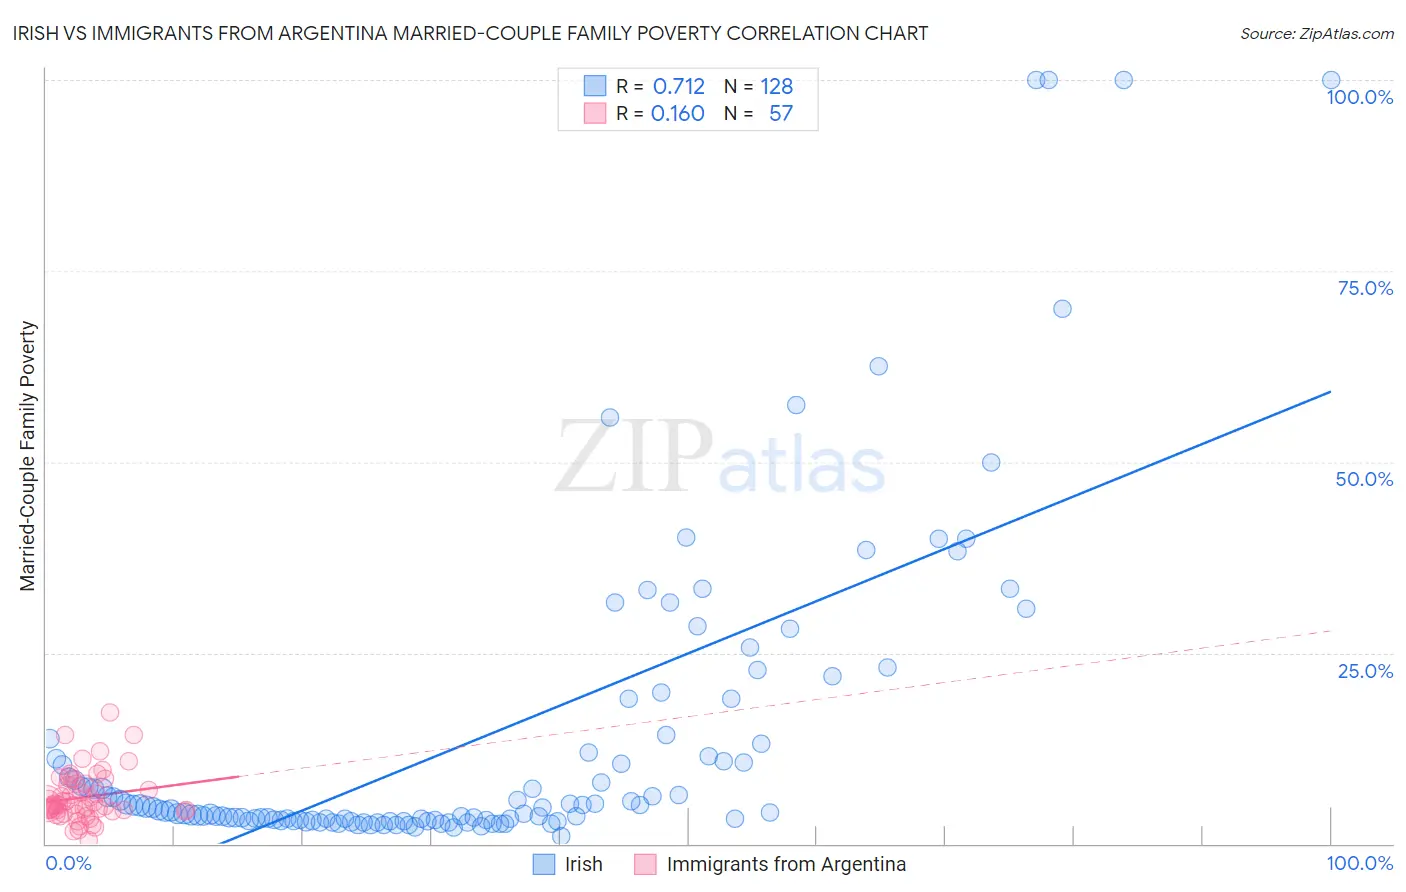
Irish vs Immigrants from Argentina Married-Couple Family Poverty Correlation Chart
The statistical analysis conducted on geographies consisting of 563,529,593 people shows a strong positive correlation between the proportion of Irish and poverty level among married-couple families in the United States with a correlation coefficient (R) of 0.712 and weighted average of 4.2%. Similarly, the statistical analysis conducted on geographies consisting of 263,243,889 people shows a poor positive correlation between the proportion of Immigrants from Argentina and poverty level among married-couple families in the United States with a correlation coefficient (R) of 0.160 and weighted average of 5.2%, a difference of 24.0%.
Married-Couple Family Poverty Correlation Summary
| Measurement | Irish | Immigrants from Argentina |
| Minimum | 0.92% | 0.43% |
| Maximum | 100.0% | 17.1% |
| Range | 99.1% | 16.7% |
| Mean | 13.8% | 6.1% |
| Median | 4.6% | 5.1% |
| Interquartile 25% (IQ1) | 3.1% | 4.3% |
| Interquartile 75% (IQ3) | 12.5% | 7.9% |
| Interquartile Range (IQR) | 9.4% | 3.6% |
| Standard Deviation (Sample) | 20.9% | 3.3% |
| Standard Deviation (Population) | 20.8% | 3.2% |
Similar Demographics by Married-Couple Family Poverty
Demographics Similar to Irish by Married-Couple Family Poverty
In terms of married-couple family poverty, the demographic groups most similar to Irish are Dutch (4.2%, a difference of 0.23%), Greek (4.2%, a difference of 0.48%), Estonian (4.2%, a difference of 0.59%), Finnish (4.2%, a difference of 0.67%), and European (4.2%, a difference of 0.80%).
| Demographics | Rating | Rank | Married-Couple Family Poverty |
| Cypriots | 99.9 /100 | #26 | Exceptional 4.1% |
| Danes | 99.9 /100 | #27 | Exceptional 4.1% |
| Scandinavians | 99.9 /100 | #28 | Exceptional 4.1% |
| Immigrants | Scotland | 99.9 /100 | #29 | Exceptional 4.2% |
| Finns | 99.9 /100 | #30 | Exceptional 4.2% |
| Estonians | 99.9 /100 | #31 | Exceptional 4.2% |
| Greeks | 99.9 /100 | #32 | Exceptional 4.2% |
| Irish | 99.9 /100 | #33 | Exceptional 4.2% |
| Dutch | 99.9 /100 | #34 | Exceptional 4.2% |
| Europeans | 99.9 /100 | #35 | Exceptional 4.2% |
| English | 99.9 /100 | #36 | Exceptional 4.2% |
| Iranians | 99.9 /100 | #37 | Exceptional 4.2% |
| Belgians | 99.9 /100 | #38 | Exceptional 4.2% |
| Immigrants | Northern Europe | 99.8 /100 | #39 | Exceptional 4.2% |
| French Canadians | 99.8 /100 | #40 | Exceptional 4.2% |
Demographics Similar to Immigrants from Argentina by Married-Couple Family Poverty
In terms of married-couple family poverty, the demographic groups most similar to Immigrants from Argentina are Ottawa (5.2%, a difference of 0.010%), Immigrants from Uganda (5.2%, a difference of 0.060%), Bermudan (5.2%, a difference of 0.18%), Immigrants from Northern Africa (5.2%, a difference of 0.35%), and Alsatian (5.2%, a difference of 0.37%).
| Demographics | Rating | Rank | Married-Couple Family Poverty |
| Sierra Leoneans | 64.1 /100 | #163 | Good 5.1% |
| Hawaiians | 62.3 /100 | #164 | Good 5.1% |
| Immigrants | Malaysia | 62.2 /100 | #165 | Good 5.1% |
| Paraguayans | 61.5 /100 | #166 | Good 5.1% |
| Costa Ricans | 61.5 /100 | #167 | Good 5.1% |
| Immigrants | Uganda | 54.9 /100 | #168 | Average 5.2% |
| Ottawa | 54.5 /100 | #169 | Average 5.2% |
| Immigrants | Argentina | 54.4 /100 | #170 | Average 5.2% |
| Bermudans | 52.9 /100 | #171 | Average 5.2% |
| Immigrants | Northern Africa | 51.3 /100 | #172 | Average 5.2% |
| Alsatians | 51.2 /100 | #173 | Average 5.2% |
| Immigrants | Eastern Africa | 50.0 /100 | #174 | Average 5.2% |
| Marshallese | 47.9 /100 | #175 | Average 5.2% |
| Menominee | 47.8 /100 | #176 | Average 5.2% |
| Immigrants | Kazakhstan | 45.1 /100 | #177 | Average 5.2% |