Immigrants from Trinidad and Tobago vs Yup'ik Married-Couple Family Poverty

COMPARE

Immigrants from Trinidad and Tobago
Race
Ancestry
AfghanAfricanAlaska NativeAlaskan AthabascanAlbanianAleutAlsatianAmericanApacheArabArapahoArgentineanArmenianAssyrian/Chaldean/SyriacAustralianAustrianBahamianBangladeshiBarbadianBasqueBelgianBelizeanBermudanBhutaneseBlackfeetBolivianBrazilianBritishBritish West IndianBulgarianBurmeseCajunCambodianCanadianCape VerdeanCarpatho RusynCelticCentral AmericanCentral American IndianCherokeeCheyenneChickasawChileanChineseChippewaChoctawColombianColvilleComancheCosta RicanCreeCreekCroatianCrowCubanCypriotCzechCzechoslovakianDanishDelawareDominicanDutchDutch West IndianEastern EuropeanEcuadorianEgyptianEnglishEstonianEthiopianEuropeanFijianFilipinoFinnishFrenchFrench American IndianFrench CanadianGermanGerman RussianGhanaianGreekGuamanian/ChamorroGuatemalanGuyaneseHaitianHmongHonduranHopiHoumaHungarianIcelanderIndian (Asian)IndonesianInupiatIranianIraqiIrishIroquoisIsraeliItalianJamaicanJapaneseJordanianKenyanKiowaKoreanLaotianLatvianLebaneseLiberianLithuanianLumbeeLuxembourgerMacedonianMalaysianMalteseMarshalleseMenomineeMexicanMexican American IndianMongolianMoroccanNative HawaiianNavajoNepaleseNew ZealanderNicaraguanNigerianNorthern EuropeanNorwegianOkinawanOsageOttawaPaiutePakistaniPalestinianPanamanianParaguayanPennsylvania GermanPeruvianPimaPolishPortuguesePotawatomiPuebloPuerto RicanPuget Sound SalishRomanianRussianSalvadoranSamoanScandinavianScotch-IrishScottishSeminoleSenegaleseSerbianShoshoneSierra LeoneanSiouxSlavicSlovakSloveneSomaliSouth AfricanSouth AmericanSouth American IndianSoviet UnionSpaniardSpanishSpanish AmericanSpanish American IndianSri LankanSubsaharan AfricanSudaneseSwedishSwissSyrianTaiwaneseThaiTlingit-HaidaTohono O'OdhamTonganTrinidadian and TobagonianTsimshianTurkishU.S. Virgin IslanderUgandanUkrainianUruguayanUteVenezuelanVietnameseWelshWest IndianYakamaYaquiYugoslavianYumanZimbabwean
Immigration
NonimmigrantsImmigrantsAfghanistanAfricaAlbaniaArgentinaArmeniaAsiaAustraliaAustriaBahamasBangladeshBarbadosBelarusBelgiumBelizeBoliviaBosnia and HerzegovinaBrazilBulgariaBurma/MyanmarCabo VerdeCambodiaCameroonCanadaCaribbeanCentral AmericaChileChinaColombiaCongoCosta RicaCroatiaCubaCzechoslovakiaDenmarkDominicaDominican RepublicEastern AfricaEastern AsiaEastern EuropeEcuadorEgyptEl SalvadorEnglandEritreaEthiopiaEuropeFijiFranceGermanyGhanaGreeceGrenadaGuatemalaGuyanaHaitiHondurasHong KongHungaryIndiaIndonesiaIranIraqIrelandIsraelItalyJamaicaJapanJordanKazakhstanKenyaKoreaKuwaitLaosLatin AmericaLatviaLebanonLiberiaLithuaniaMalaysiaMexicoMicronesiaMiddle AfricaMoldovaMoroccoNepalNetherlandsNicaraguaNigeriaNorth AmericaNorth MacedoniaNorthern AfricaNorthern EuropeNorwayOceaniaPakistanPanamaPeruPhilippinesPolandPortugalRomaniaRussiaSaudi ArabiaScotlandSenegalSerbiaSierra LeoneSingaporeSomaliaSouth AfricaSouth AmericaSouth Central AsiaSouth Eastern AsiaSouthern EuropeSpainSri LankaSt. Vincent and the GrenadinesSudanSwedenSwitzerlandSyriaTaiwanThailandTrinidad and TobagoTurkeyUgandaUkraineUruguayUzbekistanVenezuelaVietnamWest IndiesWestern AfricaWestern AsiaWestern EuropeYemenZaireZimbabweAzores
Yup'ik
Race
Ancestry
AfghanAfricanAlaska NativeAlaskan AthabascanAlbanianAleutAlsatianAmericanApacheArabArapahoArgentineanArmenianAssyrian/Chaldean/SyriacAustralianAustrianBahamianBangladeshiBarbadianBasqueBelgianBelizeanBermudanBhutaneseBlackfeetBolivianBrazilianBritishBritish West IndianBulgarianBurmeseCajunCambodianCanadianCape VerdeanCarpatho RusynCelticCentral AmericanCentral American IndianCherokeeCheyenneChickasawChileanChineseChippewaChoctawColombianColvilleComancheCosta RicanCreeCreekCroatianCrowCubanCypriotCzechCzechoslovakianDanishDelawareDominicanDutchDutch West IndianEastern EuropeanEcuadorianEgyptianEnglishEstonianEthiopianEuropeanFijianFilipinoFinnishFrenchFrench American IndianFrench CanadianGermanGerman RussianGhanaianGreekGuamanian/ChamorroGuatemalanGuyaneseHaitianHmongHonduranHopiHoumaHungarianIcelanderIndian (Asian)IndonesianInupiatIranianIraqiIrishIroquoisIsraeliItalianJamaicanJapaneseJordanianKenyanKiowaKoreanLaotianLatvianLebaneseLiberianLithuanianLumbeeLuxembourgerMacedonianMalaysianMalteseMarshalleseMenomineeMexicanMexican American IndianMongolianMoroccanNative HawaiianNavajoNepaleseNew ZealanderNicaraguanNigerianNorthern EuropeanNorwegianOkinawanOsageOttawaPaiutePakistaniPalestinianPanamanianParaguayanPennsylvania GermanPeruvianPimaPolishPortuguesePotawatomiPuebloPuerto RicanPuget Sound SalishRomanianRussianSalvadoranSamoanScandinavianScotch-IrishScottishSeminoleSenegaleseSerbianShoshoneSierra LeoneanSiouxSlavicSlovakSloveneSomaliSouth AfricanSouth AmericanSouth American IndianSoviet UnionSpaniardSpanishSpanish AmericanSpanish American IndianSri LankanSubsaharan AfricanSudaneseSwedishSwissSyrianTaiwaneseThaiTlingit-HaidaTohono O'OdhamTonganTrinidadian and TobagonianTsimshianTurkishU.S. Virgin IslanderUgandanUkrainianUruguayanUteVenezuelanVietnameseWelshWest IndianYakamaYaquiYugoslavianYumanYup'ikZimbabwean
Immigration
NonimmigrantsImmigrantsAfghanistanAfricaAlbaniaArgentinaArmeniaAsiaAustraliaAustriaBahamasBangladeshBarbadosBelarusBelgiumBelizeBoliviaBosnia and HerzegovinaBrazilBulgariaBurma/MyanmarCabo VerdeCambodiaCameroonCanadaCaribbeanCentral AmericaChileChinaColombiaCongoCosta RicaCroatiaCubaCzechoslovakiaDenmarkDominicaDominican RepublicEastern AfricaEastern AsiaEastern EuropeEcuadorEgyptEl SalvadorEnglandEritreaEthiopiaEuropeFijiFranceGermanyGhanaGreeceGrenadaGuatemalaGuyanaHaitiHondurasHong KongHungaryIndiaIndonesiaIranIraqIrelandIsraelItalyJamaicaJapanJordanKazakhstanKenyaKoreaKuwaitLaosLatin AmericaLatviaLebanonLiberiaLithuaniaMalaysiaMexicoMicronesiaMiddle AfricaMoldovaMoroccoNepalNetherlandsNicaraguaNigeriaNorth AmericaNorth MacedoniaNorthern AfricaNorthern EuropeNorwayOceaniaPakistanPanamaPeruPhilippinesPolandPortugalRomaniaRussiaSaudi ArabiaScotlandSenegalSerbiaSierra LeoneSingaporeSomaliaSouth AfricaSouth AmericaSouth Central AsiaSouth Eastern AsiaSouthern EuropeSpainSri LankaSt. Vincent and the GrenadinesSudanSwedenSwitzerlandSyriaTaiwanThailandTurkeyUgandaUkraineUruguayUzbekistanVenezuelaVietnamWest IndiesWestern AfricaWestern AsiaWestern EuropeYemenZaireZimbabweAzores
Married-Couple Family Poverty
Income
Poverty
Unemployment
Labor Participation
Family Structure
Vehicle Availability
Education Level
Disability

Married-Couple Family Poverty Comparison

Immigrants from Trinidad and Tobago

Yup'ik

Tragic
Tragic
6.4%
MARRIED-COUPLE FAMILY POVERTY
0.1/ 100
METRIC RATING
278th/ 347
METRIC RANK
13.4%
MARRIED-COUPLE FAMILY POVERTY
0.0/ 100
METRIC RATING
347th/ 347
METRIC RANK

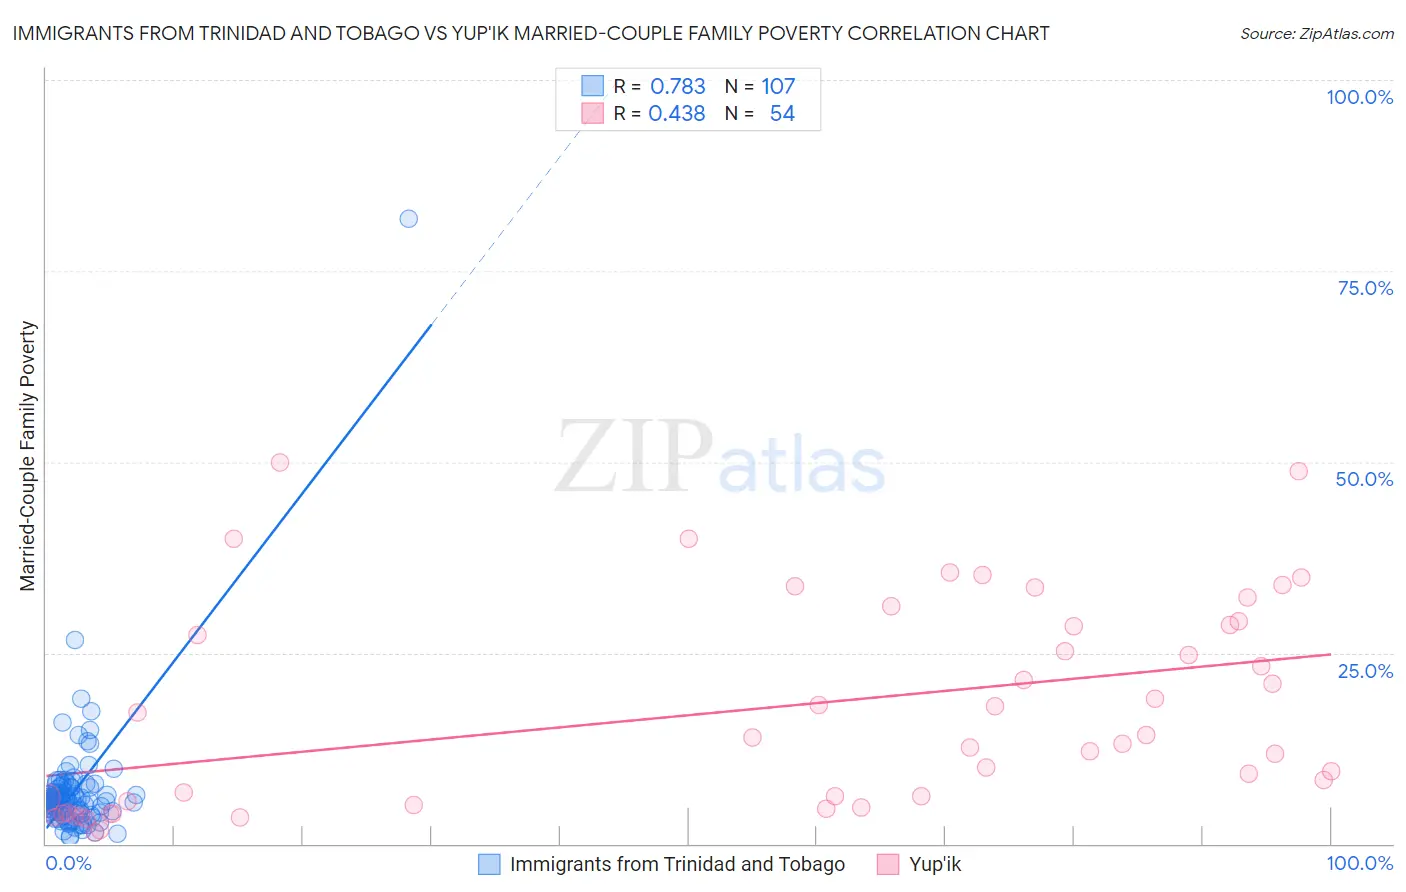
Immigrants from Trinidad and Tobago vs Yup'ik Married-Couple Family Poverty Correlation Chart

The statistical analysis conducted on geographies consisting of 222,433,461 people shows a strong positive correlation between the proportion of Immigrants from Trinidad and Tobago and poverty level among married-couple families in the United States with a correlation coefficient (R) of 0.783 and weighted average of 6.4%. Similarly, the statistical analysis conducted on geographies consisting of 39,863,865 people shows a moderate positive correlation between the proportion of Yup'ik and poverty level among married-couple families in the United States with a correlation coefficient (R) of 0.438 and weighted average of 13.4%, a difference of 110.5%.
Immigrants from Trinidad and Tobago vs Yup'ik Married-Couple Family Poverty

Married-Couple Family Poverty Correlation Summary

MeasurementImmigrants from Trinidad and TobagoYup'ik
Minimum0.88%1.5%
Maximum81.8%50.0%
Range80.9%48.5%
Mean6.9%17.5%
Median5.6%13.4%
Interquartile 25% (IQ1)4.1%5.1%
Interquartile 75% (IQ3)7.4%28.6%
Interquartile Range (IQR)3.2%23.4%
Standard Deviation (Sample)8.2%13.4%
Standard Deviation (Population)8.2%13.3%

Similar Demographics by Married-Couple Family Poverty

Demographics Similar to Immigrants from Trinidad and Tobago by Married-Couple Family Poverty

In terms of married-couple family poverty, the demographic groups most similar to Immigrants from Trinidad and Tobago are Houma (6.4%, a difference of 0.25%), West Indian (6.4%, a difference of 0.29%), Indonesian (6.3%, a difference of 0.48%), Yaqui (6.3%, a difference of 0.62%), and Mexican American Indian (6.4%, a difference of 0.80%).
DemographicsRating | RankMarried-Couple Family Poverty
Immigrants | Bahamas
0.1
/100
|
#271
Tragic
6.2%
Trinidadians and Tobagonians
0.1
/100
|
#272
Tragic
6.2%
Colville
0.1
/100
|
#273
Tragic
6.3%
Barbadians
0.1
/100
|
#274
Tragic
6.3%
Choctaw
0.1
/100
|
#275
Tragic
6.3%
Yaqui
0.1
/100
|
#276
Tragic
6.3%
Indonesians
0.1
/100
|
#277
Tragic
6.3%
Immigrants | Trinidad and Tobago
0.1
/100
|
#278
Tragic
6.4%
Houma
0.0
/100
|
#279
Tragic
6.4%
West Indians
0.0
/100
|
#280
Tragic
6.4%
Mexican American Indians
0.0
/100
|
#281
Tragic
6.4%
Seminole
0.0
/100
|
#282
Tragic
6.4%
Ute
0.0
/100
|
#283
Tragic
6.4%
Dutch West Indians
0.0
/100
|
#284
Tragic
6.4%
Blacks/African Americans
0.0
/100
|
#285
Tragic
6.5%

Demographics Similar to Yup'ik by Married-Couple Family Poverty

In terms of married-couple family poverty, the demographic groups most similar to Yup'ik are Immigrants from Yemen (12.8%, a difference of 4.6%), Puerto Rican (12.6%, a difference of 6.0%), Navajo (11.9%, a difference of 13.0%), Pima (11.4%, a difference of 17.4%), and Tohono O'odham (11.2%, a difference of 19.3%).
DemographicsRating | RankMarried-Couple Family Poverty
Lumbee
0.0
/100
|
#333
Tragic
8.3%
Immigrants | Dominican Republic
0.0
/100
|
#334
Tragic
8.4%
Sioux
0.0
/100
|
#335
Tragic
8.7%
Apache
0.0
/100
|
#336
Tragic
9.0%
Yakama
0.0
/100
|
#337
Tragic
9.0%
Cheyenne
0.0
/100
|
#338
Tragic
9.4%
Crow
0.0
/100
|
#339
Tragic
9.6%
Yuman
0.0
/100
|
#340
Tragic
9.7%
Pueblo
0.0
/100
|
#341
Tragic
11.1%
Tohono O'odham
0.0
/100
|
#342
Tragic
11.2%
Pima
0.0
/100
|
#343
Tragic
11.4%
Navajo
0.0
/100
|
#344
Tragic
11.9%
Puerto Ricans
0.0
/100
|
#345
Tragic
12.6%
Immigrants | Yemen
0.0
/100
|
#346
Tragic
12.8%
Yup'ik
0.0
/100
|
#347
Tragic
13.4%