Immigrants from Jamaica vs Cuban Married-Couple Family Poverty
COMPARE
Immigrants from Jamaica
Cuban
Married-Couple Family Poverty
Married-Couple Family Poverty Comparison
Immigrants from Jamaica
Cubans
6.2%
MARRIED-COUPLE FAMILY POVERTY
0.1/ 100
METRIC RATING
270th/ 347
METRIC RANK
6.8%
MARRIED-COUPLE FAMILY POVERTY
0.0/ 100
METRIC RATING
304th/ 347
METRIC RANK
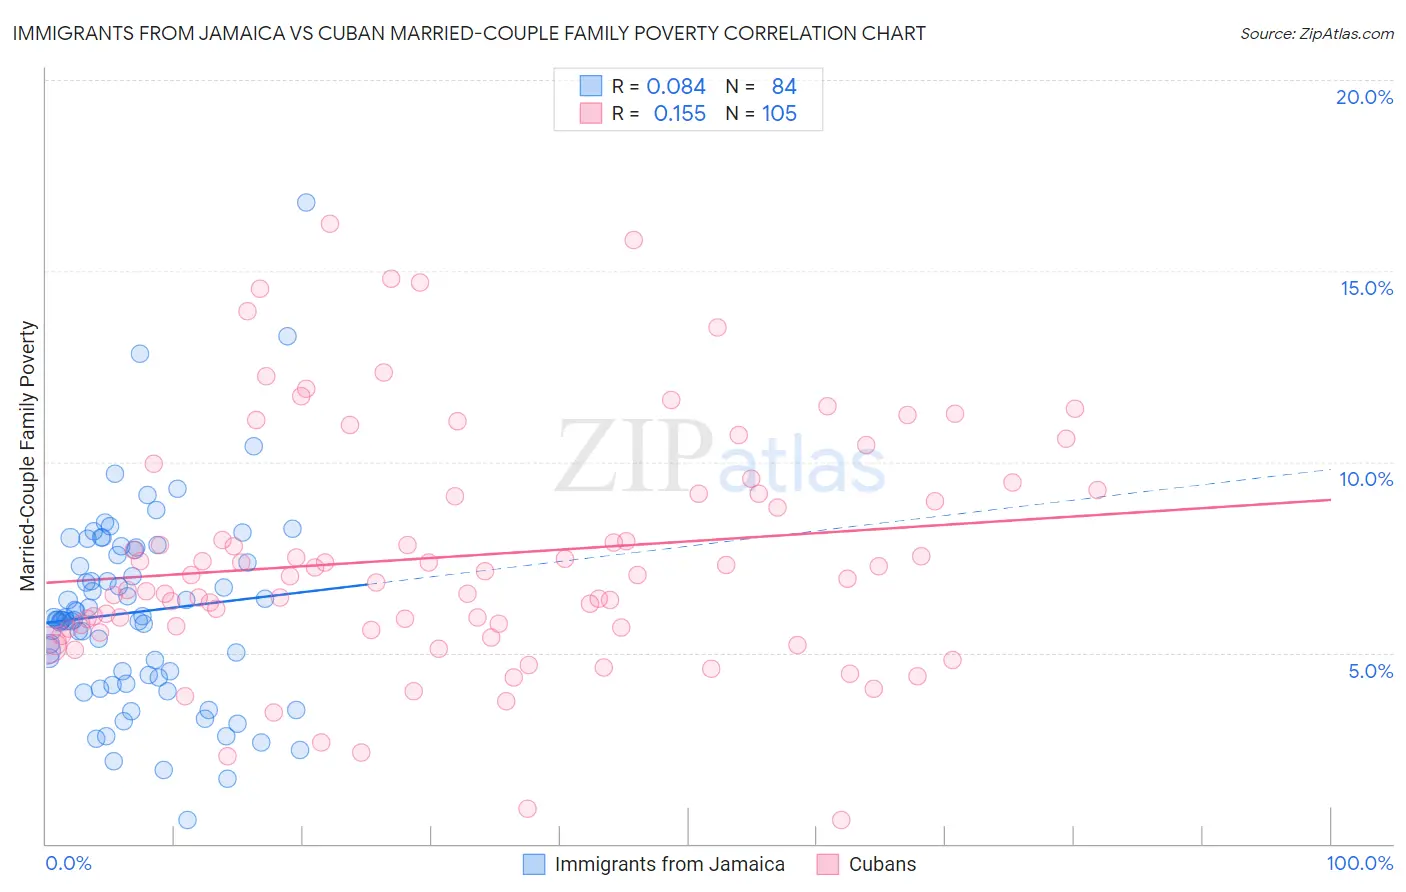
Immigrants from Jamaica vs Cuban Married-Couple Family Poverty Correlation Chart
The statistical analysis conducted on geographies consisting of 299,624,041 people shows a slight positive correlation between the proportion of Immigrants from Jamaica and poverty level among married-couple families in the United States with a correlation coefficient (R) of 0.084 and weighted average of 6.2%. Similarly, the statistical analysis conducted on geographies consisting of 444,866,425 people shows a poor positive correlation between the proportion of Cubans and poverty level among married-couple families in the United States with a correlation coefficient (R) of 0.155 and weighted average of 6.8%, a difference of 9.3%.
Married-Couple Family Poverty Correlation Summary
| Measurement | Immigrants from Jamaica | Cuban |
| Minimum | 0.61% | 0.61% |
| Maximum | 16.8% | 16.2% |
| Range | 16.2% | 15.6% |
| Mean | 6.1% | 7.5% |
| Median | 5.9% | 7.0% |
| Interquartile 25% (IQ1) | 4.4% | 5.6% |
| Interquartile 75% (IQ3) | 7.6% | 9.2% |
| Interquartile Range (IQR) | 3.2% | 3.6% |
| Standard Deviation (Sample) | 2.6% | 3.1% |
| Standard Deviation (Population) | 2.6% | 3.1% |
Similar Demographics by Married-Couple Family Poverty
Demographics Similar to Immigrants from Jamaica by Married-Couple Family Poverty
In terms of married-couple family poverty, the demographic groups most similar to Immigrants from Jamaica are Immigrants from West Indies (6.2%, a difference of 0.040%), Alaska Native (6.2%, a difference of 0.21%), Immigrants from Bahamas (6.2%, a difference of 0.22%), Trinidadian and Tobagonian (6.2%, a difference of 0.25%), and Spanish American (6.2%, a difference of 0.69%).
| Demographics | Rating | Rank | Married-Couple Family Poverty |
| Immigrants | Senegal | 0.3 /100 | #263 | Tragic 6.1% |
| Immigrants | Congo | 0.2 /100 | #264 | Tragic 6.1% |
| Blackfeet | 0.2 /100 | #265 | Tragic 6.2% |
| Creek | 0.2 /100 | #266 | Tragic 6.2% |
| Spanish Americans | 0.2 /100 | #267 | Tragic 6.2% |
| Alaska Natives | 0.2 /100 | #268 | Tragic 6.2% |
| Immigrants | West Indies | 0.1 /100 | #269 | Tragic 6.2% |
| Immigrants | Jamaica | 0.1 /100 | #270 | Tragic 6.2% |
| Immigrants | Bahamas | 0.1 /100 | #271 | Tragic 6.2% |
| Trinidadians and Tobagonians | 0.1 /100 | #272 | Tragic 6.2% |
| Colville | 0.1 /100 | #273 | Tragic 6.3% |
| Barbadians | 0.1 /100 | #274 | Tragic 6.3% |
| Choctaw | 0.1 /100 | #275 | Tragic 6.3% |
| Yaqui | 0.1 /100 | #276 | Tragic 6.3% |
| Indonesians | 0.1 /100 | #277 | Tragic 6.3% |
Demographics Similar to Cubans by Married-Couple Family Poverty
In terms of married-couple family poverty, the demographic groups most similar to Cubans are Haitian (6.8%, a difference of 0.10%), Immigrants from El Salvador (6.8%, a difference of 0.44%), Immigrants from Ecuador (6.7%, a difference of 0.72%), Central American (6.7%, a difference of 0.86%), and Immigrants from Belize (6.7%, a difference of 1.5%).
| Demographics | Rating | Rank | Married-Couple Family Poverty |
| Kiowa | 0.0 /100 | #297 | Tragic 6.6% |
| Immigrants | Guyana | 0.0 /100 | #298 | Tragic 6.7% |
| Nicaraguans | 0.0 /100 | #299 | Tragic 6.7% |
| Immigrants | Belize | 0.0 /100 | #300 | Tragic 6.7% |
| Central Americans | 0.0 /100 | #301 | Tragic 6.7% |
| Immigrants | Ecuador | 0.0 /100 | #302 | Tragic 6.7% |
| Immigrants | El Salvador | 0.0 /100 | #303 | Tragic 6.8% |
| Cubans | 0.0 /100 | #304 | Tragic 6.8% |
| Haitians | 0.0 /100 | #305 | Tragic 6.8% |
| Immigrants | Haiti | 0.0 /100 | #306 | Tragic 7.0% |
| Guatemalans | 0.0 /100 | #307 | Tragic 7.0% |
| Spanish American Indians | 0.0 /100 | #308 | Tragic 7.1% |
| Hopi | 0.0 /100 | #309 | Tragic 7.1% |
| Immigrants | Nicaragua | 0.0 /100 | #310 | Tragic 7.1% |
| Immigrants | Dominica | 0.0 /100 | #311 | Tragic 7.1% |