Immigrants from Guatemala vs Latvian Married-Couple Family Poverty
COMPARE
Immigrants from Guatemala
Latvian
Married-Couple Family Poverty
Married-Couple Family Poverty Comparison
Immigrants from Guatemala
Latvians
7.2%
MARRIED-COUPLE FAMILY POVERTY
0.0/ 100
METRIC RATING
318th/ 347
METRIC RANK
3.9%
MARRIED-COUPLE FAMILY POVERTY
100.0/ 100
METRIC RATING
7th/ 347
METRIC RANK
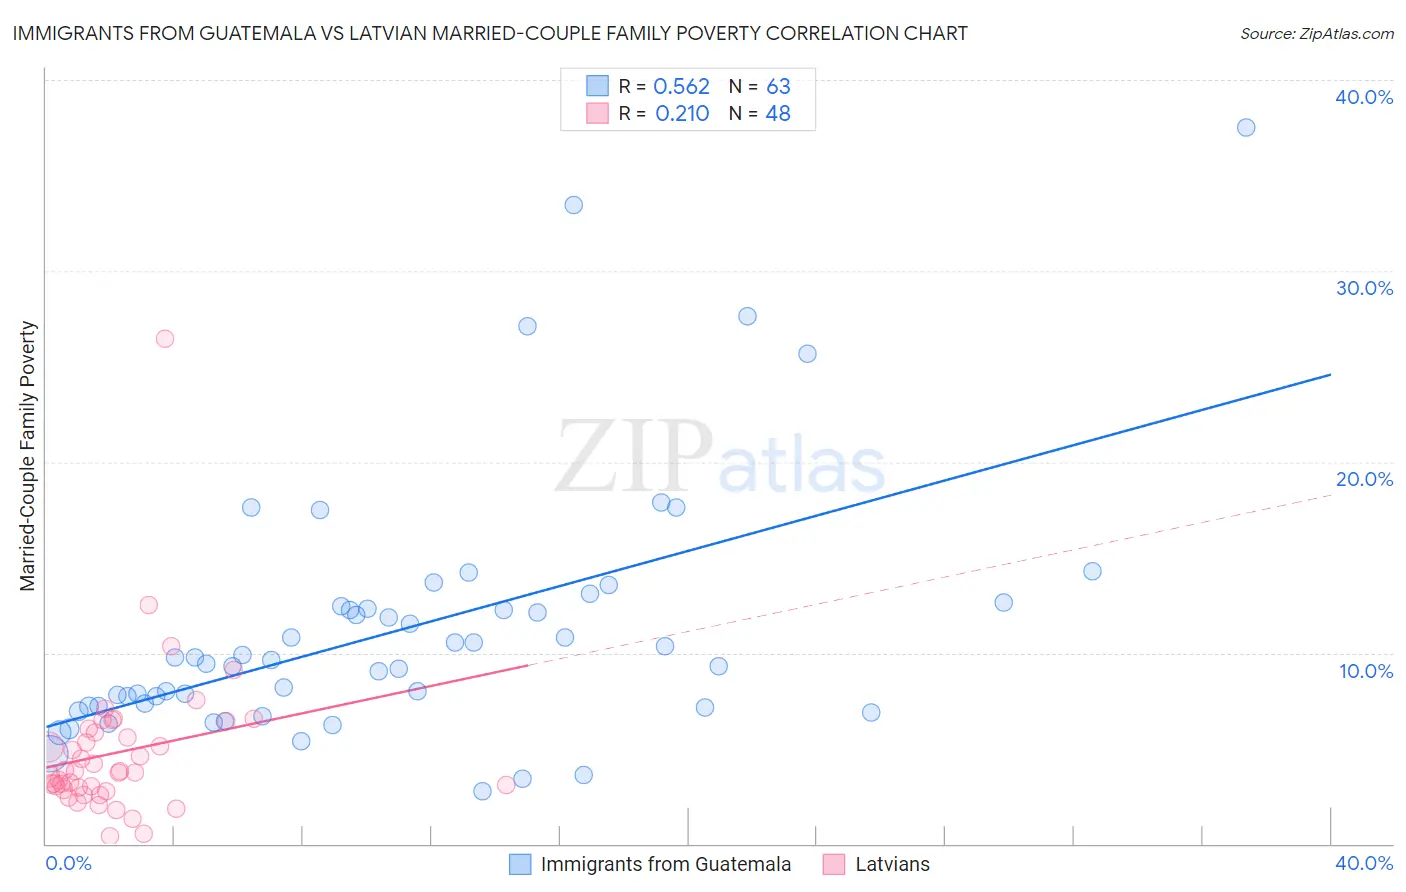
Immigrants from Guatemala vs Latvian Married-Couple Family Poverty Correlation Chart
The statistical analysis conducted on geographies consisting of 375,097,244 people shows a substantial positive correlation between the proportion of Immigrants from Guatemala and poverty level among married-couple families in the United States with a correlation coefficient (R) of 0.562 and weighted average of 7.2%. Similarly, the statistical analysis conducted on geographies consisting of 219,282,296 people shows a weak positive correlation between the proportion of Latvians and poverty level among married-couple families in the United States with a correlation coefficient (R) of 0.210 and weighted average of 3.9%, a difference of 84.4%.
Married-Couple Family Poverty Correlation Summary
| Measurement | Immigrants from Guatemala | Latvian |
| Minimum | 2.7% | 0.39% |
| Maximum | 37.5% | 26.5% |
| Range | 34.8% | 26.1% |
| Mean | 11.2% | 4.8% |
| Median | 9.6% | 3.8% |
| Interquartile 25% (IQ1) | 7.2% | 2.9% |
| Interquartile 75% (IQ3) | 12.5% | 5.9% |
| Interquartile Range (IQR) | 5.3% | 3.0% |
| Standard Deviation (Sample) | 6.7% | 4.0% |
| Standard Deviation (Population) | 6.6% | 3.9% |
Similar Demographics by Married-Couple Family Poverty
Demographics Similar to Immigrants from Guatemala by Married-Couple Family Poverty
In terms of married-couple family poverty, the demographic groups most similar to Immigrants from Guatemala are Mexican (7.2%, a difference of 0.17%), Immigrants from Latin America (7.2%, a difference of 0.17%), Honduran (7.2%, a difference of 0.48%), Inupiat (7.1%, a difference of 0.63%), and British West Indian (7.1%, a difference of 0.87%).
| Demographics | Rating | Rank | Married-Couple Family Poverty |
| Immigrants | Dominica | 0.0 /100 | #311 | Tragic 7.1% |
| Immigrants | Armenia | 0.0 /100 | #312 | Tragic 7.1% |
| Immigrants | St. Vincent and the Grenadines | 0.0 /100 | #313 | Tragic 7.1% |
| British West Indians | 0.0 /100 | #314 | Tragic 7.1% |
| Inupiat | 0.0 /100 | #315 | Tragic 7.1% |
| Hondurans | 0.0 /100 | #316 | Tragic 7.2% |
| Mexicans | 0.0 /100 | #317 | Tragic 7.2% |
| Immigrants | Guatemala | 0.0 /100 | #318 | Tragic 7.2% |
| Immigrants | Latin America | 0.0 /100 | #319 | Tragic 7.2% |
| Immigrants | Grenada | 0.0 /100 | #320 | Tragic 7.3% |
| Immigrants | Caribbean | 0.0 /100 | #321 | Tragic 7.3% |
| Immigrants | Honduras | 0.0 /100 | #322 | Tragic 7.3% |
| Vietnamese | 0.0 /100 | #323 | Tragic 7.4% |
| Immigrants | Central America | 0.0 /100 | #324 | Tragic 7.4% |
| Immigrants | Cuba | 0.0 /100 | #325 | Tragic 7.5% |
Demographics Similar to Latvians by Married-Couple Family Poverty
In terms of married-couple family poverty, the demographic groups most similar to Latvians are Luxembourger (3.9%, a difference of 0.52%), Thai (3.9%, a difference of 0.54%), Croatian (3.9%, a difference of 0.98%), Carpatho Rusyn (3.9%, a difference of 1.0%), and Swedish (3.9%, a difference of 1.1%).
| Demographics | Rating | Rank | Married-Couple Family Poverty |
| Immigrants | India | 100.0 /100 | #1 | Exceptional 3.6% |
| Chinese | 100.0 /100 | #2 | Exceptional 3.6% |
| Norwegians | 100.0 /100 | #3 | Exceptional 3.7% |
| Slovenes | 100.0 /100 | #4 | Exceptional 3.8% |
| Swedes | 100.0 /100 | #5 | Exceptional 3.9% |
| Luxembourgers | 100.0 /100 | #6 | Exceptional 3.9% |
| Latvians | 100.0 /100 | #7 | Exceptional 3.9% |
| Thais | 100.0 /100 | #8 | Exceptional 3.9% |
| Croatians | 100.0 /100 | #9 | Exceptional 3.9% |
| Carpatho Rusyns | 100.0 /100 | #10 | Exceptional 3.9% |
| Lithuanians | 100.0 /100 | #11 | Exceptional 4.0% |
| Bulgarians | 100.0 /100 | #12 | Exceptional 4.0% |
| Czechs | 100.0 /100 | #13 | Exceptional 4.0% |
| Slovaks | 100.0 /100 | #14 | Exceptional 4.0% |
| Poles | 100.0 /100 | #15 | Exceptional 4.0% |