Immigrants from Guatemala vs Vietnamese Married-Couple Family Poverty

COMPARE

Immigrants from Guatemala
Race
Ancestry
AfghanAfricanAlaska NativeAlaskan AthabascanAlbanianAleutAlsatianAmericanApacheArabArapahoArgentineanArmenianAssyrian/Chaldean/SyriacAustralianAustrianBahamianBangladeshiBarbadianBasqueBelgianBelizeanBermudanBhutaneseBlackfeetBolivianBrazilianBritishBritish West IndianBulgarianBurmeseCajunCambodianCanadianCape VerdeanCarpatho RusynCelticCentral AmericanCentral American IndianCherokeeCheyenneChickasawChileanChineseChippewaChoctawColombianColvilleComancheCosta RicanCreeCreekCroatianCrowCubanCypriotCzechCzechoslovakianDanishDelawareDominicanDutchDutch West IndianEastern EuropeanEcuadorianEgyptianEnglishEstonianEthiopianEuropeanFijianFilipinoFinnishFrenchFrench American IndianFrench CanadianGermanGerman RussianGhanaianGreekGuamanian/ChamorroGuatemalanGuyaneseHaitianHmongHonduranHopiHoumaHungarianIcelanderIndian (Asian)IndonesianInupiatIranianIraqiIrishIroquoisIsraeliItalianJamaicanJapaneseJordanianKenyanKiowaKoreanLaotianLatvianLebaneseLiberianLithuanianLumbeeLuxembourgerMacedonianMalaysianMalteseMarshalleseMenomineeMexicanMexican American IndianMongolianMoroccanNative HawaiianNavajoNepaleseNew ZealanderNicaraguanNigerianNorthern EuropeanNorwegianOkinawanOsageOttawaPaiutePakistaniPalestinianPanamanianParaguayanPennsylvania GermanPeruvianPimaPolishPortuguesePotawatomiPuebloPuerto RicanPuget Sound SalishRomanianRussianSalvadoranSamoanScandinavianScotch-IrishScottishSeminoleSenegaleseSerbianShoshoneSierra LeoneanSiouxSlavicSlovakSloveneSomaliSouth AfricanSouth AmericanSouth American IndianSoviet UnionSpaniardSpanishSpanish AmericanSpanish American IndianSri LankanSubsaharan AfricanSudaneseSwedishSwissSyrianTaiwaneseThaiTlingit-HaidaTohono O'OdhamTonganTrinidadian and TobagonianTsimshianTurkishU.S. Virgin IslanderUgandanUkrainianUruguayanUteVenezuelanWelshWest IndianYakamaYaquiYugoslavianYumanYup'ikZimbabwean
Immigration
NonimmigrantsImmigrantsAfghanistanAfricaAlbaniaArgentinaArmeniaAsiaAustraliaAustriaBahamasBangladeshBarbadosBelarusBelgiumBelizeBoliviaBosnia and HerzegovinaBrazilBulgariaBurma/MyanmarCabo VerdeCambodiaCameroonCanadaCaribbeanCentral AmericaChileChinaColombiaCongoCosta RicaCroatiaCubaCzechoslovakiaDenmarkDominicaDominican RepublicEastern AfricaEastern AsiaEastern EuropeEcuadorEgyptEl SalvadorEnglandEritreaEthiopiaEuropeFijiFranceGermanyGhanaGreeceGrenadaGuatemalaGuyanaHaitiHondurasHong KongHungaryIndiaIndonesiaIranIraqIrelandIsraelItalyJamaicaJapanJordanKazakhstanKenyaKoreaKuwaitLaosLatin AmericaLatviaLebanonLiberiaLithuaniaMalaysiaMexicoMicronesiaMiddle AfricaMoldovaMoroccoNepalNetherlandsNicaraguaNigeriaNorth AmericaNorth MacedoniaNorthern AfricaNorthern EuropeNorwayOceaniaPakistanPanamaPeruPhilippinesPolandPortugalRomaniaRussiaSaudi ArabiaScotlandSenegalSerbiaSierra LeoneSingaporeSomaliaSouth AfricaSouth AmericaSouth Central AsiaSouth Eastern AsiaSouthern EuropeSpainSri LankaSt. Vincent and the GrenadinesSudanSwedenSwitzerlandSyriaTaiwanThailandTrinidad and TobagoTurkeyUgandaUkraineUruguayUzbekistanVenezuelaVietnamWest IndiesWestern AfricaWestern AsiaWestern EuropeYemenZaireZimbabweAzores
Vietnamese
Race
Ancestry
AfghanAfricanAlaska NativeAlaskan AthabascanAlbanianAleutAlsatianAmericanApacheArabArapahoArgentineanArmenianAssyrian/Chaldean/SyriacAustralianAustrianBahamianBangladeshiBarbadianBasqueBelgianBelizeanBermudanBhutaneseBlackfeetBolivianBrazilianBritishBritish West IndianBulgarianBurmeseCajunCambodianCanadianCape VerdeanCarpatho RusynCelticCentral AmericanCentral American IndianCherokeeCheyenneChickasawChileanChineseChippewaChoctawColombianColvilleComancheCosta RicanCreeCreekCroatianCrowCubanCypriotCzechCzechoslovakianDanishDelawareDominicanDutchDutch West IndianEastern EuropeanEcuadorianEgyptianEnglishEstonianEthiopianEuropeanFijianFilipinoFinnishFrenchFrench American IndianFrench CanadianGermanGerman RussianGhanaianGreekGuamanian/ChamorroGuatemalanGuyaneseHaitianHmongHonduranHopiHoumaHungarianIcelanderIndian (Asian)IndonesianInupiatIranianIraqiIrishIroquoisIsraeliItalianJamaicanJapaneseJordanianKenyanKiowaKoreanLaotianLatvianLebaneseLiberianLithuanianLumbeeLuxembourgerMacedonianMalaysianMalteseMarshalleseMenomineeMexicanMexican American IndianMongolianMoroccanNative HawaiianNavajoNepaleseNew ZealanderNicaraguanNigerianNorthern EuropeanNorwegianOkinawanOsageOttawaPaiutePakistaniPalestinianPanamanianParaguayanPennsylvania GermanPeruvianPimaPolishPortuguesePotawatomiPuebloPuerto RicanPuget Sound SalishRomanianRussianSalvadoranSamoanScandinavianScotch-IrishScottishSeminoleSenegaleseSerbianShoshoneSierra LeoneanSiouxSlavicSlovakSloveneSomaliSouth AfricanSouth AmericanSouth American IndianSoviet UnionSpaniardSpanishSpanish AmericanSpanish American IndianSri LankanSubsaharan AfricanSudaneseSwedishSwissSyrianTaiwaneseThaiTlingit-HaidaTohono O'OdhamTonganTrinidadian and TobagonianTsimshianTurkishU.S. Virgin IslanderUgandanUkrainianUruguayanUteVenezuelanVietnameseWelshWest IndianYakamaYaquiYugoslavianYumanYup'ikZimbabwean
Immigration
NonimmigrantsImmigrantsAfghanistanAfricaAlbaniaArgentinaArmeniaAsiaAustraliaAustriaBahamasBangladeshBarbadosBelarusBelgiumBelizeBoliviaBosnia and HerzegovinaBrazilBulgariaBurma/MyanmarCabo VerdeCambodiaCameroonCanadaCaribbeanCentral AmericaChileChinaColombiaCongoCosta RicaCroatiaCubaCzechoslovakiaDenmarkDominicaDominican RepublicEastern AfricaEastern AsiaEastern EuropeEcuadorEgyptEl SalvadorEnglandEritreaEthiopiaEuropeFijiFranceGermanyGhanaGreeceGrenadaGuyanaHaitiHondurasHong KongHungaryIndiaIndonesiaIranIraqIrelandIsraelItalyJamaicaJapanJordanKazakhstanKenyaKoreaKuwaitLaosLatin AmericaLatviaLebanonLiberiaLithuaniaMalaysiaMexicoMicronesiaMiddle AfricaMoldovaMoroccoNepalNetherlandsNicaraguaNigeriaNorth AmericaNorth MacedoniaNorthern AfricaNorthern EuropeNorwayOceaniaPakistanPanamaPeruPhilippinesPolandPortugalRomaniaRussiaSaudi ArabiaScotlandSenegalSerbiaSierra LeoneSingaporeSomaliaSouth AfricaSouth AmericaSouth Central AsiaSouth Eastern AsiaSouthern EuropeSpainSri LankaSt. Vincent and the GrenadinesSudanSwedenSwitzerlandSyriaTaiwanThailandTrinidad and TobagoTurkeyUgandaUkraineUruguayUzbekistanVenezuelaVietnamWest IndiesWestern AfricaWestern AsiaWestern EuropeYemenZaireZimbabweAzores
Married-Couple Family Poverty
Income
Poverty
Unemployment
Labor Participation
Family Structure
Vehicle Availability
Education Level
Disability

Married-Couple Family Poverty Comparison

Immigrants from Guatemala

Vietnamese

Tragic
Tragic
7.2%
MARRIED-COUPLE FAMILY POVERTY
0.0/ 100
METRIC RATING
318th/ 347
METRIC RANK
7.4%
MARRIED-COUPLE FAMILY POVERTY
0.0/ 100
METRIC RATING
323rd/ 347
METRIC RANK

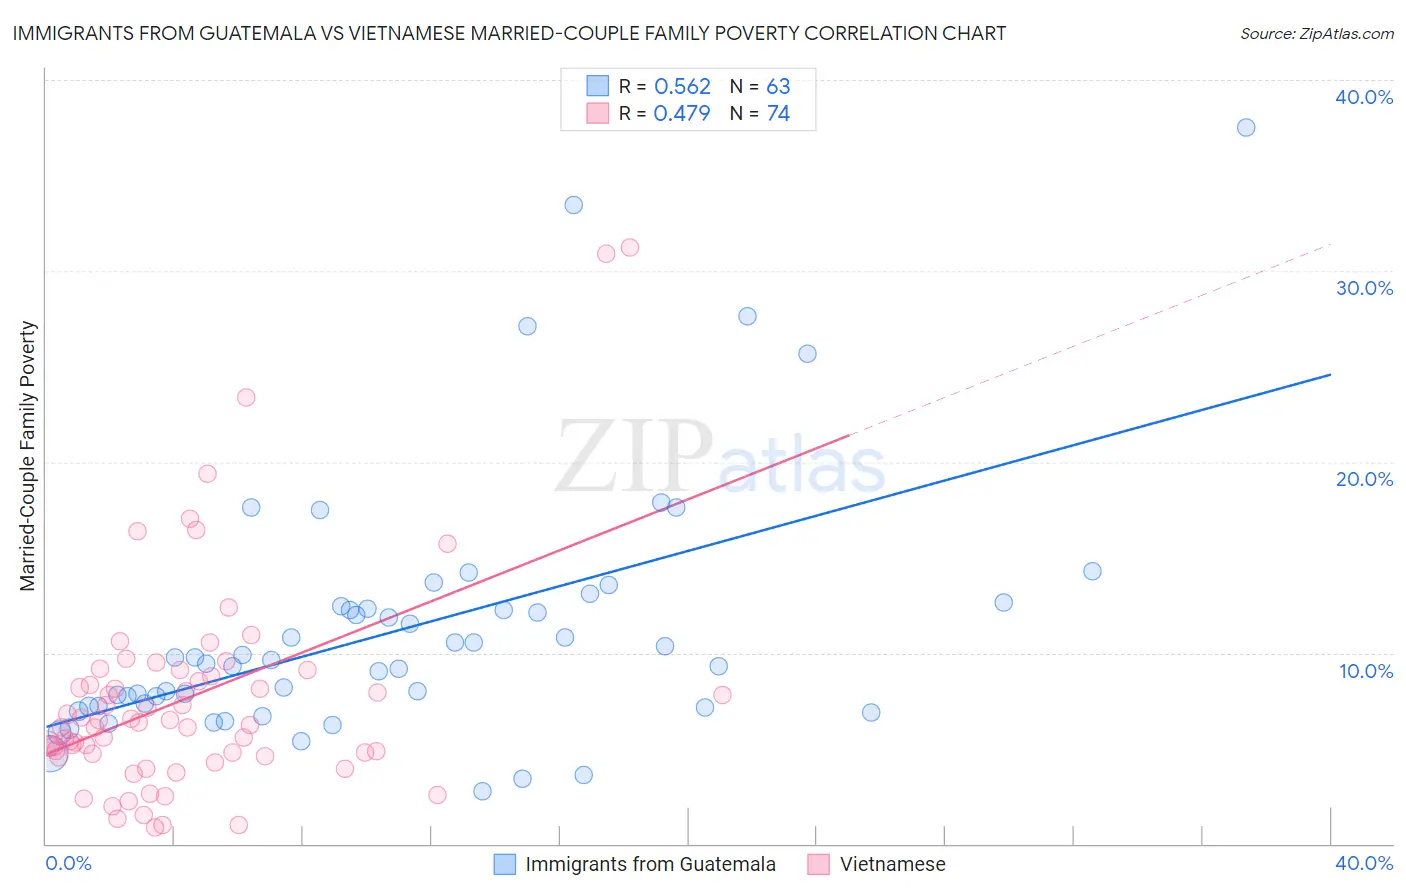
Immigrants from Guatemala vs Vietnamese Married-Couple Family Poverty Correlation Chart

The statistical analysis conducted on geographies consisting of 375,097,244 people shows a substantial positive correlation between the proportion of Immigrants from Guatemala and poverty level among married-couple families in the United States with a correlation coefficient (R) of 0.562 and weighted average of 7.2%. Similarly, the statistical analysis conducted on geographies consisting of 170,138,931 people shows a moderate positive correlation between the proportion of Vietnamese and poverty level among married-couple families in the United States with a correlation coefficient (R) of 0.479 and weighted average of 7.4%, a difference of 3.3%.
Immigrants from Guatemala vs Vietnamese Married-Couple Family Poverty

Married-Couple Family Poverty Correlation Summary

MeasurementImmigrants from GuatemalaVietnamese
Minimum2.7%0.87%
Maximum37.5%31.2%
Range34.8%30.4%
Mean11.2%7.6%
Median9.6%6.3%
Interquartile 25% (IQ1)7.2%4.7%
Interquartile 75% (IQ3)12.5%8.8%
Interquartile Range (IQR)5.3%4.1%
Standard Deviation (Sample)6.7%5.8%
Standard Deviation (Population)6.6%5.7%

Demographics Similar to Immigrants from Guatemala and Vietnamese by Married-Couple Family Poverty

In terms of married-couple family poverty, the demographic groups most similar to Immigrants from Guatemala are Mexican (7.2%, a difference of 0.17%), Immigrants from Latin America (7.2%, a difference of 0.17%), Honduran (7.2%, a difference of 0.48%), Inupiat (7.1%, a difference of 0.63%), and British West Indian (7.1%, a difference of 0.87%). Similarly, the demographic groups most similar to Vietnamese are Immigrants from Central America (7.4%, a difference of 0.090%), Immigrants from Cuba (7.5%, a difference of 0.63%), Immigrants from Bangladesh (7.5%, a difference of 0.82%), Hispanic or Latino (7.5%, a difference of 0.82%), and Immigrants from Honduras (7.3%, a difference of 1.1%).
DemographicsRating | RankMarried-Couple Family Poverty
Immigrants | Nicaragua
0.0
/100
|
#310
Tragic
7.1%
Immigrants | Dominica
0.0
/100
|
#311
Tragic
7.1%
Immigrants | Armenia
0.0
/100
|
#312
Tragic
7.1%
Immigrants | St. Vincent and the Grenadines
0.0
/100
|
#313
Tragic
7.1%
British West Indians
0.0
/100
|
#314
Tragic
7.1%
Inupiat
0.0
/100
|
#315
Tragic
7.1%
Hondurans
0.0
/100
|
#316
Tragic
7.2%
Mexicans
0.0
/100
|
#317
Tragic
7.2%
Immigrants | Guatemala
0.0
/100
|
#318
Tragic
7.2%
Immigrants | Latin America
0.0
/100
|
#319
Tragic
7.2%
Immigrants | Grenada
0.0
/100
|
#320
Tragic
7.3%
Immigrants | Caribbean
0.0
/100
|
#321
Tragic
7.3%
Immigrants | Honduras
0.0
/100
|
#322
Tragic
7.3%
Vietnamese
0.0
/100
|
#323
Tragic
7.4%
Immigrants | Central America
0.0
/100
|
#324
Tragic
7.4%
Immigrants | Cuba
0.0
/100
|
#325
Tragic
7.5%
Immigrants | Bangladesh
0.0
/100
|
#326
Tragic
7.5%
Hispanics or Latinos
0.0
/100
|
#327
Tragic
7.5%
Immigrants | Mexico
0.0
/100
|
#328
Tragic
7.6%
Natives/Alaskans
0.0
/100
|
#329
Tragic
8.2%
Paiute
0.0
/100
|
#330
Tragic
8.3%