Immigrants from China vs Kiowa Married-Couple Family Poverty
COMPARE
Immigrants from China
Kiowa
Married-Couple Family Poverty
Married-Couple Family Poverty Comparison
Immigrants from China
Kiowa
5.0%
MARRIED-COUPLE FAMILY POVERTY
84.6/ 100
METRIC RATING
142nd/ 347
METRIC RANK
6.6%
MARRIED-COUPLE FAMILY POVERTY
0.0/ 100
METRIC RATING
297th/ 347
METRIC RANK
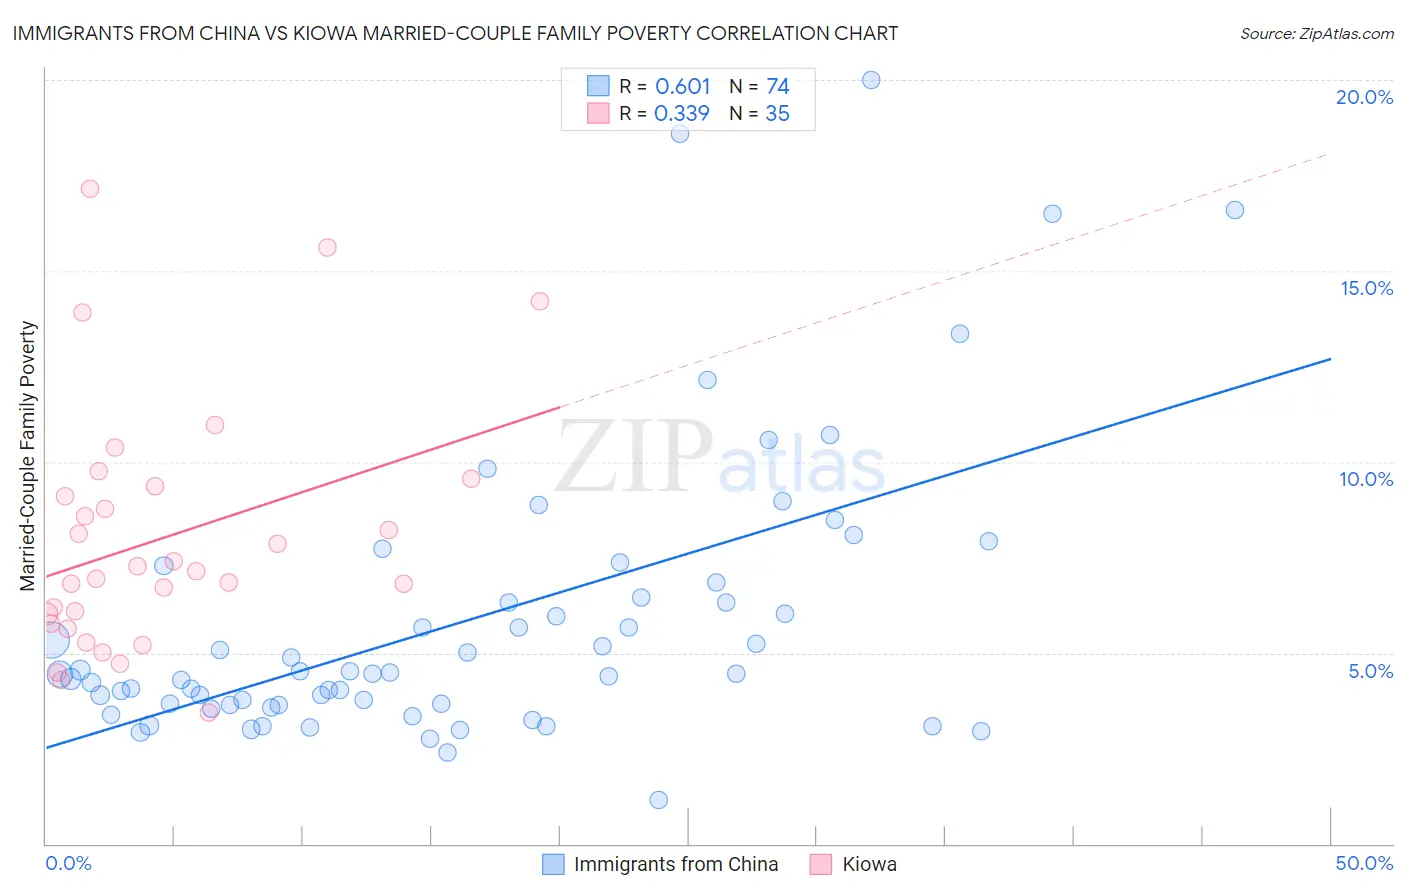
Immigrants from China vs Kiowa Married-Couple Family Poverty Correlation Chart
The statistical analysis conducted on geographies consisting of 451,197,331 people shows a significant positive correlation between the proportion of Immigrants from China and poverty level among married-couple families in the United States with a correlation coefficient (R) of 0.601 and weighted average of 5.0%. Similarly, the statistical analysis conducted on geographies consisting of 56,003,088 people shows a mild positive correlation between the proportion of Kiowa and poverty level among married-couple families in the United States with a correlation coefficient (R) of 0.339 and weighted average of 6.6%, a difference of 34.1%.
Married-Couple Family Poverty Correlation Summary
| Measurement | Immigrants from China | Kiowa |
| Minimum | 1.1% | 3.4% |
| Maximum | 20.0% | 17.1% |
| Range | 18.9% | 13.7% |
| Mean | 5.8% | 8.0% |
| Median | 4.5% | 7.1% |
| Interquartile 25% (IQ1) | 3.6% | 5.8% |
| Interquartile 75% (IQ3) | 6.5% | 9.4% |
| Interquartile Range (IQR) | 2.8% | 3.6% |
| Standard Deviation (Sample) | 3.7% | 3.2% |
| Standard Deviation (Population) | 3.7% | 3.2% |
Similar Demographics by Married-Couple Family Poverty
Demographics Similar to Immigrants from China by Married-Couple Family Poverty
In terms of married-couple family poverty, the demographic groups most similar to Immigrants from China are Immigrants from Brazil (5.0%, a difference of 0.0%), Immigrants from Portugal (5.0%, a difference of 0.050%), German Russian (5.0%, a difference of 0.11%), Immigrants from Egypt (5.0%, a difference of 0.27%), and Hmong (5.0%, a difference of 0.32%).
| Demographics | Rating | Rank | Married-Couple Family Poverty |
| Assyrians/Chaldeans/Syriacs | 89.4 /100 | #135 | Excellent 4.9% |
| Immigrants | Hungary | 88.7 /100 | #136 | Excellent 4.9% |
| Guamanians/Chamorros | 86.5 /100 | #137 | Excellent 4.9% |
| Chileans | 86.0 /100 | #138 | Excellent 4.9% |
| German Russians | 85.1 /100 | #139 | Excellent 5.0% |
| Immigrants | Portugal | 84.8 /100 | #140 | Excellent 5.0% |
| Immigrants | Brazil | 84.6 /100 | #141 | Excellent 5.0% |
| Immigrants | China | 84.6 /100 | #142 | Excellent 5.0% |
| Immigrants | Egypt | 83.4 /100 | #143 | Excellent 5.0% |
| Hmong | 83.2 /100 | #144 | Excellent 5.0% |
| Immigrants | Spain | 79.9 /100 | #145 | Good 5.0% |
| Mongolians | 79.8 /100 | #146 | Good 5.0% |
| Syrians | 78.7 /100 | #147 | Good 5.0% |
| Immigrants | Russia | 78.7 /100 | #148 | Good 5.0% |
| Immigrants | Oceania | 78.6 /100 | #149 | Good 5.0% |
Demographics Similar to Kiowa by Married-Couple Family Poverty
In terms of married-couple family poverty, the demographic groups most similar to Kiowa are U.S. Virgin Islander (6.6%, a difference of 0.010%), Immigrants from Guyana (6.7%, a difference of 0.070%), Immigrants from Uzbekistan (6.6%, a difference of 0.11%), Bahamian (6.6%, a difference of 0.40%), and Nicaraguan (6.7%, a difference of 0.61%).
| Demographics | Rating | Rank | Married-Couple Family Poverty |
| Immigrants | Barbados | 0.0 /100 | #290 | Tragic 6.5% |
| Belizeans | 0.0 /100 | #291 | Tragic 6.5% |
| Immigrants | Lebanon | 0.0 /100 | #292 | Tragic 6.6% |
| Arapaho | 0.0 /100 | #293 | Tragic 6.6% |
| Bahamians | 0.0 /100 | #294 | Tragic 6.6% |
| Immigrants | Uzbekistan | 0.0 /100 | #295 | Tragic 6.6% |
| U.S. Virgin Islanders | 0.0 /100 | #296 | Tragic 6.6% |
| Kiowa | 0.0 /100 | #297 | Tragic 6.6% |
| Immigrants | Guyana | 0.0 /100 | #298 | Tragic 6.7% |
| Nicaraguans | 0.0 /100 | #299 | Tragic 6.7% |
| Immigrants | Belize | 0.0 /100 | #300 | Tragic 6.7% |
| Central Americans | 0.0 /100 | #301 | Tragic 6.7% |
| Immigrants | Ecuador | 0.0 /100 | #302 | Tragic 6.7% |
| Immigrants | El Salvador | 0.0 /100 | #303 | Tragic 6.8% |
| Cubans | 0.0 /100 | #304 | Tragic 6.8% |