Ethiopian vs Tsimshian Married-Couple Family Poverty
COMPARE
Ethiopian
Tsimshian
Married-Couple Family Poverty
Married-Couple Family Poverty Comparison
Ethiopians
Tsimshian
5.1%
MARRIED-COUPLE FAMILY POVERTY
68.1/ 100
METRIC RATING
161st/ 347
METRIC RANK
5.9%
MARRIED-COUPLE FAMILY POVERTY
1.1/ 100
METRIC RATING
249th/ 347
METRIC RANK
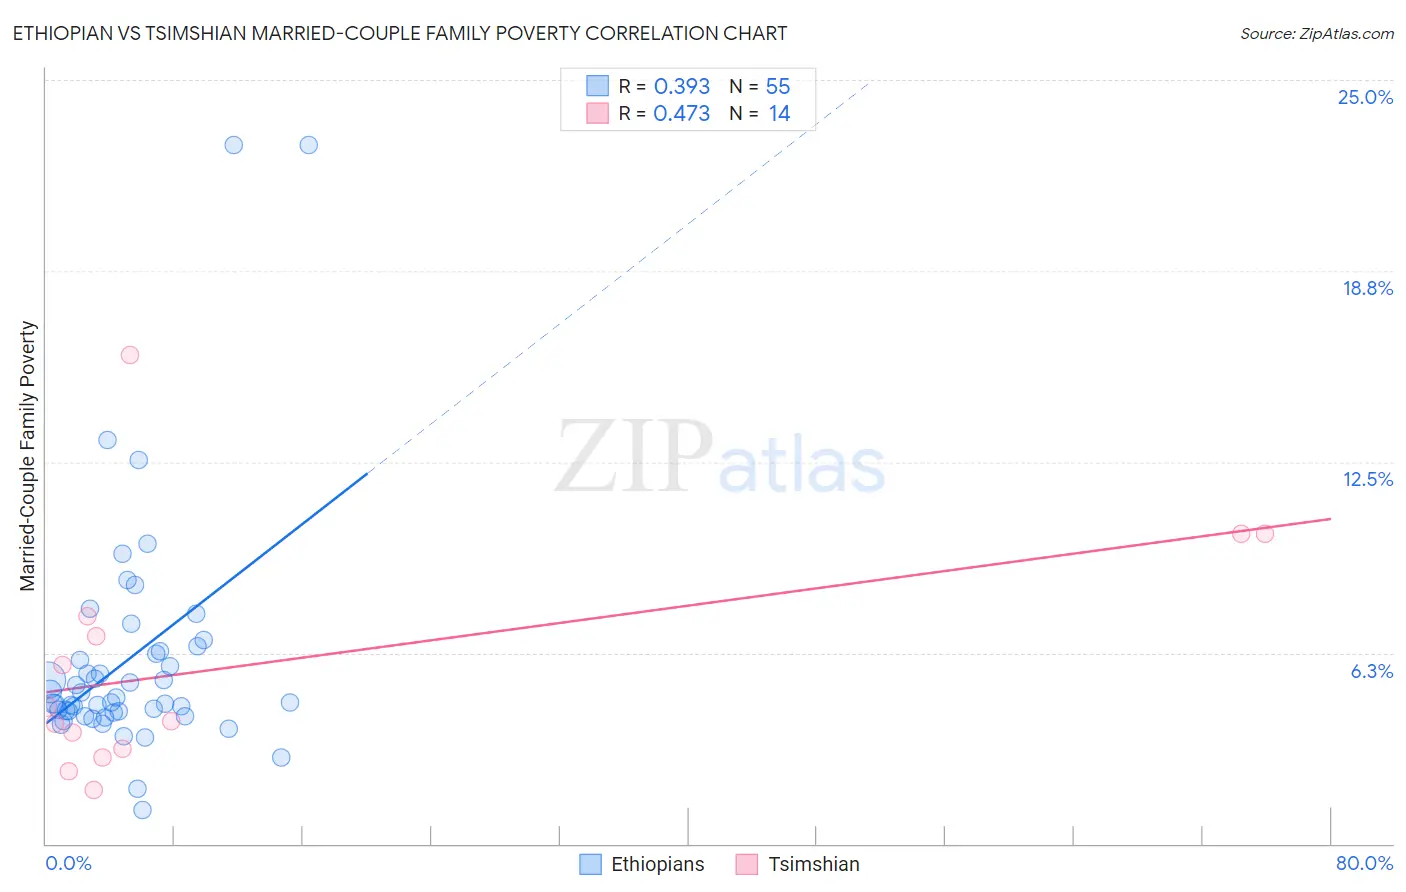
Ethiopian vs Tsimshian Married-Couple Family Poverty Correlation Chart
The statistical analysis conducted on geographies consisting of 222,211,608 people shows a mild positive correlation between the proportion of Ethiopians and poverty level among married-couple families in the United States with a correlation coefficient (R) of 0.393 and weighted average of 5.1%. Similarly, the statistical analysis conducted on geographies consisting of 15,607,762 people shows a moderate positive correlation between the proportion of Tsimshian and poverty level among married-couple families in the United States with a correlation coefficient (R) of 0.473 and weighted average of 5.9%, a difference of 15.5%.
Married-Couple Family Poverty Correlation Summary
| Measurement | Ethiopian | Tsimshian |
| Minimum | 1.1% | 1.8% |
| Maximum | 22.9% | 16.0% |
| Range | 21.8% | 14.2% |
| Mean | 6.0% | 5.9% |
| Median | 4.6% | 4.2% |
| Interquartile 25% (IQ1) | 4.3% | 3.1% |
| Interquartile 75% (IQ3) | 6.3% | 7.5% |
| Interquartile Range (IQR) | 2.0% | 4.4% |
| Standard Deviation (Sample) | 4.0% | 3.9% |
| Standard Deviation (Population) | 3.9% | 3.8% |
Similar Demographics by Married-Couple Family Poverty
Demographics Similar to Ethiopians by Married-Couple Family Poverty
In terms of married-couple family poverty, the demographic groups most similar to Ethiopians are Pennsylvania German (5.1%, a difference of 0.060%), Immigrants from Jordan (5.1%, a difference of 0.22%), Immigrants from South Eastern Asia (5.1%, a difference of 0.31%), Immigrants from Saudi Arabia (5.1%, a difference of 0.31%), and Argentinean (5.1%, a difference of 0.36%).
| Demographics | Rating | Rank | Married-Couple Family Poverty |
| Delaware | 73.7 /100 | #154 | Good 5.1% |
| Immigrants | Ethiopia | 72.4 /100 | #155 | Good 5.1% |
| Sri Lankans | 72.2 /100 | #156 | Good 5.1% |
| Argentineans | 70.7 /100 | #157 | Good 5.1% |
| Immigrants | South Eastern Asia | 70.4 /100 | #158 | Good 5.1% |
| Immigrants | Saudi Arabia | 70.3 /100 | #159 | Good 5.1% |
| Pennsylvania Germans | 68.5 /100 | #160 | Good 5.1% |
| Ethiopians | 68.1 /100 | #161 | Good 5.1% |
| Immigrants | Jordan | 66.5 /100 | #162 | Good 5.1% |
| Sierra Leoneans | 64.1 /100 | #163 | Good 5.1% |
| Hawaiians | 62.3 /100 | #164 | Good 5.1% |
| Immigrants | Malaysia | 62.2 /100 | #165 | Good 5.1% |
| Paraguayans | 61.5 /100 | #166 | Good 5.1% |
| Costa Ricans | 61.5 /100 | #167 | Good 5.1% |
| Immigrants | Uganda | 54.9 /100 | #168 | Average 5.2% |
Demographics Similar to Tsimshian by Married-Couple Family Poverty
In terms of married-couple family poverty, the demographic groups most similar to Tsimshian are Cree (5.9%, a difference of 0.10%), Immigrants from Eritrea (5.9%, a difference of 0.21%), Immigrants from Ghana (5.9%, a difference of 0.46%), Iraqi (5.9%, a difference of 0.52%), and Immigrants from Western Asia (6.0%, a difference of 1.1%).
| Demographics | Rating | Rank | Married-Couple Family Poverty |
| Immigrants | Western Africa | 2.4 /100 | #242 | Tragic 5.8% |
| Somalis | 2.3 /100 | #243 | Tragic 5.8% |
| Chickasaw | 2.3 /100 | #244 | Tragic 5.8% |
| Immigrants | Afghanistan | 2.1 /100 | #245 | Tragic 5.8% |
| Immigrants | Venezuela | 1.8 /100 | #246 | Tragic 5.8% |
| Iraqis | 1.4 /100 | #247 | Tragic 5.9% |
| Cree | 1.2 /100 | #248 | Tragic 5.9% |
| Tsimshian | 1.1 /100 | #249 | Tragic 5.9% |
| Immigrants | Eritrea | 1.1 /100 | #250 | Tragic 5.9% |
| Immigrants | Ghana | 1.0 /100 | #251 | Tragic 5.9% |
| Immigrants | Western Asia | 0.7 /100 | #252 | Tragic 6.0% |
| Africans | 0.7 /100 | #253 | Tragic 6.0% |
| Immigrants | Somalia | 0.7 /100 | #254 | Tragic 6.0% |
| Comanche | 0.7 /100 | #255 | Tragic 6.0% |
| Bangladeshis | 0.5 /100 | #256 | Tragic 6.0% |