Immigrants from Scotland vs Tsimshian Married-Couple Family Poverty
COMPARE
Immigrants from Scotland
Tsimshian
Married-Couple Family Poverty
Married-Couple Family Poverty Comparison
Immigrants from Scotland
Tsimshian
4.2%
MARRIED-COUPLE FAMILY POVERTY
99.9/ 100
METRIC RATING
29th/ 347
METRIC RANK
5.9%
MARRIED-COUPLE FAMILY POVERTY
1.1/ 100
METRIC RATING
249th/ 347
METRIC RANK
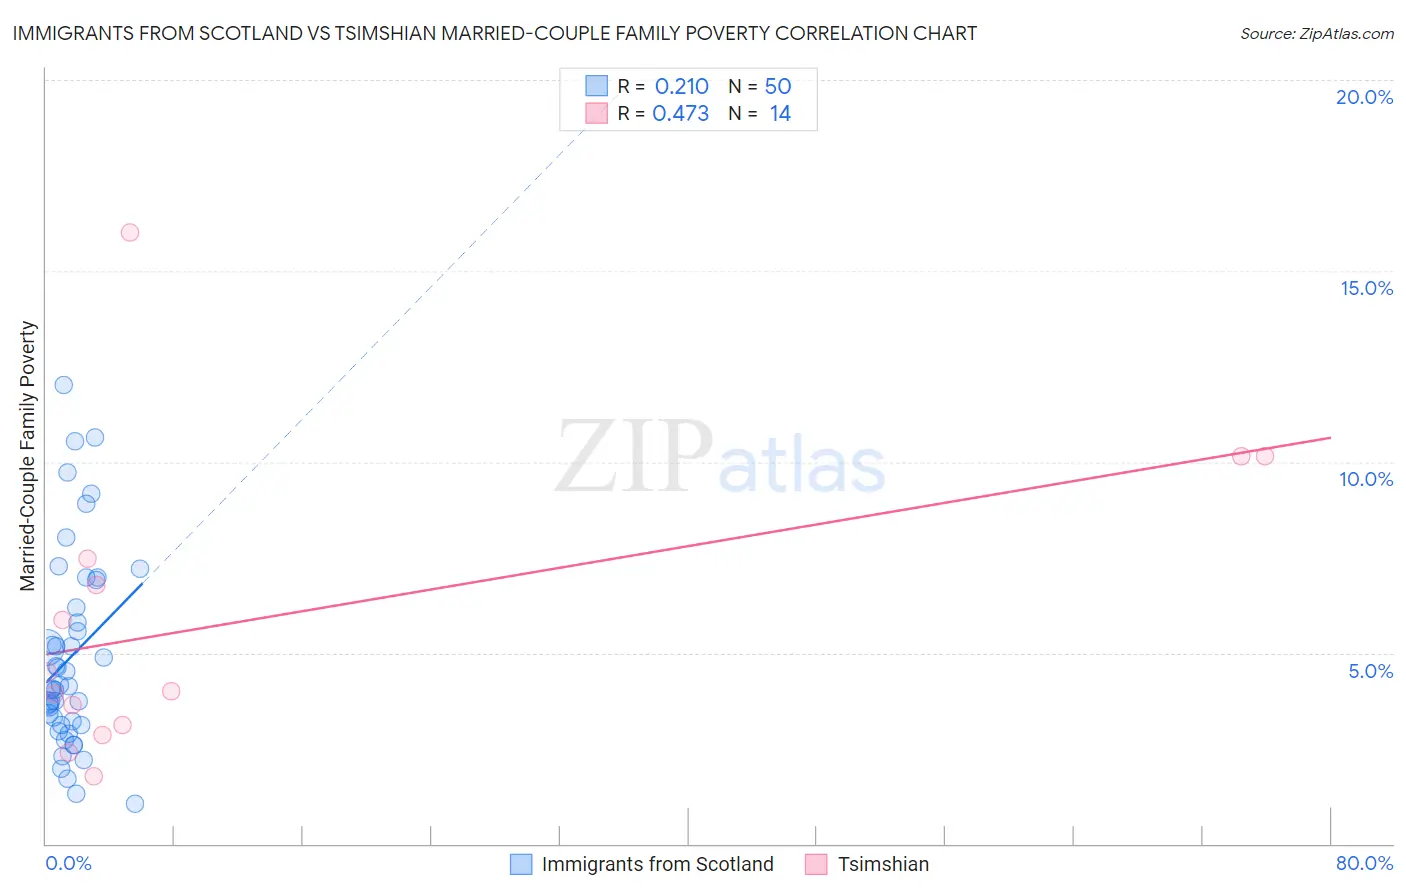
Immigrants from Scotland vs Tsimshian Married-Couple Family Poverty Correlation Chart
The statistical analysis conducted on geographies consisting of 195,462,038 people shows a weak positive correlation between the proportion of Immigrants from Scotland and poverty level among married-couple families in the United States with a correlation coefficient (R) of 0.210 and weighted average of 4.2%. Similarly, the statistical analysis conducted on geographies consisting of 15,607,762 people shows a moderate positive correlation between the proportion of Tsimshian and poverty level among married-couple families in the United States with a correlation coefficient (R) of 0.473 and weighted average of 5.9%, a difference of 42.0%.
Married-Couple Family Poverty Correlation Summary
| Measurement | Immigrants from Scotland | Tsimshian |
| Minimum | 1.1% | 1.8% |
| Maximum | 12.0% | 16.0% |
| Range | 11.0% | 14.2% |
| Mean | 4.9% | 5.9% |
| Median | 4.1% | 4.2% |
| Interquartile 25% (IQ1) | 3.1% | 3.1% |
| Interquartile 75% (IQ3) | 6.2% | 7.5% |
| Interquartile Range (IQR) | 3.1% | 4.4% |
| Standard Deviation (Sample) | 2.6% | 3.9% |
| Standard Deviation (Population) | 2.5% | 3.8% |
Similar Demographics by Married-Couple Family Poverty
Demographics Similar to Immigrants from Scotland by Married-Couple Family Poverty
In terms of married-couple family poverty, the demographic groups most similar to Immigrants from Scotland are Scandinavian (4.1%, a difference of 0.040%), Danish (4.1%, a difference of 0.15%), Finnish (4.2%, a difference of 0.24%), Cypriot (4.1%, a difference of 0.26%), and Estonian (4.2%, a difference of 0.32%).
| Demographics | Rating | Rank | Married-Couple Family Poverty |
| Immigrants | Singapore | 99.9 /100 | #22 | Exceptional 4.1% |
| Bhutanese | 99.9 /100 | #23 | Exceptional 4.1% |
| Eastern Europeans | 99.9 /100 | #24 | Exceptional 4.1% |
| Immigrants | Taiwan | 99.9 /100 | #25 | Exceptional 4.1% |
| Cypriots | 99.9 /100 | #26 | Exceptional 4.1% |
| Danes | 99.9 /100 | #27 | Exceptional 4.1% |
| Scandinavians | 99.9 /100 | #28 | Exceptional 4.1% |
| Immigrants | Scotland | 99.9 /100 | #29 | Exceptional 4.2% |
| Finns | 99.9 /100 | #30 | Exceptional 4.2% |
| Estonians | 99.9 /100 | #31 | Exceptional 4.2% |
| Greeks | 99.9 /100 | #32 | Exceptional 4.2% |
| Irish | 99.9 /100 | #33 | Exceptional 4.2% |
| Dutch | 99.9 /100 | #34 | Exceptional 4.2% |
| Europeans | 99.9 /100 | #35 | Exceptional 4.2% |
| English | 99.9 /100 | #36 | Exceptional 4.2% |
Demographics Similar to Tsimshian by Married-Couple Family Poverty
In terms of married-couple family poverty, the demographic groups most similar to Tsimshian are Cree (5.9%, a difference of 0.10%), Immigrants from Eritrea (5.9%, a difference of 0.21%), Immigrants from Ghana (5.9%, a difference of 0.46%), Iraqi (5.9%, a difference of 0.52%), and Immigrants from Western Asia (6.0%, a difference of 1.1%).
| Demographics | Rating | Rank | Married-Couple Family Poverty |
| Immigrants | Western Africa | 2.4 /100 | #242 | Tragic 5.8% |
| Somalis | 2.3 /100 | #243 | Tragic 5.8% |
| Chickasaw | 2.3 /100 | #244 | Tragic 5.8% |
| Immigrants | Afghanistan | 2.1 /100 | #245 | Tragic 5.8% |
| Immigrants | Venezuela | 1.8 /100 | #246 | Tragic 5.8% |
| Iraqis | 1.4 /100 | #247 | Tragic 5.9% |
| Cree | 1.2 /100 | #248 | Tragic 5.9% |
| Tsimshian | 1.1 /100 | #249 | Tragic 5.9% |
| Immigrants | Eritrea | 1.1 /100 | #250 | Tragic 5.9% |
| Immigrants | Ghana | 1.0 /100 | #251 | Tragic 5.9% |
| Immigrants | Western Asia | 0.7 /100 | #252 | Tragic 6.0% |
| Africans | 0.7 /100 | #253 | Tragic 6.0% |
| Immigrants | Somalia | 0.7 /100 | #254 | Tragic 6.0% |
| Comanche | 0.7 /100 | #255 | Tragic 6.0% |
| Bangladeshis | 0.5 /100 | #256 | Tragic 6.0% |