Apache vs Immigrants from Jamaica Married-Couple Family Poverty
COMPARE
Apache
Immigrants from Jamaica
Married-Couple Family Poverty
Married-Couple Family Poverty Comparison
Apache
Immigrants from Jamaica
9.0%
MARRIED-COUPLE FAMILY POVERTY
0.0/ 100
METRIC RATING
336th/ 347
METRIC RANK
6.2%
MARRIED-COUPLE FAMILY POVERTY
0.1/ 100
METRIC RATING
270th/ 347
METRIC RANK
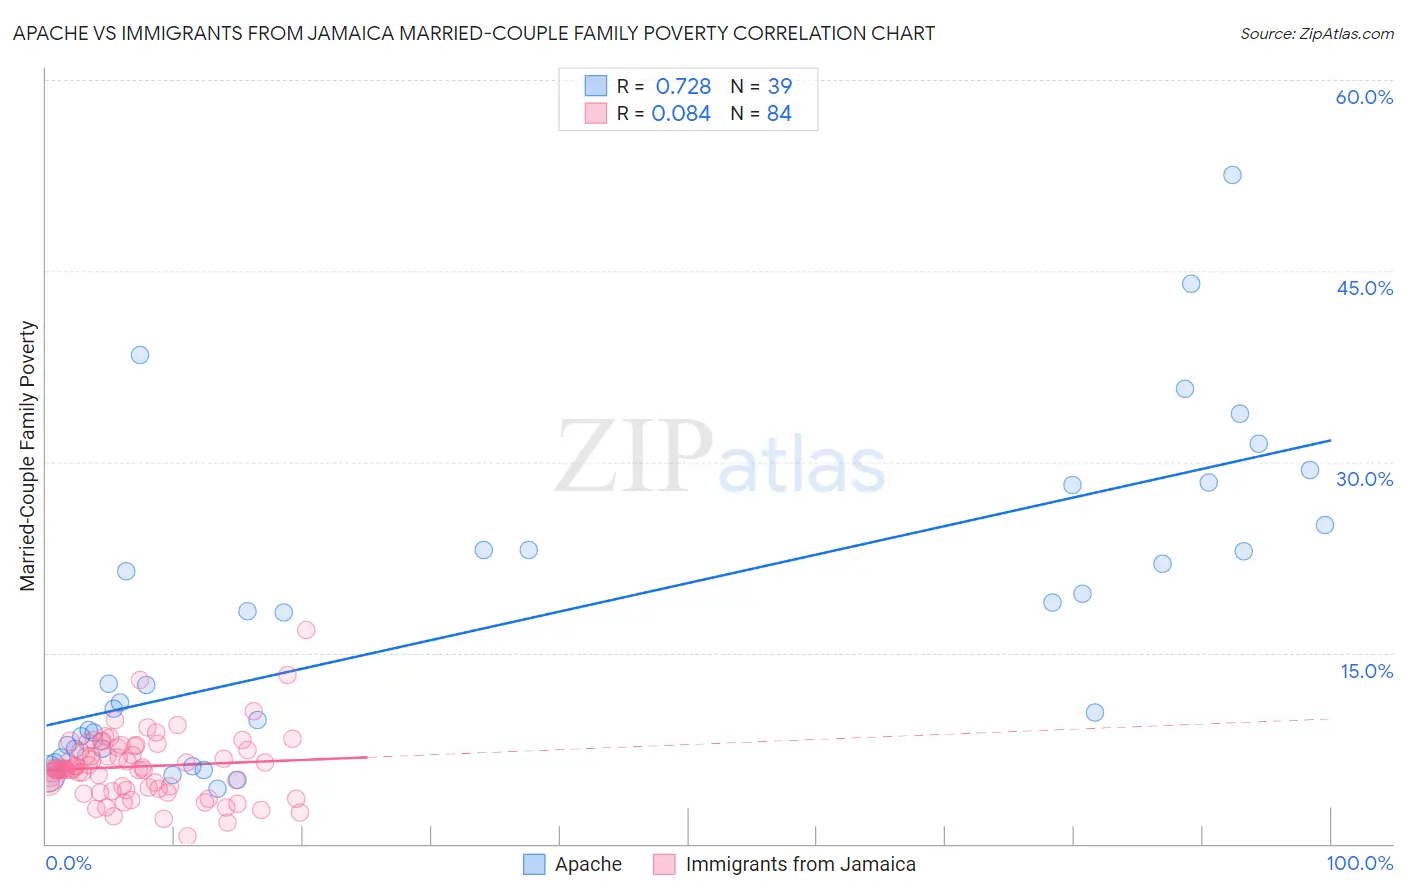
Apache vs Immigrants from Jamaica Married-Couple Family Poverty Correlation Chart
The statistical analysis conducted on geographies consisting of 230,238,952 people shows a strong positive correlation between the proportion of Apache and poverty level among married-couple families in the United States with a correlation coefficient (R) of 0.728 and weighted average of 9.0%. Similarly, the statistical analysis conducted on geographies consisting of 299,624,041 people shows a slight positive correlation between the proportion of Immigrants from Jamaica and poverty level among married-couple families in the United States with a correlation coefficient (R) of 0.084 and weighted average of 6.2%, a difference of 44.0%.
Married-Couple Family Poverty Correlation Summary
| Measurement | Apache | Immigrants from Jamaica |
| Minimum | 4.3% | 0.61% |
| Maximum | 52.5% | 16.8% |
| Range | 48.2% | 16.2% |
| Mean | 17.8% | 6.1% |
| Median | 12.6% | 5.9% |
| Interquartile 25% (IQ1) | 7.5% | 4.4% |
| Interquartile 75% (IQ3) | 25.0% | 7.6% |
| Interquartile Range (IQR) | 17.5% | 3.2% |
| Standard Deviation (Sample) | 12.2% | 2.6% |
| Standard Deviation (Population) | 12.0% | 2.6% |
Similar Demographics by Married-Couple Family Poverty
Demographics Similar to Apache by Married-Couple Family Poverty
In terms of married-couple family poverty, the demographic groups most similar to Apache are Yakama (9.0%, a difference of 0.040%), Sioux (8.7%, a difference of 2.9%), Cheyenne (9.4%, a difference of 5.4%), Immigrants from Dominican Republic (8.4%, a difference of 6.6%), and Crow (9.6%, a difference of 6.8%).
| Demographics | Rating | Rank | Married-Couple Family Poverty |
| Natives/Alaskans | 0.0 /100 | #329 | Tragic 8.2% |
| Paiute | 0.0 /100 | #330 | Tragic 8.3% |
| Central American Indians | 0.0 /100 | #331 | Tragic 8.3% |
| Dominicans | 0.0 /100 | #332 | Tragic 8.3% |
| Lumbee | 0.0 /100 | #333 | Tragic 8.3% |
| Immigrants | Dominican Republic | 0.0 /100 | #334 | Tragic 8.4% |
| Sioux | 0.0 /100 | #335 | Tragic 8.7% |
| Apache | 0.0 /100 | #336 | Tragic 9.0% |
| Yakama | 0.0 /100 | #337 | Tragic 9.0% |
| Cheyenne | 0.0 /100 | #338 | Tragic 9.4% |
| Crow | 0.0 /100 | #339 | Tragic 9.6% |
| Yuman | 0.0 /100 | #340 | Tragic 9.7% |
| Pueblo | 0.0 /100 | #341 | Tragic 11.1% |
| Tohono O'odham | 0.0 /100 | #342 | Tragic 11.2% |
| Pima | 0.0 /100 | #343 | Tragic 11.4% |
Demographics Similar to Immigrants from Jamaica by Married-Couple Family Poverty
In terms of married-couple family poverty, the demographic groups most similar to Immigrants from Jamaica are Immigrants from West Indies (6.2%, a difference of 0.040%), Alaska Native (6.2%, a difference of 0.21%), Immigrants from Bahamas (6.2%, a difference of 0.22%), Trinidadian and Tobagonian (6.2%, a difference of 0.25%), and Spanish American (6.2%, a difference of 0.69%).
| Demographics | Rating | Rank | Married-Couple Family Poverty |
| Immigrants | Senegal | 0.3 /100 | #263 | Tragic 6.1% |
| Immigrants | Congo | 0.2 /100 | #264 | Tragic 6.1% |
| Blackfeet | 0.2 /100 | #265 | Tragic 6.2% |
| Creek | 0.2 /100 | #266 | Tragic 6.2% |
| Spanish Americans | 0.2 /100 | #267 | Tragic 6.2% |
| Alaska Natives | 0.2 /100 | #268 | Tragic 6.2% |
| Immigrants | West Indies | 0.1 /100 | #269 | Tragic 6.2% |
| Immigrants | Jamaica | 0.1 /100 | #270 | Tragic 6.2% |
| Immigrants | Bahamas | 0.1 /100 | #271 | Tragic 6.2% |
| Trinidadians and Tobagonians | 0.1 /100 | #272 | Tragic 6.2% |
| Colville | 0.1 /100 | #273 | Tragic 6.3% |
| Barbadians | 0.1 /100 | #274 | Tragic 6.3% |
| Choctaw | 0.1 /100 | #275 | Tragic 6.3% |
| Yaqui | 0.1 /100 | #276 | Tragic 6.3% |
| Indonesians | 0.1 /100 | #277 | Tragic 6.3% |