Hominy, OK Map & Demographics
Hominy Map
Hominy Overview
$15,396
PER CAPITA INCOME
$42,500
AVG FAMILY INCOME
$34,735
AVG HOUSEHOLD INCOME
21.2%
WAGE / INCOME GAP [ % ]
78.8¢/ $1
WAGE / INCOME GAP [ $ ]
$14,207
FAMILY INCOME DEFICIT
0.47
INEQUALITY / GINI INDEX
3,327
TOTAL POPULATION
2,339
MALE POPULATION
988
FEMALE POPULATION
236.74
MALES / 100 FEMALES
42.24
FEMALES / 100 MALES
41.7
MEDIAN AGE
2.6
AVG FAMILY SIZE
2.2
AVG HOUSEHOLD SIZE
796
LABOR FORCE [ PEOPLE ]
27.1%
PERCENT IN LABOR FORCE
6.7%
UNEMPLOYMENT RATE
Hominy Zip Codes
Hominy Area Codes
Income in Hominy
Income Overview in Hominy
Per Capita Income in Hominy is $15,396, while median incomes of families and households are $42,500 and $34,735 respectively.
| Characteristic | Number | Measure |
| Per Capita Income | 3,327 | $15,396 |
| Median Family Income | 614 | $42,500 |
| Mean Family Income | 614 | $56,703 |
| Median Household Income | 957 | $34,735 |
| Mean Household Income | 957 | $50,232 |
| Income Deficit | 614 | $14,207 |
| Wage / Income Gap (%) | 3,327 | 21.20% |
| Wage / Income Gap ($) | 3,327 | 78.80¢ per $1 |
| Gini / Inequality Index | 3,327 | 0.47 |
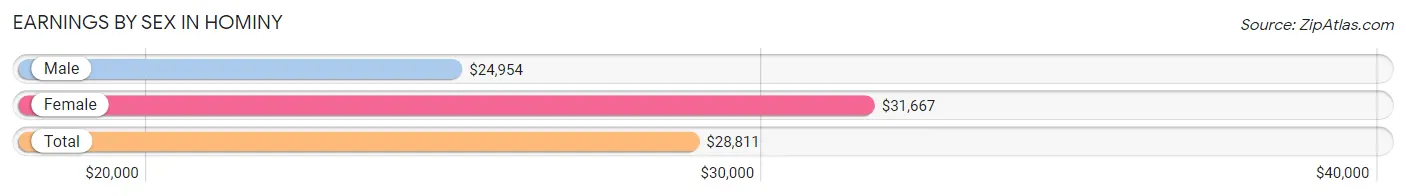
Earnings by Sex in Hominy
Average Earnings in Hominy are $28,811, $24,954 for men and $31,667 for women, a difference of 21.2%.
| Sex | Number | Average Earnings |
| Male | 557 (60.1%) | $24,954 |
| Female | 370 (39.9%) | $31,667 |
| Total | 927 (100.0%) | $28,811 |
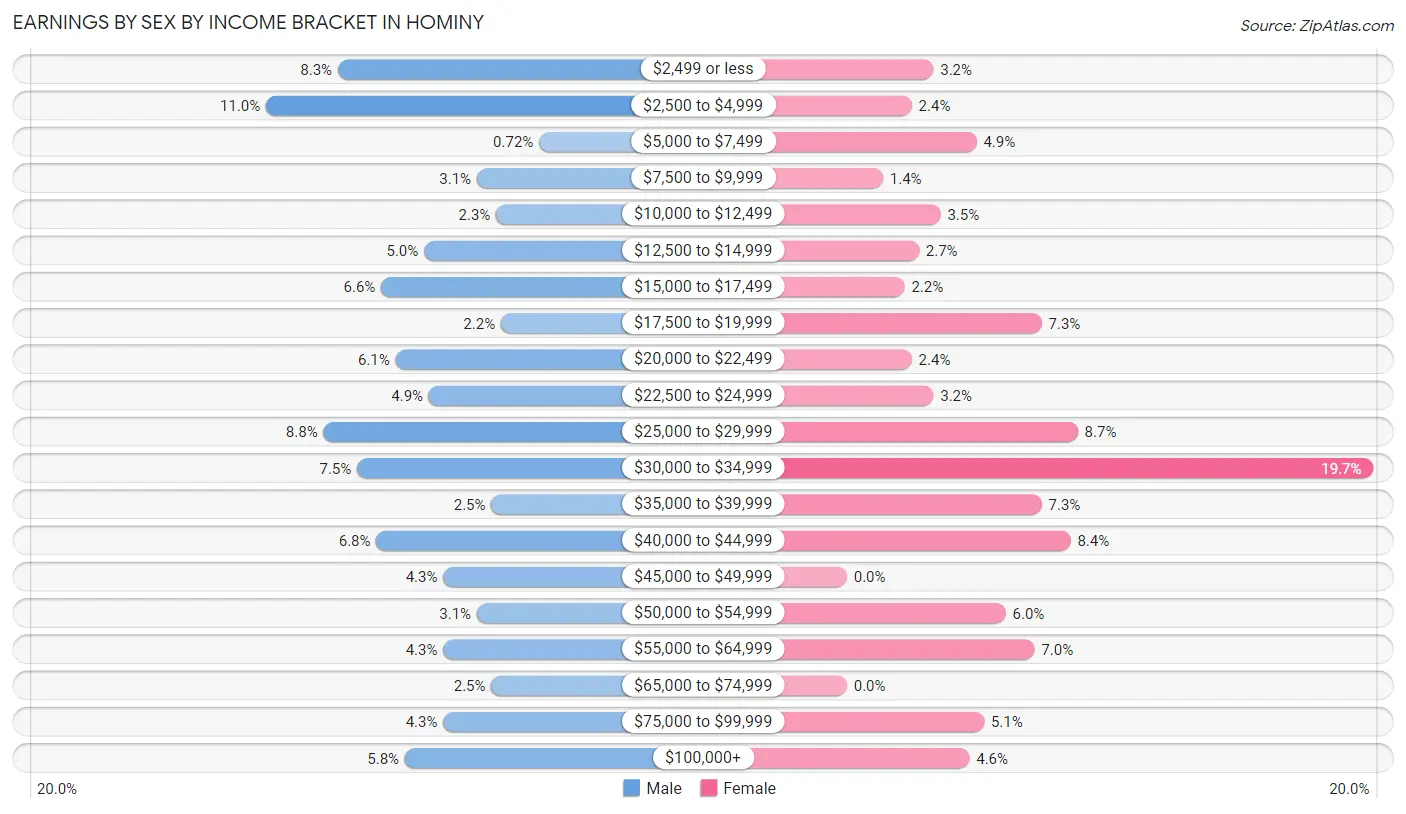
Earnings by Sex by Income Bracket in Hominy
The most common earnings brackets in Hominy are $2,500 to $4,999 for men (61 | 11.0%) and $30,000 to $34,999 for women (73 | 19.7%).
| Income | Male | Female |
| $2,499 or less | 46 (8.3%) | 12 (3.2%) |
| $2,500 to $4,999 | 61 (11.0%) | 9 (2.4%) |
| $5,000 to $7,499 | 4 (0.7%) | 18 (4.9%) |
| $7,500 to $9,999 | 17 (3.0%) | 5 (1.3%) |
| $10,000 to $12,499 | 13 (2.3%) | 13 (3.5%) |
| $12,500 to $14,999 | 28 (5.0%) | 10 (2.7%) |
| $15,000 to $17,499 | 37 (6.6%) | 8 (2.2%) |
| $17,500 to $19,999 | 12 (2.1%) | 27 (7.3%) |
| $20,000 to $22,499 | 34 (6.1%) | 9 (2.4%) |
| $22,500 to $24,999 | 27 (4.9%) | 12 (3.2%) |
| $25,000 to $29,999 | 49 (8.8%) | 32 (8.6%) |
| $30,000 to $34,999 | 42 (7.5%) | 73 (19.7%) |
| $35,000 to $39,999 | 14 (2.5%) | 27 (7.3%) |
| $40,000 to $44,999 | 38 (6.8%) | 31 (8.4%) |
| $45,000 to $49,999 | 24 (4.3%) | 0 (0.0%) |
| $50,000 to $54,999 | 17 (3.0%) | 22 (5.9%) |
| $55,000 to $64,999 | 24 (4.3%) | 26 (7.0%) |
| $65,000 to $74,999 | 14 (2.5%) | 0 (0.0%) |
| $75,000 to $99,999 | 24 (4.3%) | 19 (5.1%) |
| $100,000+ | 32 (5.8%) | 17 (4.6%) |
| Total | 557 (100.0%) | 370 (100.0%) |
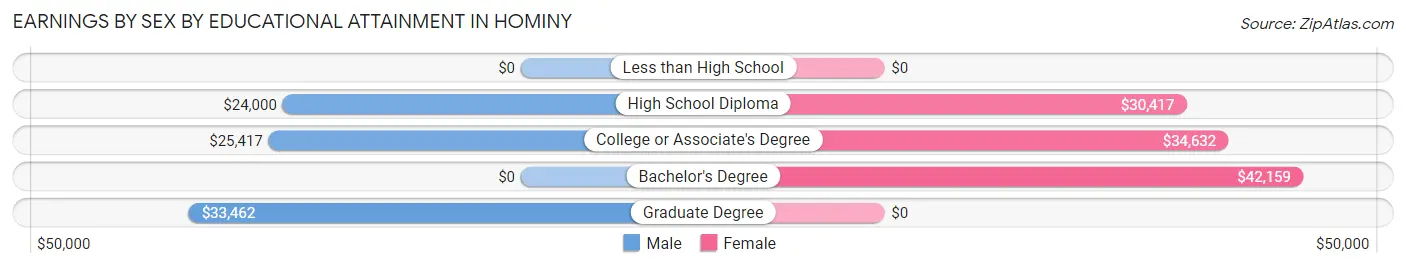
Earnings by Sex by Educational Attainment in Hominy
Average earnings in Hominy are $26,111 for men and $32,306 for women, a difference of 19.2%. Men with an educational attainment of graduate degree enjoy the highest average annual earnings of $33,462, while those with high school diploma education earn the least with $24,000. Women with an educational attainment of bachelor's degree earn the most with the average annual earnings of $42,159, while those with high school diploma education have the smallest earnings of $30,417.
| Educational Attainment | Male Income | Female Income |
| Less than High School | - | - |
| High School Diploma | $24,000 | $30,417 |
| College or Associate's Degree | $25,417 | $34,632 |
| Bachelor's Degree | - | - |
| Graduate Degree | $33,462 | $0 |
| Total | $26,111 | $32,306 |
Family Income in Hominy
Family Income Brackets in Hominy
According to the Hominy family income data, there are 121 families falling into the $50,000 to $74,999 income range, which is the most common income bracket and makes up 19.7% of all families. Conversely, the $150,000 to $199,999 income bracket is the least frequent group with only 10 families (1.6%) belonging to this category.
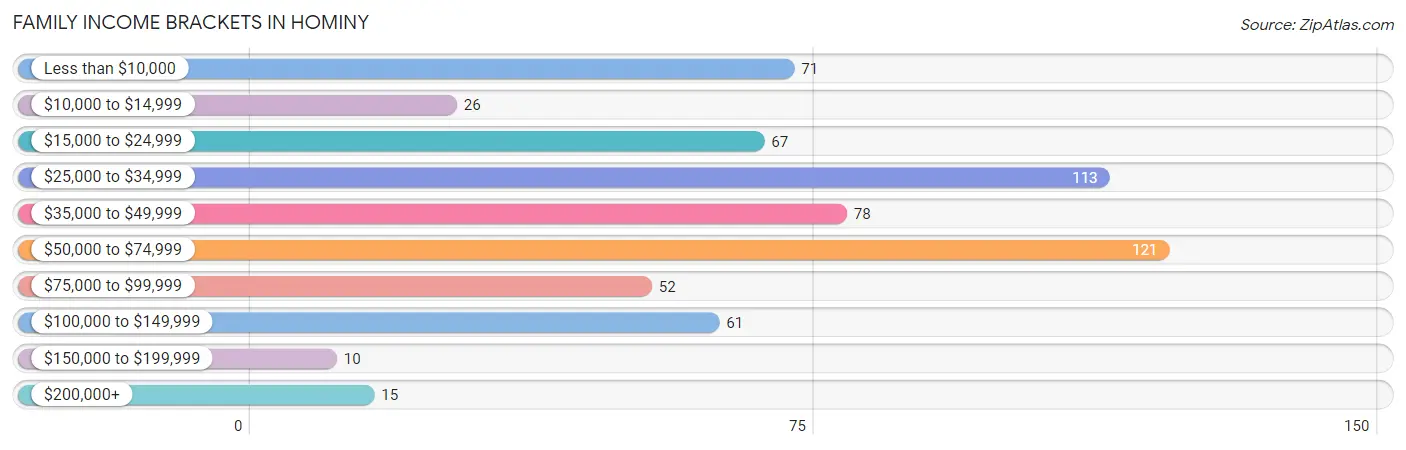
| Income Bracket | # Families | % Families |
| Less than $10,000 | 71 | 11.6% |
| $10,000 to $14,999 | 26 | 4.2% |
| $15,000 to $24,999 | 67 | 10.9% |
| $25,000 to $34,999 | 113 | 18.4% |
| $35,000 to $49,999 | 78 | 12.7% |
| $50,000 to $74,999 | 121 | 19.7% |
| $75,000 to $99,999 | 52 | 8.5% |
| $100,000 to $149,999 | 61 | 9.9% |
| $150,000 to $199,999 | 10 | 1.6% |
| $200,000+ | 15 | 2.4% |
Family Income by Famaliy Size in Hominy
4-person families (74 | 12.0%) account for the highest median family income in Hominy with $57,778 per family, while 3-person families (130 | 21.2%) have the highest median income of $18,889 per family member.
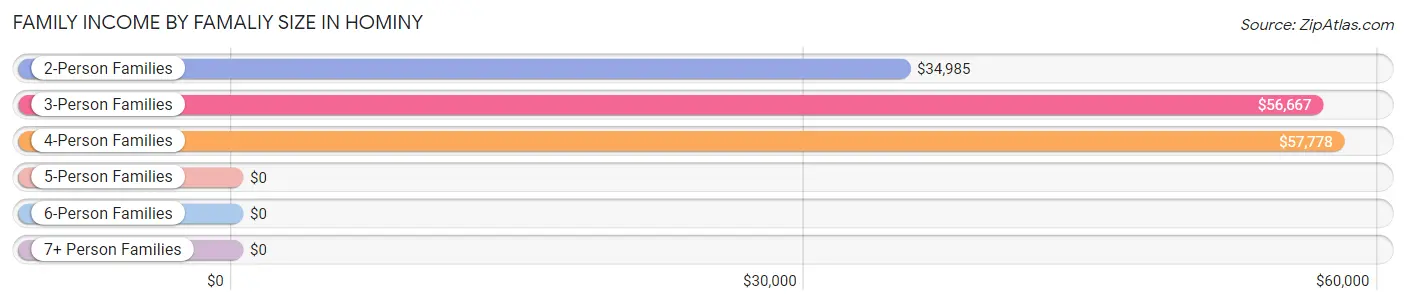
| Income Bracket | # Families | Median Income |
| 2-Person Families | 363 (59.1%) | $34,985 |
| 3-Person Families | 130 (21.2%) | $56,667 |
| 4-Person Families | 74 (12.0%) | $57,778 |
| 5-Person Families | 38 (6.2%) | $0 |
| 6-Person Families | 0 (0.0%) | $0 |
| 7+ Person Families | 9 (1.5%) | $0 |
| Total | 614 (100.0%) | $42,500 |
Family Income by Number of Earners in Hominy
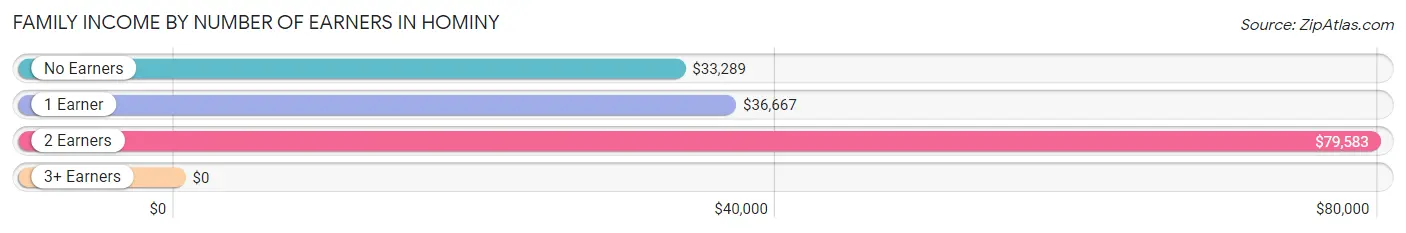
| Number of Earners | # Families | Median Income |
| No Earners | 231 (37.6%) | $33,289 |
| 1 Earner | 208 (33.9%) | $36,667 |
| 2 Earners | 166 (27.0%) | $79,583 |
| 3+ Earners | 9 (1.5%) | $0 |
| Total | 614 (100.0%) | $42,500 |
Household Income in Hominy
Household Income Brackets in Hominy
With 201 households falling in the category, the $25,000 to $34,999 income range is the most frequent in Hominy, accounting for 21.0% of all households. In contrast, only 10 households (1.0%) fall into the $150,000 to $199,999 income bracket, making it the least populous group.
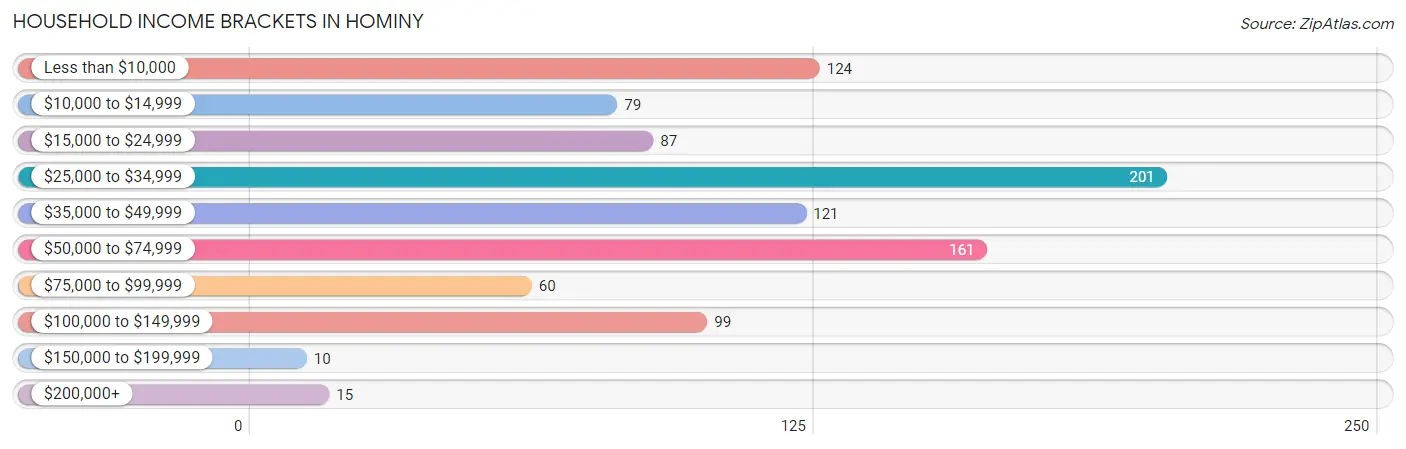
| Income Bracket | # Households | % Households |
| Less than $10,000 | 124 | 13.0% |
| $10,000 to $14,999 | 79 | 8.3% |
| $15,000 to $24,999 | 87 | 9.1% |
| $25,000 to $34,999 | 201 | 21.0% |
| $35,000 to $49,999 | 121 | 12.6% |
| $50,000 to $74,999 | 161 | 16.8% |
| $75,000 to $99,999 | 60 | 6.3% |
| $100,000 to $149,999 | 99 | 10.3% |
| $150,000 to $199,999 | 10 | 1.0% |
| $200,000+ | 15 | 1.6% |
Household Income by Householder Age in Hominy
The median household income in Hominy is $34,735, with the highest median household income of $42,875 found in the 45 to 64 years age bracket for the primary householder. A total of 337 households (35.2%) fall into this category. Meanwhile, the 25 to 44 years age bracket for the primary householder has the lowest median household income of $33,750, with 209 households (21.8%) in this group.
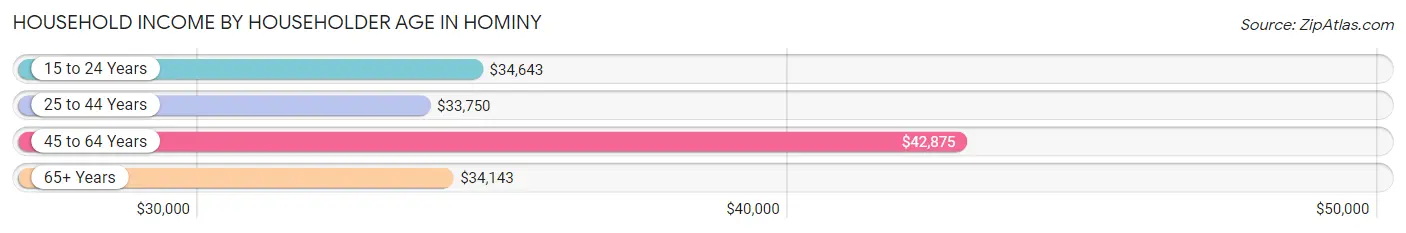
| Income Bracket | # Households | Median Income |
| 15 to 24 Years | 90 (9.4%) | $34,643 |
| 25 to 44 Years | 209 (21.8%) | $33,750 |
| 45 to 64 Years | 337 (35.2%) | $42,875 |
| 65+ Years | 321 (33.5%) | $34,143 |
| Total | 957 (100.0%) | $34,735 |
Poverty in Hominy
Income Below Poverty by Sex and Age in Hominy
With 26.6% poverty level for males and 31.5% for females among the residents of Hominy, under 5 year old males and 18 to 24 year old females are the most vulnerable to poverty, with 62 males (67.4%) and 62 females (78.5%) in their respective age groups living below the poverty level.
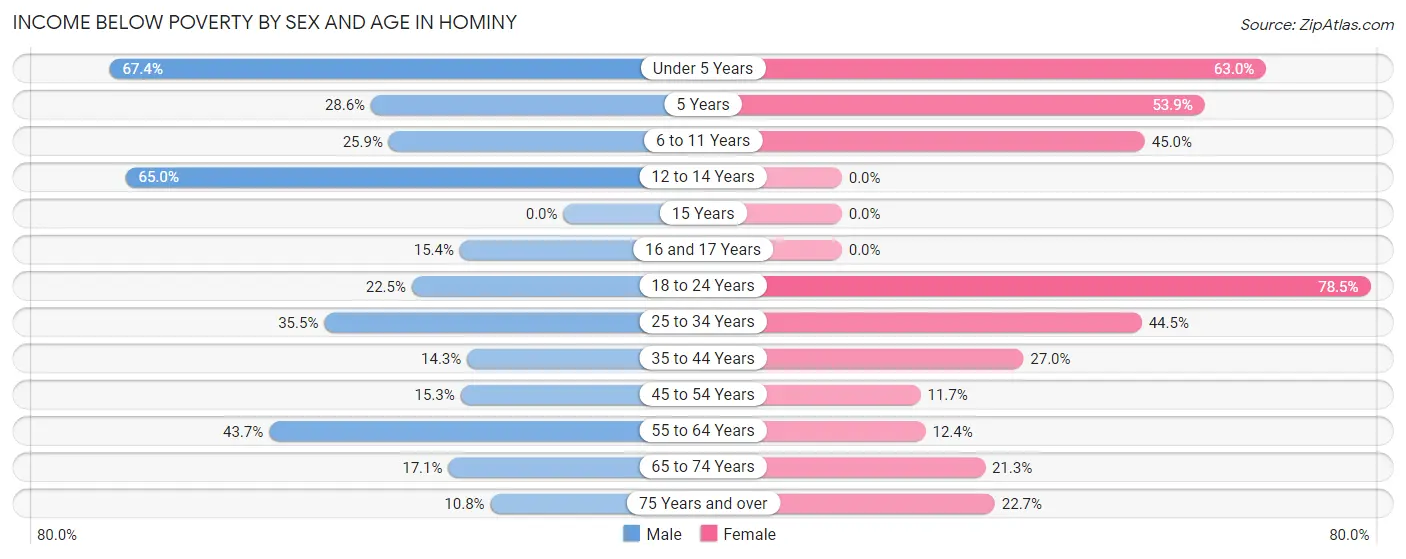
| Age Bracket | Male | Female |
| Under 5 Years | 62 (67.4%) | 46 (63.0%) |
| 5 Years | 6 (28.6%) | 7 (53.8%) |
| 6 to 11 Years | 14 (25.9%) | 36 (45.0%) |
| 12 to 14 Years | 13 (65.0%) | 0 (0.0%) |
| 15 Years | 0 (0.0%) | 0 (0.0%) |
| 16 and 17 Years | 6 (15.4%) | 0 (0.0%) |
| 18 to 24 Years | 27 (22.5%) | 62 (78.5%) |
| 25 to 34 Years | 38 (35.5%) | 53 (44.5%) |
| 35 to 44 Years | 14 (14.3%) | 31 (27.0%) |
| 45 to 54 Years | 20 (15.3%) | 9 (11.7%) |
| 55 to 64 Years | 52 (43.7%) | 25 (12.4%) |
| 65 to 74 Years | 20 (17.1%) | 27 (21.3%) |
| 75 Years and over | 17 (10.8%) | 15 (22.7%) |
| Total | 289 (26.6%) | 311 (31.5%) |
Income Above Poverty by Sex and Age in Hominy
According to the poverty statistics in Hominy, males aged 15 years and females aged 12 to 14 years are the age groups that are most secure financially, with 100.0% of males and 100.0% of females in these age groups living above the poverty line.
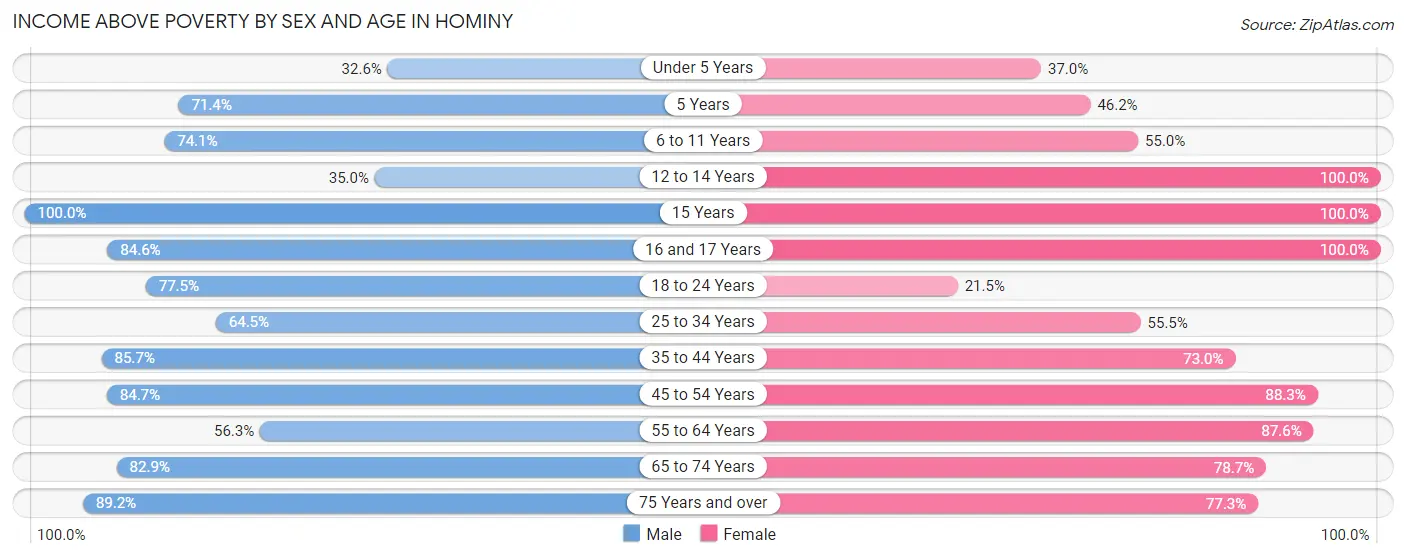
| Age Bracket | Male | Female |
| Under 5 Years | 30 (32.6%) | 27 (37.0%) |
| 5 Years | 15 (71.4%) | 6 (46.2%) |
| 6 to 11 Years | 40 (74.1%) | 44 (55.0%) |
| 12 to 14 Years | 7 (35.0%) | 16 (100.0%) |
| 15 Years | 10 (100.0%) | 9 (100.0%) |
| 16 and 17 Years | 33 (84.6%) | 13 (100.0%) |
| 18 to 24 Years | 93 (77.5%) | 17 (21.5%) |
| 25 to 34 Years | 69 (64.5%) | 66 (55.5%) |
| 35 to 44 Years | 84 (85.7%) | 84 (73.0%) |
| 45 to 54 Years | 111 (84.7%) | 68 (88.3%) |
| 55 to 64 Years | 67 (56.3%) | 176 (87.6%) |
| 65 to 74 Years | 97 (82.9%) | 100 (78.7%) |
| 75 Years and over | 140 (89.2%) | 51 (77.3%) |
| Total | 796 (73.4%) | 677 (68.5%) |
Income Below Poverty Among Married-Couple Families in Hominy
The poverty statistics for married-couple families in Hominy show that 8.9% or 33 of the total 369 families live below the poverty line. Families with 3 or 4 children have the highest poverty rate of 28.6%, comprising of 6 families. On the other hand, families with no children have the lowest poverty rate of 2.7%, which includes 7 families.
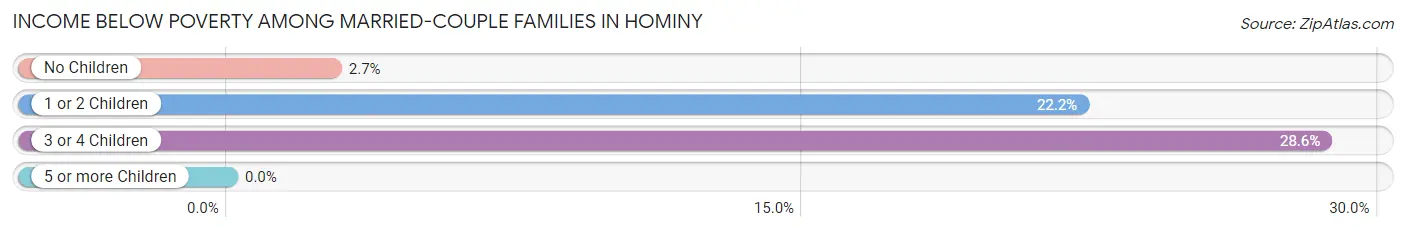
| Children | Above Poverty | Below Poverty |
| No Children | 251 (97.3%) | 7 (2.7%) |
| 1 or 2 Children | 70 (77.8%) | 20 (22.2%) |
| 3 or 4 Children | 15 (71.4%) | 6 (28.6%) |
| 5 or more Children | 0 (0.0%) | 0 (0.0%) |
| Total | 336 (91.1%) | 33 (8.9%) |
Income Below Poverty Among Single-Parent Households in Hominy
According to the poverty data in Hominy, 27.3% or 18 single-father households and 43.6% or 78 single-mother households are living below the poverty line. Among single-father households, those with 1 or 2 children have the highest poverty rate, with 13 households (30.9%) experiencing poverty. Likewise, among single-mother households, those with 5 or more children have the highest poverty rate, with 9 households (100.0%) falling below the poverty line.
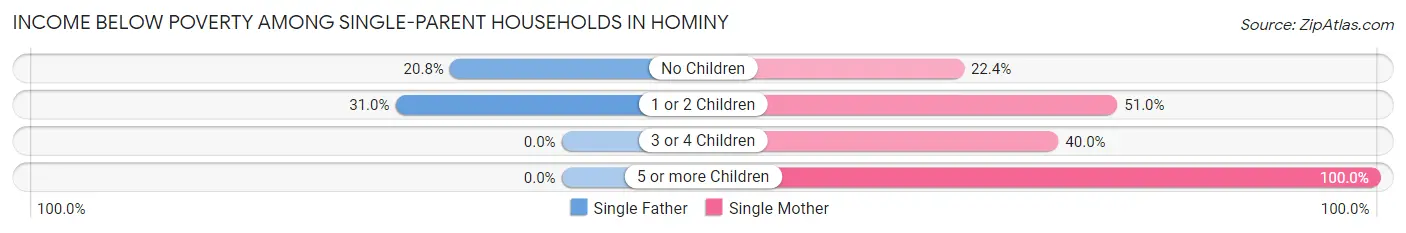
| Children | Single Father | Single Mother |
| No Children | 5 (20.8%) | 13 (22.4%) |
| 1 or 2 Children | 13 (30.9%) | 52 (51.0%) |
| 3 or 4 Children | 0 (0.0%) | 4 (40.0%) |
| 5 or more Children | 0 (0.0%) | 9 (100.0%) |
| Total | 18 (27.3%) | 78 (43.6%) |
Income Below Poverty Among Married-Couple vs Single-Parent Households in Hominy
The poverty data for Hominy shows that 33 of the married-couple family households (8.9%) and 96 of the single-parent households (39.2%) are living below the poverty level. Within the married-couple family households, those with 3 or 4 children have the highest poverty rate, with 6 households (28.6%) falling below the poverty line. Among the single-parent households, those with 5 or more children have the highest poverty rate, with 9 household (100.0%) living below poverty.
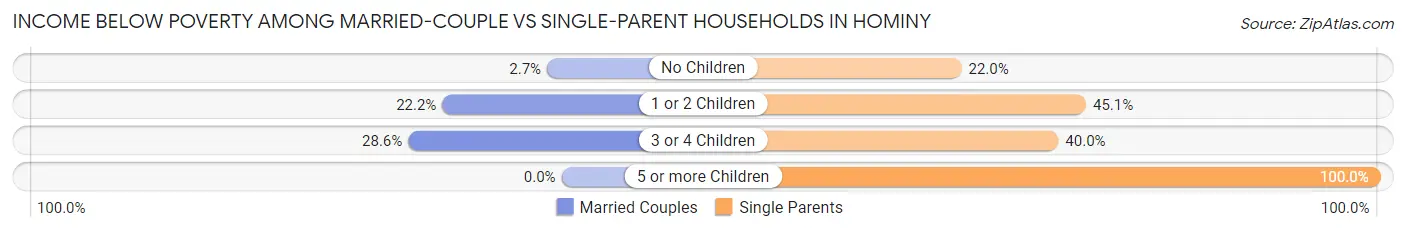
| Children | Married-Couple Families | Single-Parent Households |
| No Children | 7 (2.7%) | 18 (22.0%) |
| 1 or 2 Children | 20 (22.2%) | 65 (45.1%) |
| 3 or 4 Children | 6 (28.6%) | 4 (40.0%) |
| 5 or more Children | 0 (0.0%) | 9 (100.0%) |
| Total | 33 (8.9%) | 96 (39.2%) |
Race in Hominy
The most populous races in Hominy are White / Caucasian (1,756 | 52.8%), Native / Alaskan (563 | 16.9%), and Two or more Races (464 | 14.0%).
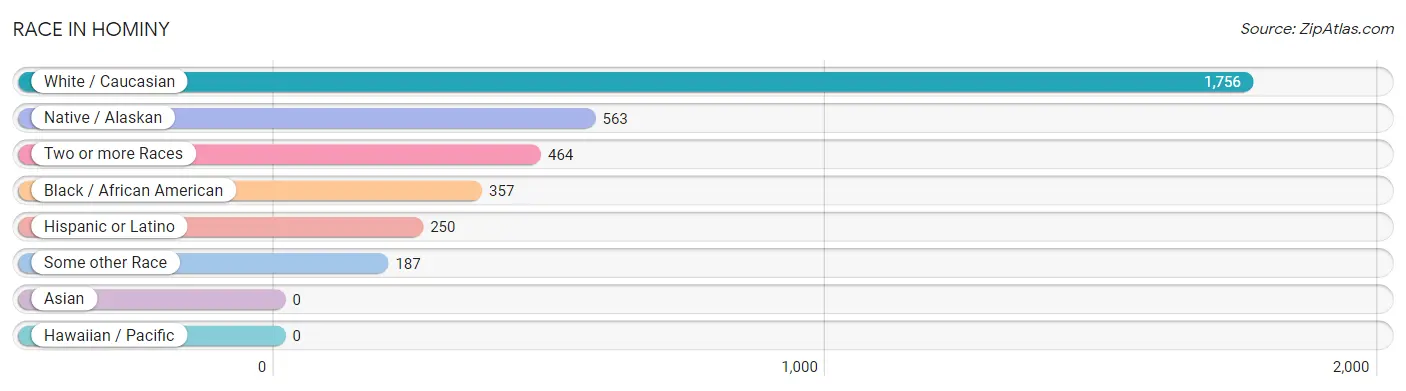
| Race | # Population | % Population |
| Asian | 0 | 0.0% |
| Black / African American | 357 | 10.7% |
| Hawaiian / Pacific | 0 | 0.0% |
| Hispanic or Latino | 250 | 7.5% |
| Native / Alaskan | 563 | 16.9% |
| White / Caucasian | 1,756 | 52.8% |
| Two or more Races | 464 | 14.0% |
| Some other Race | 187 | 5.6% |
| Total | 3,327 | 100.0% |
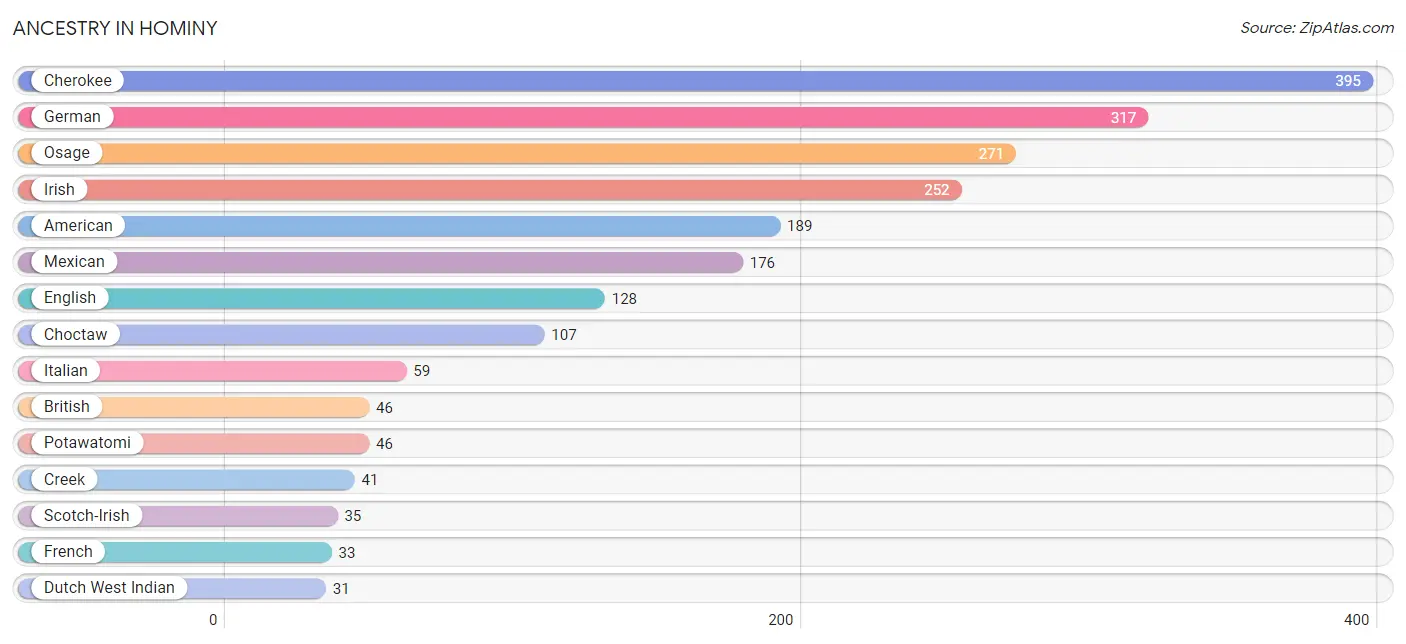
Ancestry in Hominy
The most populous ancestries reported in Hominy are Cherokee (395 | 11.9%), German (317 | 9.5%), Osage (271 | 8.2%), Irish (252 | 7.6%), and American (189 | 5.7%), together accounting for 42.8% of all Hominy residents.
| Ancestry | # Population | % Population |
| African | 18 | 0.5% |
| American | 189 | 5.7% |
| Apache | 4 | 0.1% |
| Basque | 20 | 0.6% |
| Blackfeet | 25 | 0.7% |
| British | 46 | 1.4% |
| Cajun | 20 | 0.6% |
| Cherokee | 395 | 11.9% |
| Cheyenne | 10 | 0.3% |
| Chickasaw | 11 | 0.3% |
| Choctaw | 107 | 3.2% |
| Comanche | 9 | 0.3% |
| Creek | 41 | 1.2% |
| Danish | 6 | 0.2% |
| Dutch | 20 | 0.6% |
| Dutch West Indian | 31 | 0.9% |
| English | 128 | 3.8% |
| European | 23 | 0.7% |
| French | 33 | 1.0% |
| German | 317 | 9.5% |
| Indian (Asian) | 10 | 0.3% |
| Irish | 252 | 7.6% |
| Iroquois | 28 | 0.8% |
| Italian | 59 | 1.8% |
| Jamaican | 11 | 0.3% |
| Kiowa | 15 | 0.4% |
| Mexican | 176 | 5.3% |
| Native Hawaiian | 10 | 0.3% |
| Osage | 271 | 8.2% |
| Pima | 9 | 0.3% |
| Polish | 4 | 0.1% |
| Potawatomi | 46 | 1.4% |
| Puerto Rican | 20 | 0.6% |
| Russian | 6 | 0.2% |
| Scandinavian | 17 | 0.5% |
| Scotch-Irish | 35 | 1.1% |
| Scottish | 25 | 0.7% |
| Seminole | 24 | 0.7% |
| Spaniard | 4 | 0.1% |
| Subsaharan African | 18 | 0.5% |
| Swedish | 4 | 0.1% |
| Yugoslavian | 9 | 0.3% | View All 42 Rows |
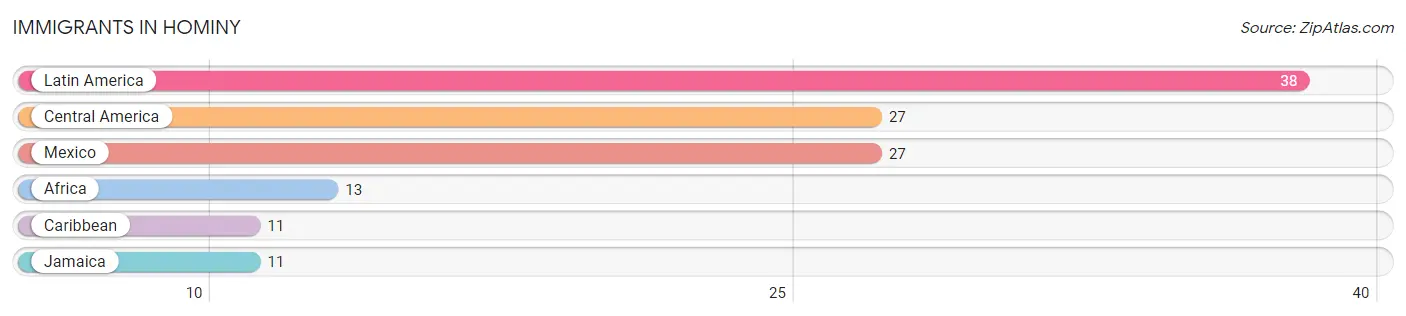
Immigrants in Hominy
The most numerous immigrant groups reported in Hominy came from Latin America (38 | 1.1%), Central America (27 | 0.8%), Mexico (27 | 0.8%), Africa (13 | 0.4%), and Caribbean (11 | 0.3%), together accounting for 3.5% of all Hominy residents.
| Immigration Origin | # Population | % Population |
| Africa | 13 | 0.4% |
| Caribbean | 11 | 0.3% |
| Central America | 27 | 0.8% |
| Jamaica | 11 | 0.3% |
| Latin America | 38 | 1.1% |
| Mexico | 27 | 0.8% | View All 6 Rows |
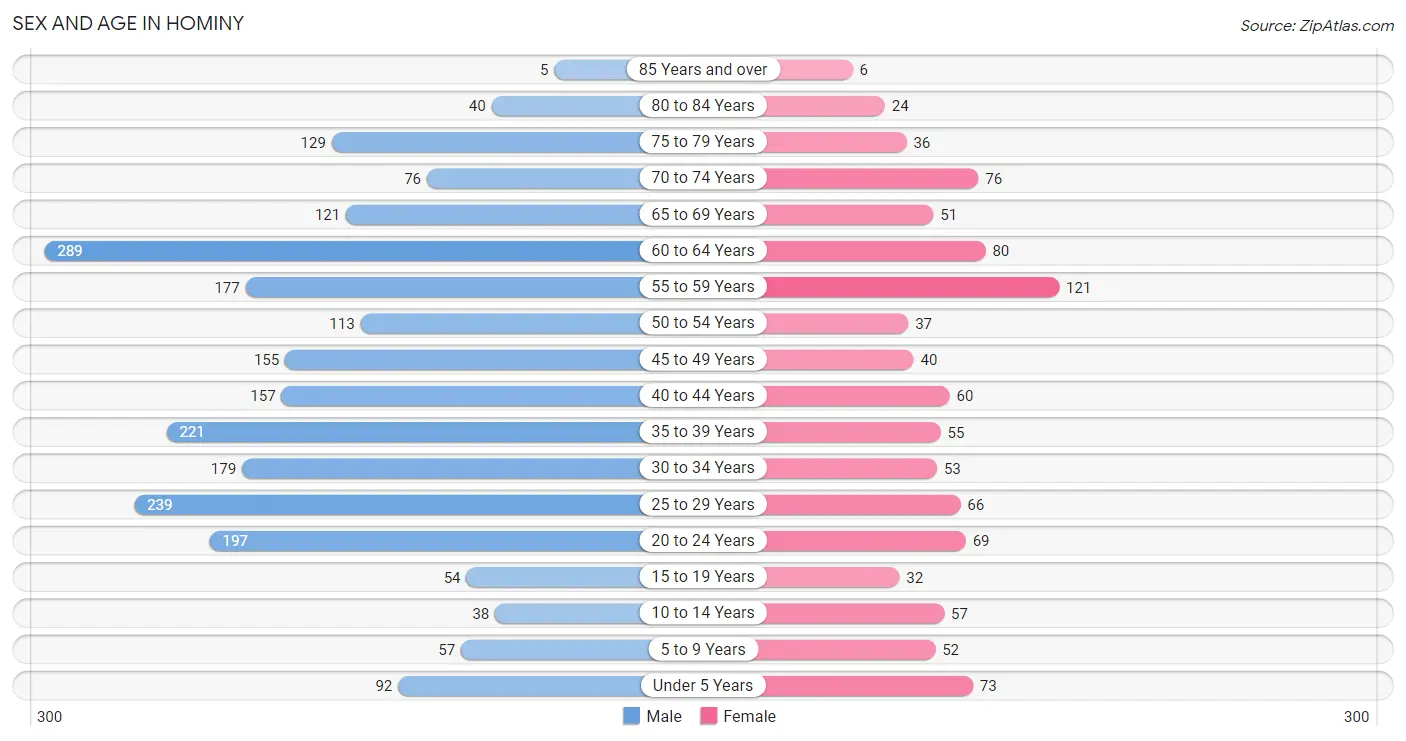
Sex and Age in Hominy
Sex and Age in Hominy
The most populous age groups in Hominy are 60 to 64 Years (289 | 12.4%) for men and 55 to 59 Years (121 | 12.2%) for women.
| Age Bracket | Male | Female |
| Under 5 Years | 92 (3.9%) | 73 (7.4%) |
| 5 to 9 Years | 57 (2.4%) | 52 (5.3%) |
| 10 to 14 Years | 38 (1.6%) | 57 (5.8%) |
| 15 to 19 Years | 54 (2.3%) | 32 (3.2%) |
| 20 to 24 Years | 197 (8.4%) | 69 (7.0%) |
| 25 to 29 Years | 239 (10.2%) | 66 (6.7%) |
| 30 to 34 Years | 179 (7.6%) | 53 (5.4%) |
| 35 to 39 Years | 221 (9.5%) | 55 (5.6%) |
| 40 to 44 Years | 157 (6.7%) | 60 (6.1%) |
| 45 to 49 Years | 155 (6.6%) | 40 (4.1%) |
| 50 to 54 Years | 113 (4.8%) | 37 (3.7%) |
| 55 to 59 Years | 177 (7.6%) | 121 (12.2%) |
| 60 to 64 Years | 289 (12.4%) | 80 (8.1%) |
| 65 to 69 Years | 121 (5.2%) | 51 (5.2%) |
| 70 to 74 Years | 76 (3.3%) | 76 (7.7%) |
| 75 to 79 Years | 129 (5.5%) | 36 (3.6%) |
| 80 to 84 Years | 40 (1.7%) | 24 (2.4%) |
| 85 Years and over | 5 (0.2%) | 6 (0.6%) |
| Total | 2,339 (100.0%) | 988 (100.0%) |
Families and Households in Hominy
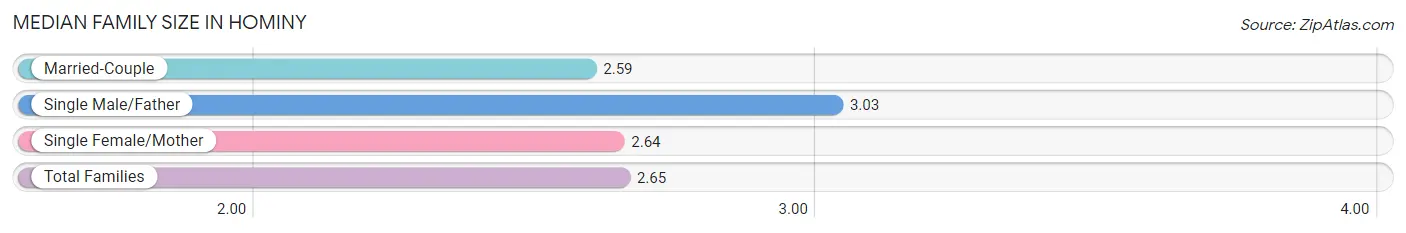
Median Family Size in Hominy
The median family size in Hominy is 2.65 persons per family, with single male/father families (66 | 10.7%) accounting for the largest median family size of 3.03 persons per family. On the other hand, married-couple families (369 | 60.1%) represent the smallest median family size with 2.59 persons per family.
| Family Type | # Families | Family Size |
| Married-Couple | 369 (60.1%) | 2.59 |
| Single Male/Father | 66 (10.7%) | 3.03 |
| Single Female/Mother | 179 (29.1%) | 2.64 |
| Total Families | 614 (100.0%) | 2.65 |
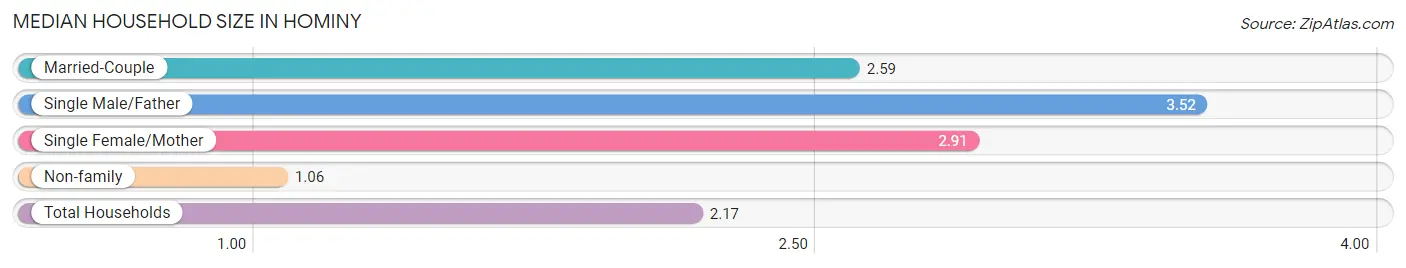
Median Household Size in Hominy
The median household size in Hominy is 2.17 persons per household, with single male/father households (66 | 6.9%) accounting for the largest median household size of 3.52 persons per household. non-family households (343 | 35.8%) represent the smallest median household size with 1.06 persons per household.
| Household Type | # Households | Household Size |
| Married-Couple | 369 (38.6%) | 2.59 |
| Single Male/Father | 66 (6.9%) | 3.52 |
| Single Female/Mother | 179 (18.7%) | 2.91 |
| Non-family | 343 (35.8%) | 1.06 |
| Total Households | 957 (100.0%) | 2.17 |
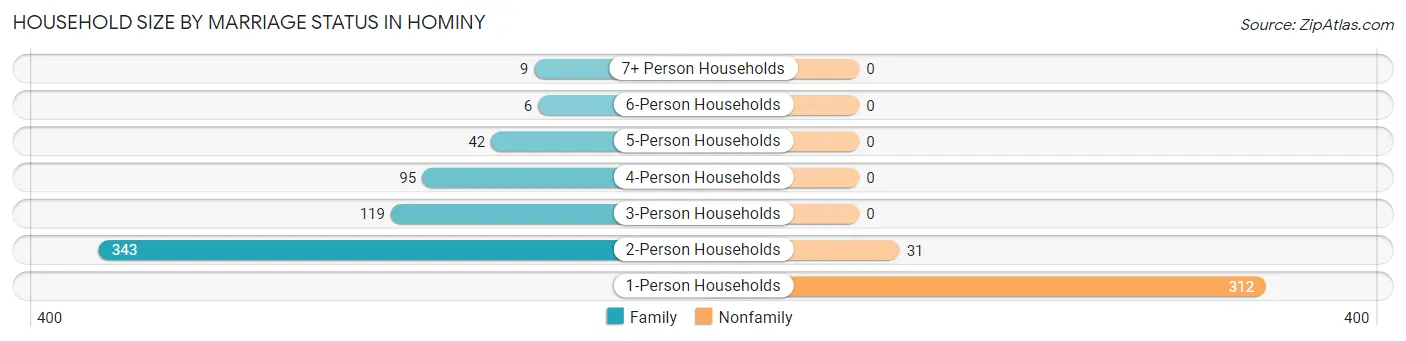
Household Size by Marriage Status in Hominy
Out of a total of 957 households in Hominy, 614 (64.2%) are family households, while 343 (35.8%) are nonfamily households. The most numerous type of family households are 2-person households, comprising 343, and the most common type of nonfamily households are 1-person households, comprising 312.
| Household Size | Family Households | Nonfamily Households |
| 1-Person Households | - | 312 (32.6%) |
| 2-Person Households | 343 (35.8%) | 31 (3.2%) |
| 3-Person Households | 119 (12.4%) | 0 (0.0%) |
| 4-Person Households | 95 (9.9%) | 0 (0.0%) |
| 5-Person Households | 42 (4.4%) | 0 (0.0%) |
| 6-Person Households | 6 (0.6%) | 0 (0.0%) |
| 7+ Person Households | 9 (0.9%) | 0 (0.0%) |
| Total | 614 (64.2%) | 343 (35.8%) |
Female Fertility in Hominy
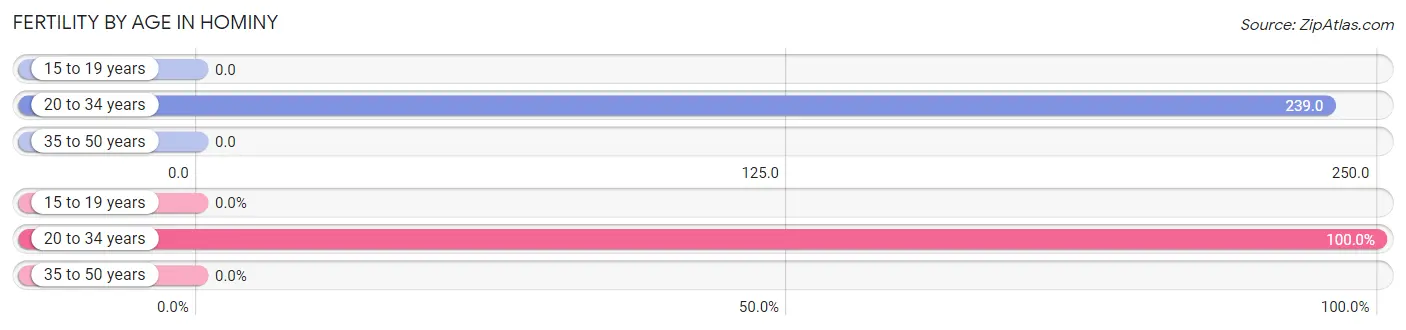
Fertility by Age in Hominy
Average fertility rate in Hominy is 120.0 births per 1,000 women. Women in the age bracket of 20 to 34 years have the highest fertility rate with 239.0 births per 1,000 women. Women in the age bracket of 20 to 34 years acount for 100.0% of all women with births.
| Age Bracket | Women with Births | Births / 1,000 Women |
| 15 to 19 years | 0 (0.0%) | 0.0 |
| 20 to 34 years | 45 (100.0%) | 239.0 |
| 35 to 50 years | 0 (0.0%) | 0.0 |
| Total | 45 (100.0%) | 120.0 |
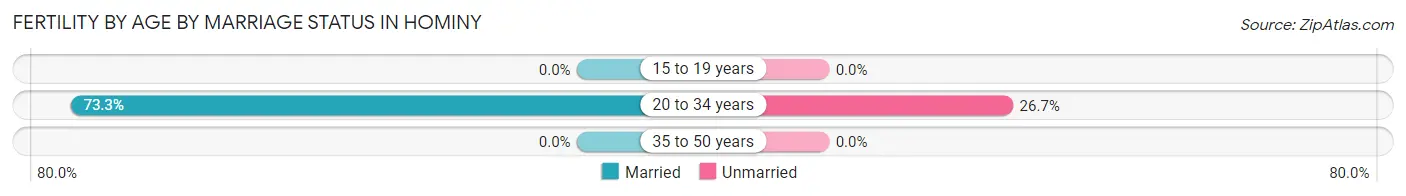
Fertility by Age by Marriage Status in Hominy
73.3% of women with births (45) in Hominy are married. The highest percentage of unmarried women with births falls into 20 to 34 years age bracket with 26.7% of them unmarried at the time of birth, while the lowest percentage of unmarried women with births belong to 20 to 34 years age bracket with 26.7% of them unmarried.
| Age Bracket | Married | Unmarried |
| 15 to 19 years | 0 (0.0%) | 0 (0.0%) |
| 20 to 34 years | 33 (73.3%) | 12 (26.7%) |
| 35 to 50 years | 0 (0.0%) | 0 (0.0%) |
| Total | 33 (73.3%) | 12 (26.7%) |
Fertility by Education in Hominy
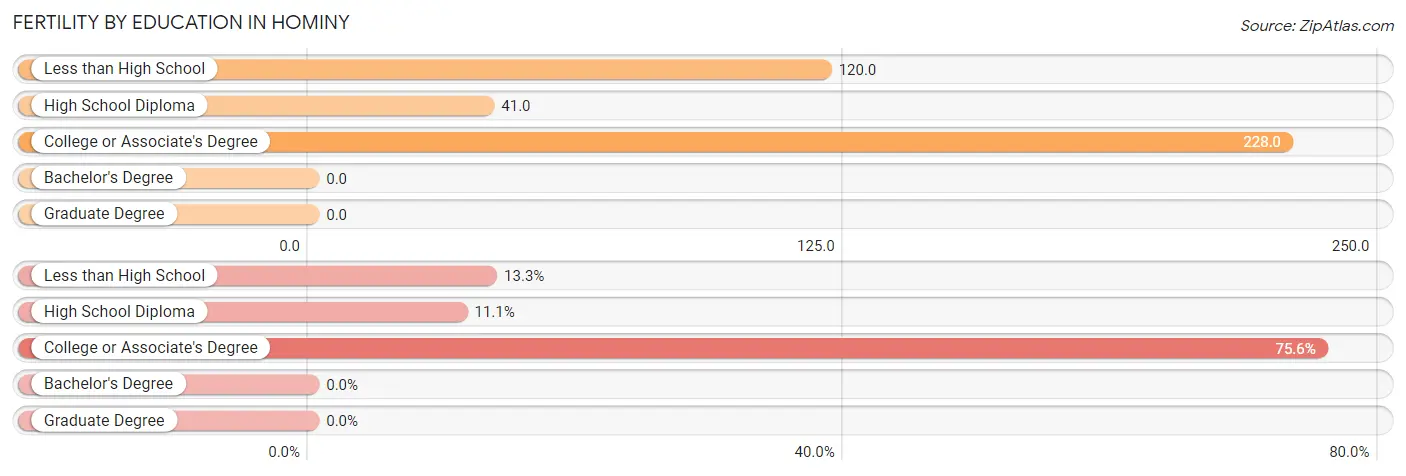
| Educational Attainment | Women with Births | Births / 1,000 Women |
| Less than High School | 6 (13.3%) | 120.0 |
| High School Diploma | 5 (11.1%) | 41.0 |
| College or Associate's Degree | 34 (75.6%) | 228.0 |
| Bachelor's Degree | 0 (0.0%) | 0.0 |
| Graduate Degree | 0 (0.0%) | 0.0 |
| Total | 45 (100.0%) | 120.0 |
Fertility by Education by Marriage Status in Hominy
26.7% of women with births in Hominy are unmarried. Women with the educational attainment of less than high school are most likely to be married with 100.0% of them married at childbirth, while women with the educational attainment of college or associate's degree are least likely to be married with 35.3% of them unmarried at childbirth.
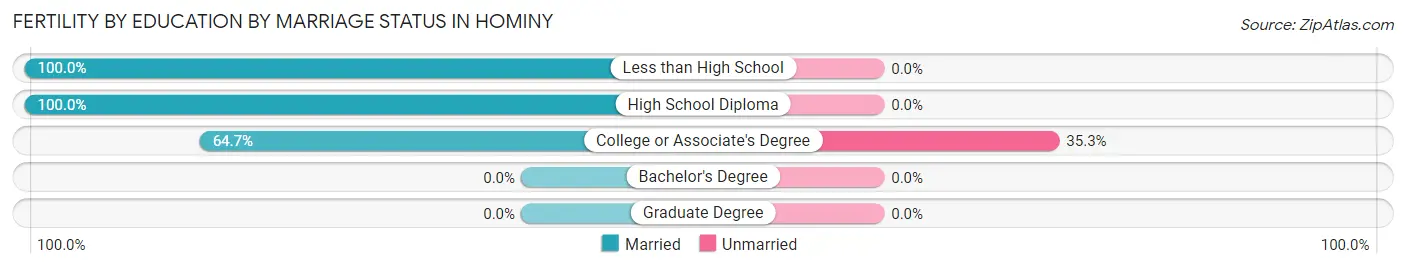
| Educational Attainment | Married | Unmarried |
| Less than High School | 6 (100.0%) | 0 (0.0%) |
| High School Diploma | 5 (100.0%) | 0 (0.0%) |
| College or Associate's Degree | 22 (64.7%) | 12 (35.3%) |
| Bachelor's Degree | 0 (0.0%) | 0 (0.0%) |
| Graduate Degree | 0 (0.0%) | 0 (0.0%) |
| Total | 33 (73.3%) | 12 (26.7%) |
Employment Characteristics in Hominy
Employment by Class of Employer in Hominy
Among the 712 employed individuals in Hominy, private company employees (408 | 57.3%), local government employees (95 | 13.3%), and state government employees (79 | 11.1%) make up the most common classes of employment.
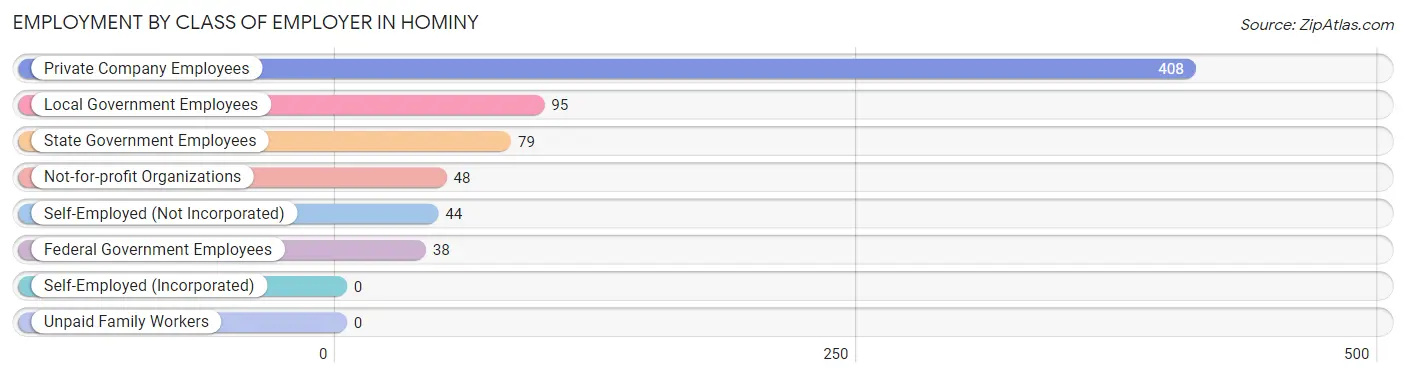
| Employer Class | # Employees | % Employees |
| Private Company Employees | 408 | 57.3% |
| Self-Employed (Incorporated) | 0 | 0.0% |
| Self-Employed (Not Incorporated) | 44 | 6.2% |
| Not-for-profit Organizations | 48 | 6.7% |
| Local Government Employees | 95 | 13.3% |
| State Government Employees | 79 | 11.1% |
| Federal Government Employees | 38 | 5.3% |
| Unpaid Family Workers | 0 | 0.0% |
| Total | 712 | 100.0% |
Employment Status by Age in Hominy
According to the labor force statistics for Hominy, out of the total population over 16 years of age (2,939), 27.1% or 796 individuals are in the labor force, with 6.7% or 53 of them unemployed. The age group with the highest labor force participation rate is 20 to 24 years, with 48.1% or 128 individuals in the labor force. Within the labor force, the 30 to 34 years age range has the highest percentage of unemployed individuals, with 15.9% or 13 of them being unemployed.
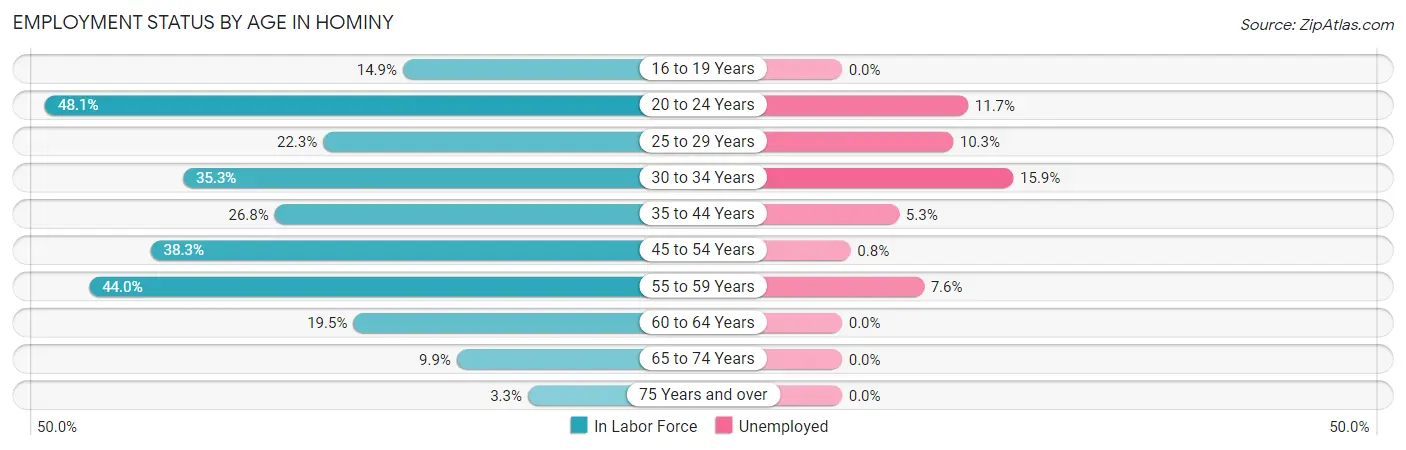
| Age Bracket | In Labor Force | Unemployed |
| 16 to 19 Years | 10 (14.9%) | 0 (0.0%) |
| 20 to 24 Years | 128 (48.1%) | 15 (11.7%) |
| 25 to 29 Years | 68 (22.3%) | 7 (10.3%) |
| 30 to 34 Years | 82 (35.3%) | 13 (15.9%) |
| 35 to 44 Years | 132 (26.8%) | 7 (5.3%) |
| 45 to 54 Years | 132 (38.3%) | 1 (0.8%) |
| 55 to 59 Years | 131 (44.0%) | 10 (7.6%) |
| 60 to 64 Years | 72 (19.5%) | 0 (0.0%) |
| 65 to 74 Years | 32 (9.9%) | 0 (0.0%) |
| 75 Years and over | 8 (3.3%) | 0 (0.0%) |
| Total | 796 (27.1%) | 53 (6.7%) |
Employment Status by Educational Attainment in Hominy
According to labor force statistics for Hominy, 30.2% of individuals (617) out of the total population between 25 and 64 years of age (2,042) are in the labor force, with 6.2% or 38 of them being unemployed. The group with the highest labor force participation rate are those with the educational attainment of bachelor's degree or higher, with 70.1% or 124 individuals in the labor force. Within the labor force, individuals with high school diploma education have the highest percentage of unemployment, with 15.0% or 35 of them being unemployed.
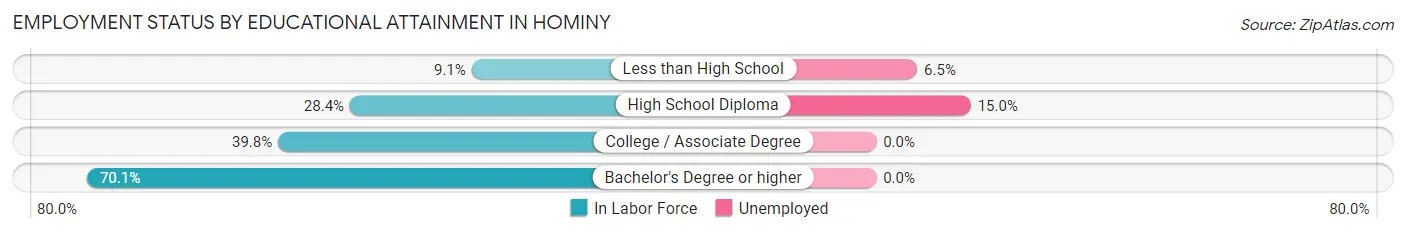
| Educational Attainment | In Labor Force | Unemployed |
| Less than High School | 46 (9.1%) | 33 (6.5%) |
| High School Diploma | 234 (28.4%) | 124 (15.0%) |
| College / Associate Degree | 213 (39.8%) | 0 (0.0%) |
| Bachelor's Degree or higher | 124 (70.1%) | 0 (0.0%) |
| Total | 617 (30.2%) | 127 (6.2%) |
Employment Occupations by Sex in Hominy
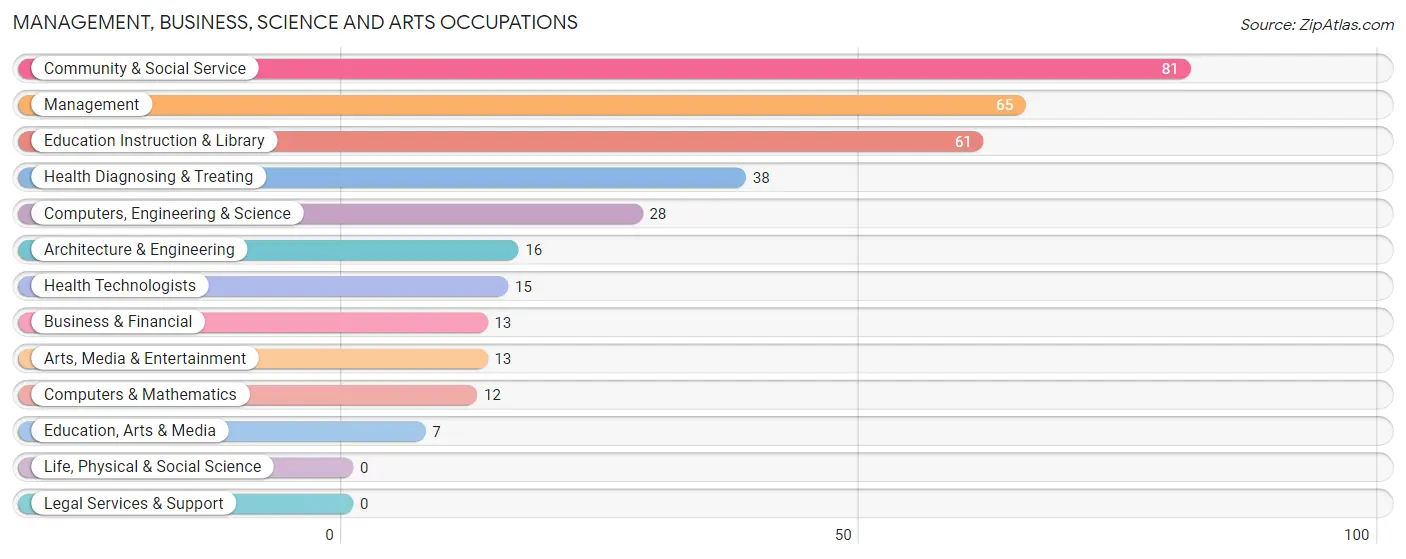
Management, Business, Science and Arts Occupations
The most common Management, Business, Science and Arts occupations in Hominy are Community & Social Service (81 | 10.9%), Management (65 | 8.8%), Education Instruction & Library (61 | 8.2%), Health Diagnosing & Treating (38 | 5.1%), and Computers, Engineering & Science (28 | 3.8%).
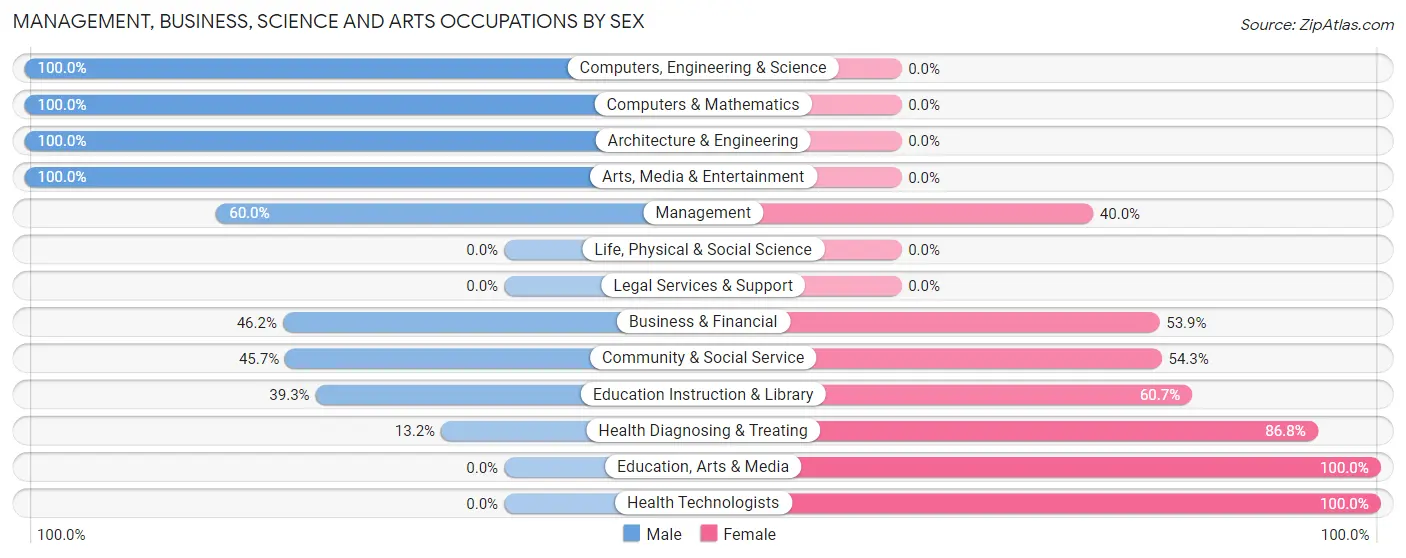
Management, Business, Science and Arts Occupations by Sex
Within the Management, Business, Science and Arts occupations in Hominy, the most male-oriented occupations are Computers, Engineering & Science (100.0%), Computers & Mathematics (100.0%), and Architecture & Engineering (100.0%), while the most female-oriented occupations are Education, Arts & Media (100.0%), Health Technologists (100.0%), and Health Diagnosing & Treating (86.8%).
| Occupation | Male | Female |
| Management | 39 (60.0%) | 26 (40.0%) |
| Business & Financial | 6 (46.2%) | 7 (53.8%) |
| Computers, Engineering & Science | 28 (100.0%) | 0 (0.0%) |
| Computers & Mathematics | 12 (100.0%) | 0 (0.0%) |
| Architecture & Engineering | 16 (100.0%) | 0 (0.0%) |
| Life, Physical & Social Science | 0 (0.0%) | 0 (0.0%) |
| Community & Social Service | 37 (45.7%) | 44 (54.3%) |
| Education, Arts & Media | 0 (0.0%) | 7 (100.0%) |
| Legal Services & Support | 0 (0.0%) | 0 (0.0%) |
| Education Instruction & Library | 24 (39.3%) | 37 (60.7%) |
| Arts, Media & Entertainment | 13 (100.0%) | 0 (0.0%) |
| Health Diagnosing & Treating | 5 (13.2%) | 33 (86.8%) |
| Health Technologists | 0 (0.0%) | 15 (100.0%) |
| Total (Category) | 115 (51.1%) | 110 (48.9%) |
| Total (Overall) | 392 (52.8%) | 350 (47.2%) |
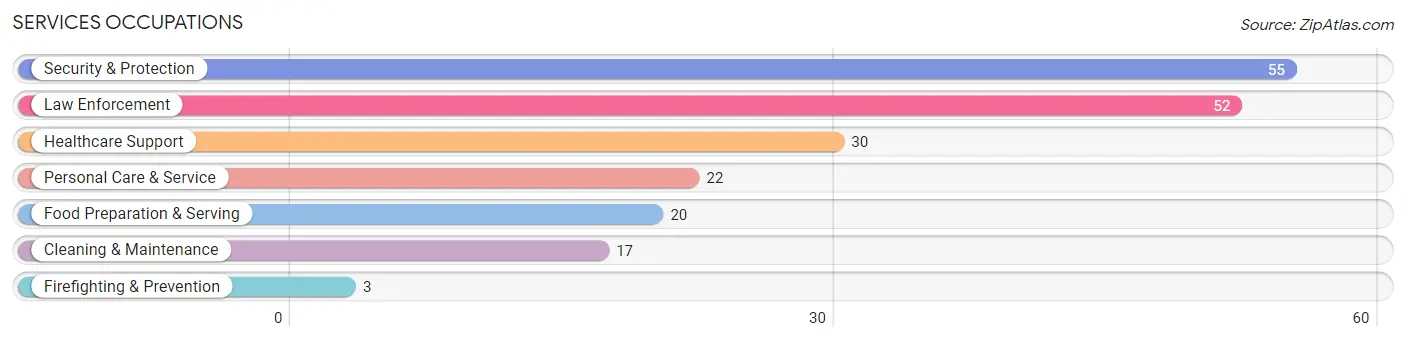
Services Occupations
The most common Services occupations in Hominy are Security & Protection (55 | 7.4%), Law Enforcement (52 | 7.0%), Healthcare Support (30 | 4.0%), Personal Care & Service (22 | 3.0%), and Food Preparation & Serving (20 | 2.7%).
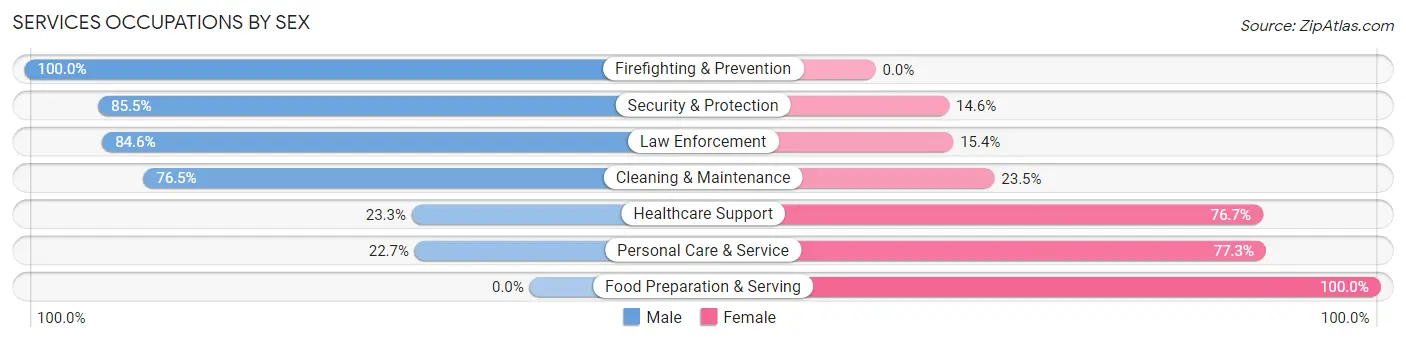
Services Occupations by Sex
Within the Services occupations in Hominy, the most male-oriented occupations are Firefighting & Prevention (100.0%), Security & Protection (85.5%), and Law Enforcement (84.6%), while the most female-oriented occupations are Food Preparation & Serving (100.0%), Personal Care & Service (77.3%), and Healthcare Support (76.7%).
| Occupation | Male | Female |
| Healthcare Support | 7 (23.3%) | 23 (76.7%) |
| Security & Protection | 47 (85.5%) | 8 (14.5%) |
| Firefighting & Prevention | 3 (100.0%) | 0 (0.0%) |
| Law Enforcement | 44 (84.6%) | 8 (15.4%) |
| Food Preparation & Serving | 0 (0.0%) | 20 (100.0%) |
| Cleaning & Maintenance | 13 (76.5%) | 4 (23.5%) |
| Personal Care & Service | 5 (22.7%) | 17 (77.3%) |
| Total (Category) | 72 (50.0%) | 72 (50.0%) |
| Total (Overall) | 392 (52.8%) | 350 (47.2%) |
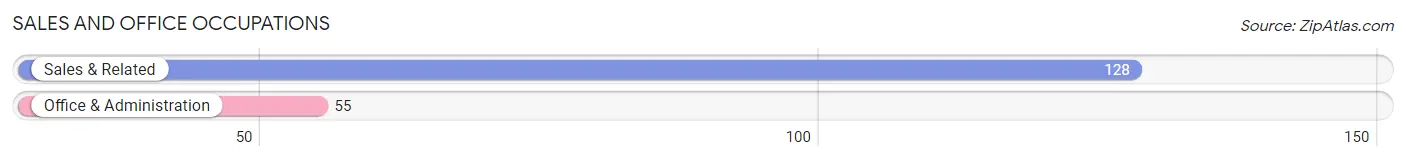
Sales and Office Occupations
The most common Sales and Office occupations in Hominy are Sales & Related (128 | 17.2%), and Office & Administration (55 | 7.4%).
Sales and Office Occupations by Sex
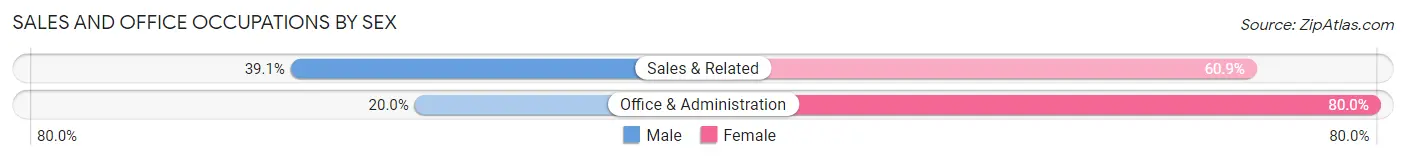
| Occupation | Male | Female |
| Sales & Related | 50 (39.1%) | 78 (60.9%) |
| Office & Administration | 11 (20.0%) | 44 (80.0%) |
| Total (Category) | 61 (33.3%) | 122 (66.7%) |
| Total (Overall) | 392 (52.8%) | 350 (47.2%) |
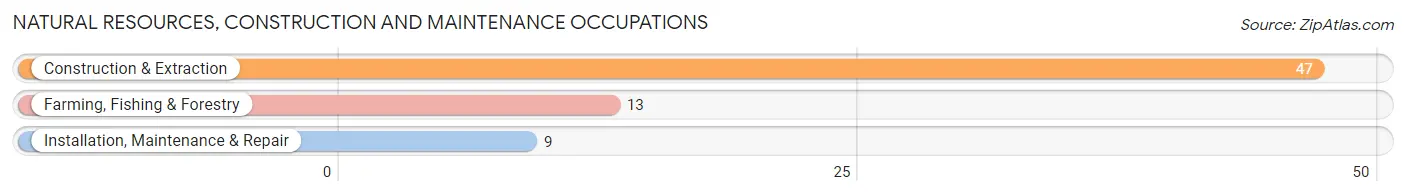
Natural Resources, Construction and Maintenance Occupations
The most common Natural Resources, Construction and Maintenance occupations in Hominy are Construction & Extraction (47 | 6.3%), Farming, Fishing & Forestry (13 | 1.8%), and Installation, Maintenance & Repair (9 | 1.2%).
Natural Resources, Construction and Maintenance Occupations by Sex
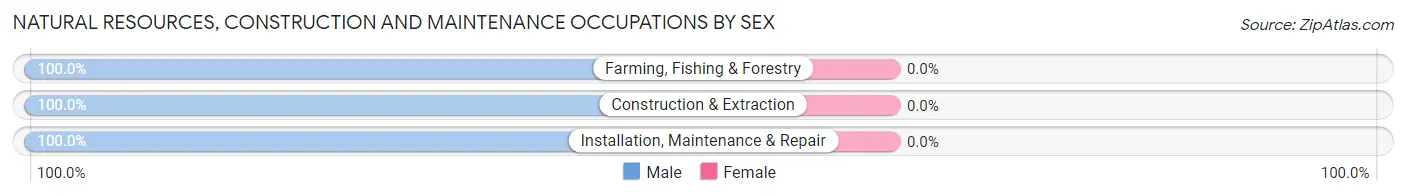
| Occupation | Male | Female |
| Farming, Fishing & Forestry | 13 (100.0%) | 0 (0.0%) |
| Construction & Extraction | 47 (100.0%) | 0 (0.0%) |
| Installation, Maintenance & Repair | 9 (100.0%) | 0 (0.0%) |
| Total (Category) | 69 (100.0%) | 0 (0.0%) |
| Total (Overall) | 392 (52.8%) | 350 (47.2%) |
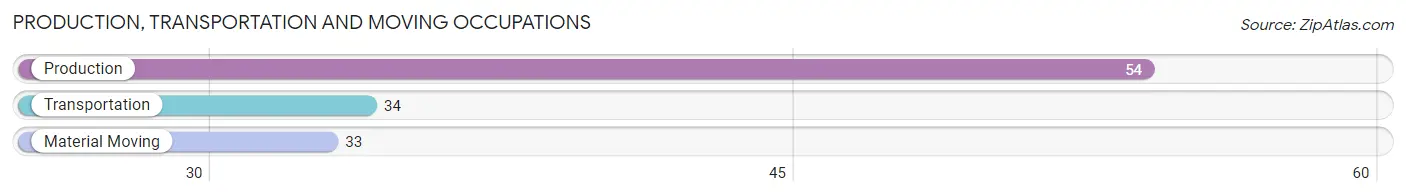
Production, Transportation and Moving Occupations
The most common Production, Transportation and Moving occupations in Hominy are Production (54 | 7.3%), Transportation (34 | 4.6%), and Material Moving (33 | 4.4%).
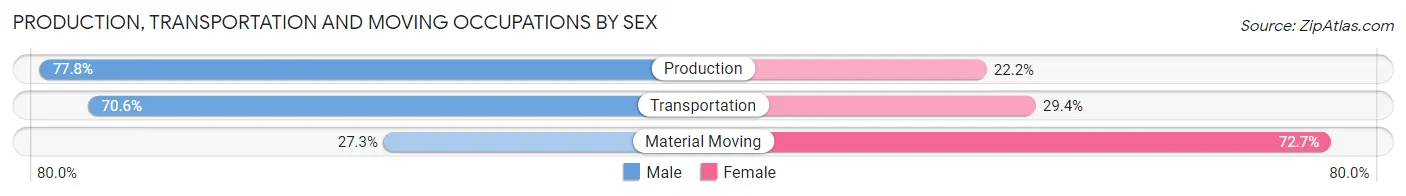
Production, Transportation and Moving Occupations by Sex
| Occupation | Male | Female |
| Production | 42 (77.8%) | 12 (22.2%) |
| Transportation | 24 (70.6%) | 10 (29.4%) |
| Material Moving | 9 (27.3%) | 24 (72.7%) |
| Total (Category) | 75 (62.0%) | 46 (38.0%) |
| Total (Overall) | 392 (52.8%) | 350 (47.2%) |
Employment Industries by Sex in Hominy
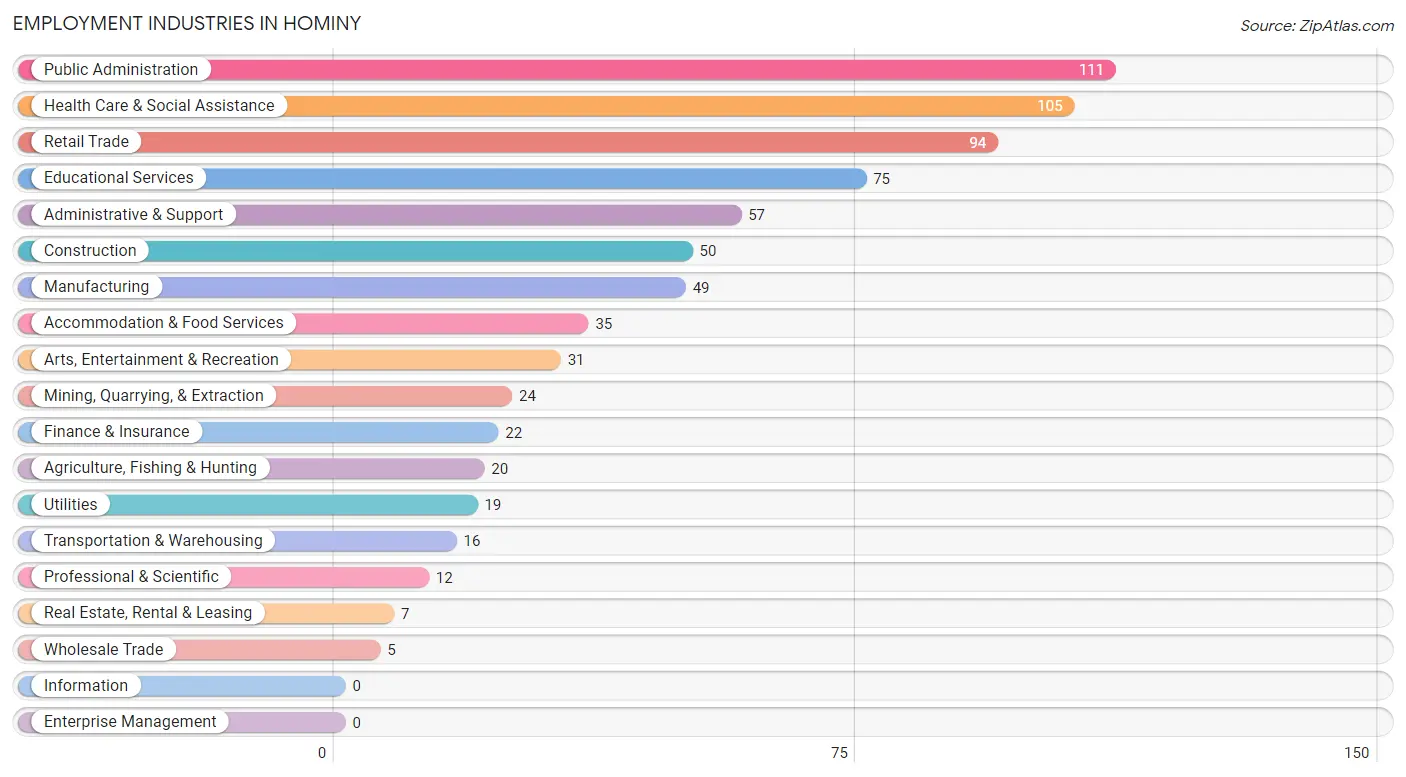
Employment Industries in Hominy
The major employment industries in Hominy include Public Administration (111 | 15.0%), Health Care & Social Assistance (105 | 14.1%), Retail Trade (94 | 12.7%), Educational Services (75 | 10.1%), and Administrative & Support (57 | 7.7%).
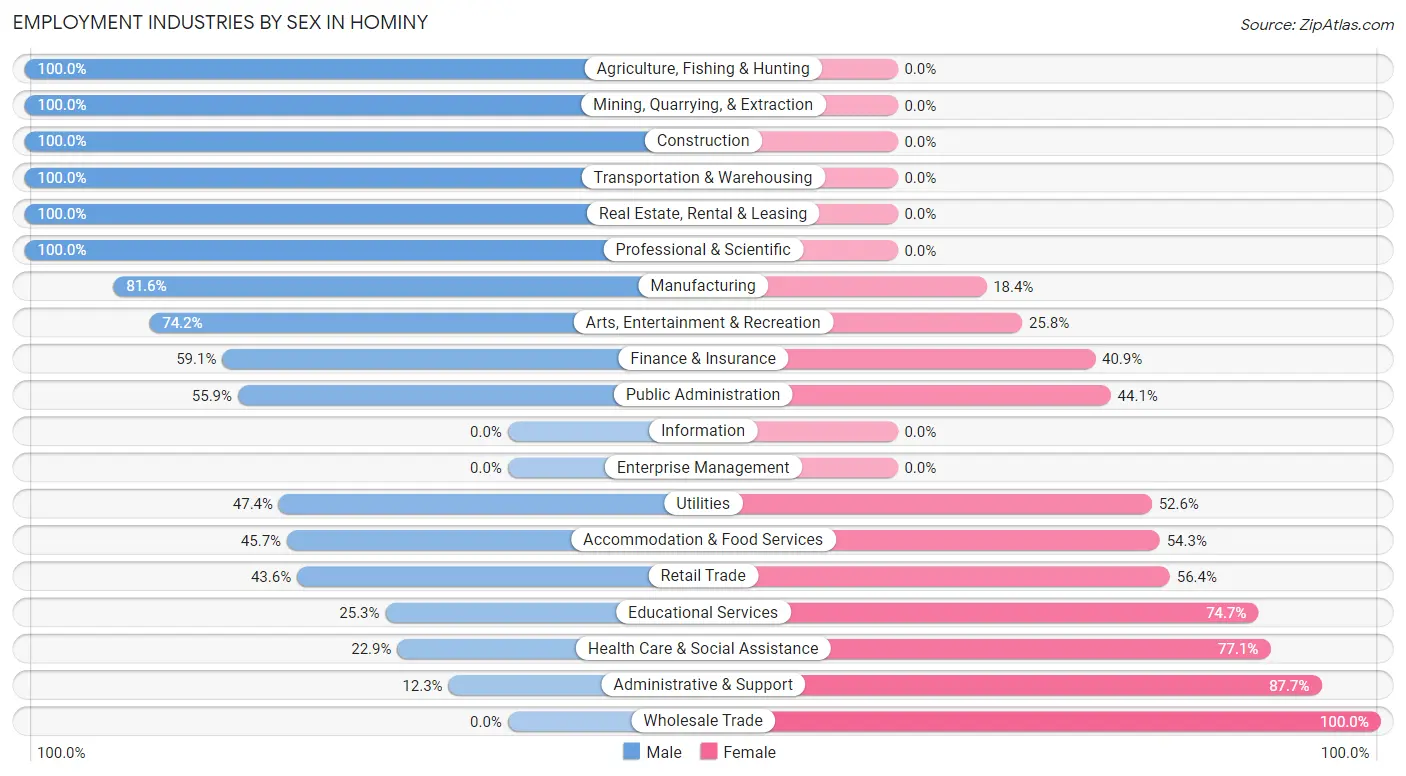
Employment Industries by Sex in Hominy
The Hominy industries that see more men than women are Agriculture, Fishing & Hunting (100.0%), Mining, Quarrying, & Extraction (100.0%), and Construction (100.0%), whereas the industries that tend to have a higher number of women are Wholesale Trade (100.0%), Administrative & Support (87.7%), and Health Care & Social Assistance (77.1%).
| Industry | Male | Female |
| Agriculture, Fishing & Hunting | 20 (100.0%) | 0 (0.0%) |
| Mining, Quarrying, & Extraction | 24 (100.0%) | 0 (0.0%) |
| Construction | 50 (100.0%) | 0 (0.0%) |
| Manufacturing | 40 (81.6%) | 9 (18.4%) |
| Wholesale Trade | 0 (0.0%) | 5 (100.0%) |
| Retail Trade | 41 (43.6%) | 53 (56.4%) |
| Transportation & Warehousing | 16 (100.0%) | 0 (0.0%) |
| Utilities | 9 (47.4%) | 10 (52.6%) |
| Information | 0 (0.0%) | 0 (0.0%) |
| Finance & Insurance | 13 (59.1%) | 9 (40.9%) |
| Real Estate, Rental & Leasing | 7 (100.0%) | 0 (0.0%) |
| Professional & Scientific | 12 (100.0%) | 0 (0.0%) |
| Enterprise Management | 0 (0.0%) | 0 (0.0%) |
| Administrative & Support | 7 (12.3%) | 50 (87.7%) |
| Educational Services | 19 (25.3%) | 56 (74.7%) |
| Health Care & Social Assistance | 24 (22.9%) | 81 (77.1%) |
| Arts, Entertainment & Recreation | 23 (74.2%) | 8 (25.8%) |
| Accommodation & Food Services | 16 (45.7%) | 19 (54.3%) |
| Public Administration | 62 (55.9%) | 49 (44.1%) |
| Total | 392 (52.8%) | 350 (47.2%) |
Education in Hominy
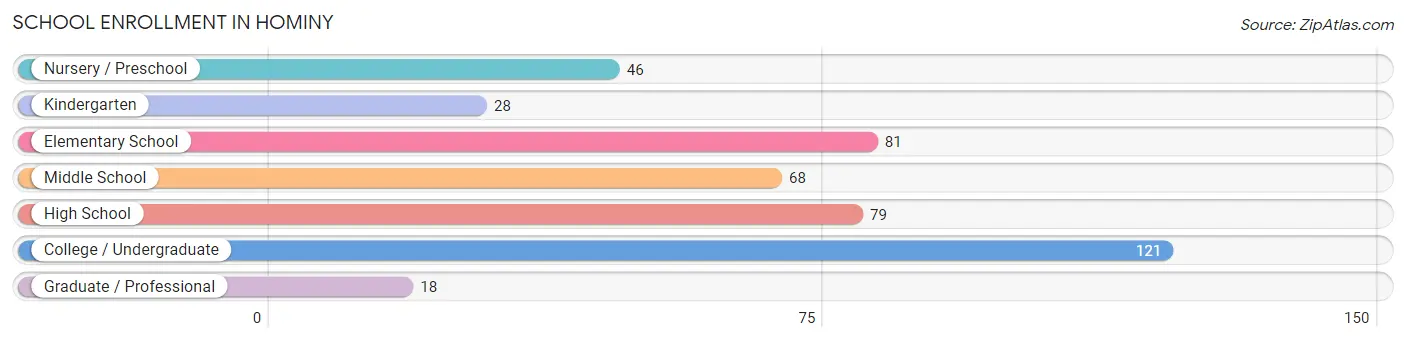
School Enrollment in Hominy
The most common levels of schooling among the 441 students in Hominy are college / undergraduate (121 | 27.4%), elementary school (81 | 18.4%), and high school (79 | 17.9%).
| School Level | # Students | % Students |
| Nursery / Preschool | 46 | 10.4% |
| Kindergarten | 28 | 6.4% |
| Elementary School | 81 | 18.4% |
| Middle School | 68 | 15.4% |
| High School | 79 | 17.9% |
| College / Undergraduate | 121 | 27.4% |
| Graduate / Professional | 18 | 4.1% |
| Total | 441 | 100.0% |
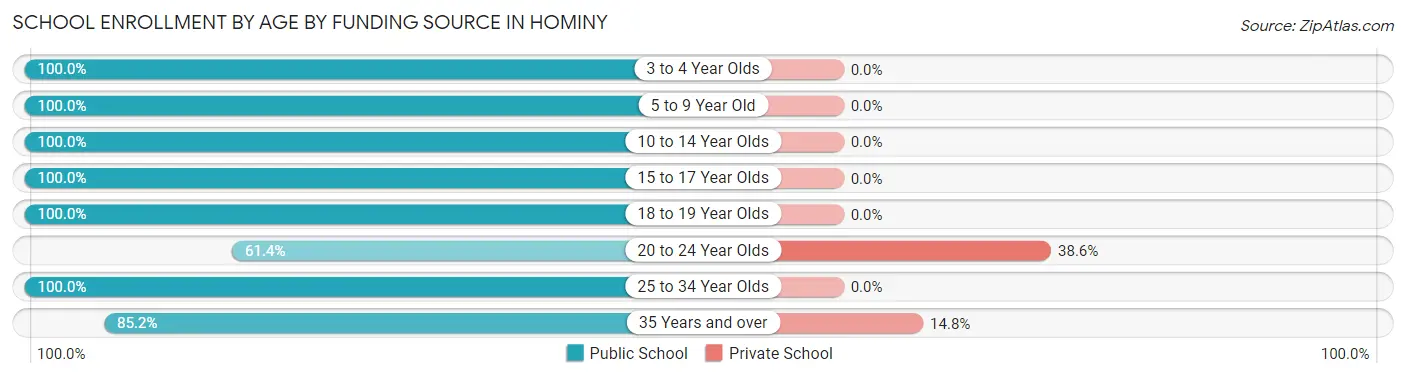
School Enrollment by Age by Funding Source in Hominy
Out of a total of 441 students who are enrolled in schools in Hominy, 25 (5.7%) attend a private institution, while the remaining 416 (94.3%) are enrolled in public schools. The age group of 20 to 24 year olds has the highest likelihood of being enrolled in private schools, with 17 (38.6% in the age bracket) enrolled. Conversely, the age group of 3 to 4 year olds has the lowest likelihood of being enrolled in a private school, with 46 (100.0% in the age bracket) attending a public institution.
| Age Bracket | Public School | Private School |
| 3 to 4 Year Olds | 46 (100.0%) | 0 (0.0%) |
| 5 to 9 Year Old | 84 (100.0%) | 0 (0.0%) |
| 10 to 14 Year Olds | 90 (100.0%) | 0 (0.0%) |
| 15 to 17 Year Olds | 61 (100.0%) | 0 (0.0%) |
| 18 to 19 Year Olds | 10 (100.0%) | 0 (0.0%) |
| 20 to 24 Year Olds | 27 (61.4%) | 17 (38.6%) |
| 25 to 34 Year Olds | 52 (100.0%) | 0 (0.0%) |
| 35 Years and over | 46 (85.2%) | 8 (14.8%) |
| Total | 416 (94.3%) | 25 (5.7%) |
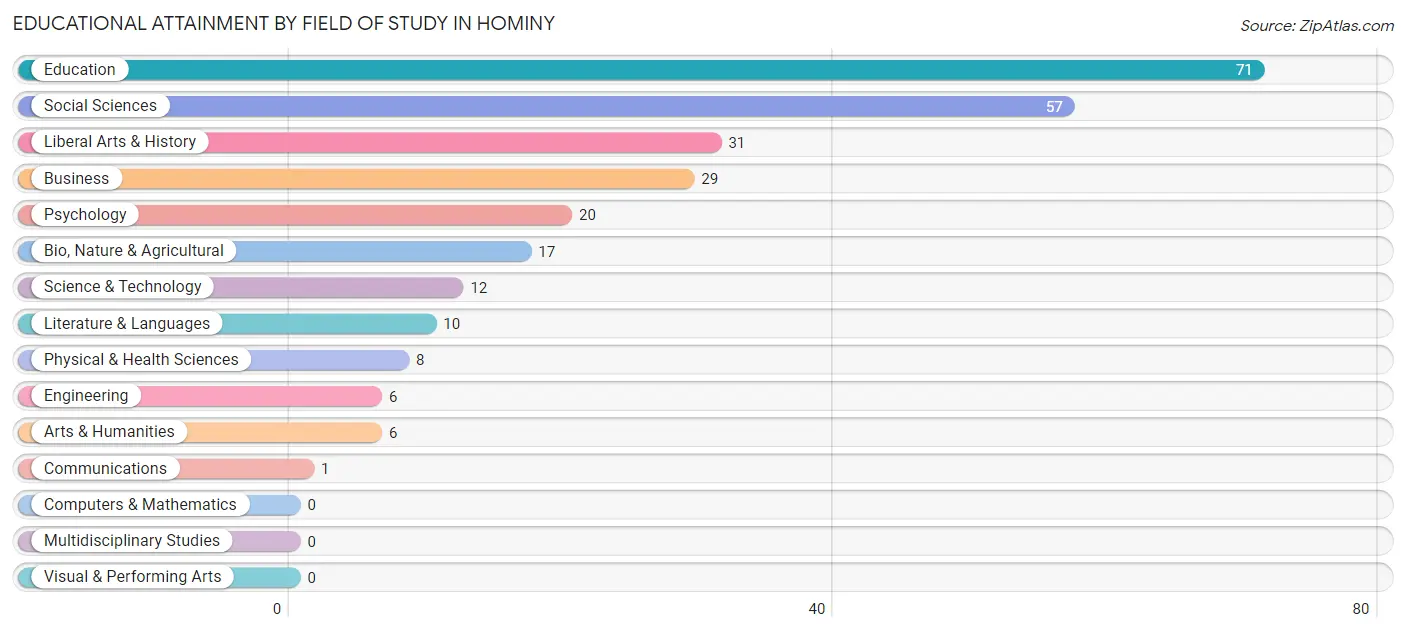
Educational Attainment by Field of Study in Hominy
Education (71 | 26.5%), social sciences (57 | 21.3%), liberal arts & history (31 | 11.6%), business (29 | 10.8%), and psychology (20 | 7.5%) are the most common fields of study among 268 individuals in Hominy who have obtained a bachelor's degree or higher.
| Field of Study | # Graduates | % Graduates |
| Computers & Mathematics | 0 | 0.0% |
| Bio, Nature & Agricultural | 17 | 6.3% |
| Physical & Health Sciences | 8 | 3.0% |
| Psychology | 20 | 7.5% |
| Social Sciences | 57 | 21.3% |
| Engineering | 6 | 2.2% |
| Multidisciplinary Studies | 0 | 0.0% |
| Science & Technology | 12 | 4.5% |
| Business | 29 | 10.8% |
| Education | 71 | 26.5% |
| Literature & Languages | 10 | 3.7% |
| Liberal Arts & History | 31 | 11.6% |
| Visual & Performing Arts | 0 | 0.0% |
| Communications | 1 | 0.4% |
| Arts & Humanities | 6 | 2.2% |
| Total | 268 | 100.0% |
Transportation & Commute in Hominy
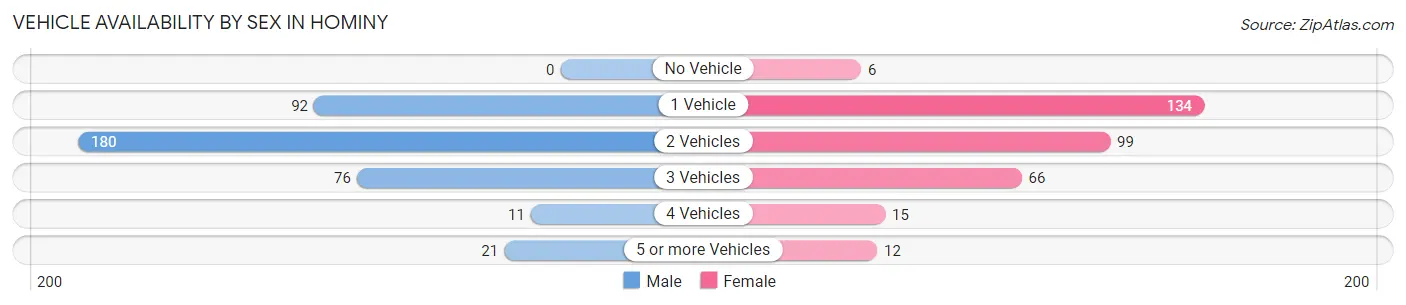
Vehicle Availability by Sex in Hominy
The most prevalent vehicle ownership categories in Hominy are males with 2 vehicles (180, accounting for 47.4%) and females with 2 vehicles (99, making up 54.2%).
| Vehicles Available | Male | Female |
| No Vehicle | 0 (0.0%) | 6 (1.8%) |
| 1 Vehicle | 92 (24.2%) | 134 (40.4%) |
| 2 Vehicles | 180 (47.4%) | 99 (29.8%) |
| 3 Vehicles | 76 (20.0%) | 66 (19.9%) |
| 4 Vehicles | 11 (2.9%) | 15 (4.5%) |
| 5 or more Vehicles | 21 (5.5%) | 12 (3.6%) |
| Total | 380 (100.0%) | 332 (100.0%) |
Commute Time in Hominy
The most frequently occuring commute durations in Hominy are 5 to 9 minutes (161 commuters, 22.9%), 20 to 24 minutes (87 commuters, 12.4%), and 15 to 19 minutes (83 commuters, 11.8%).
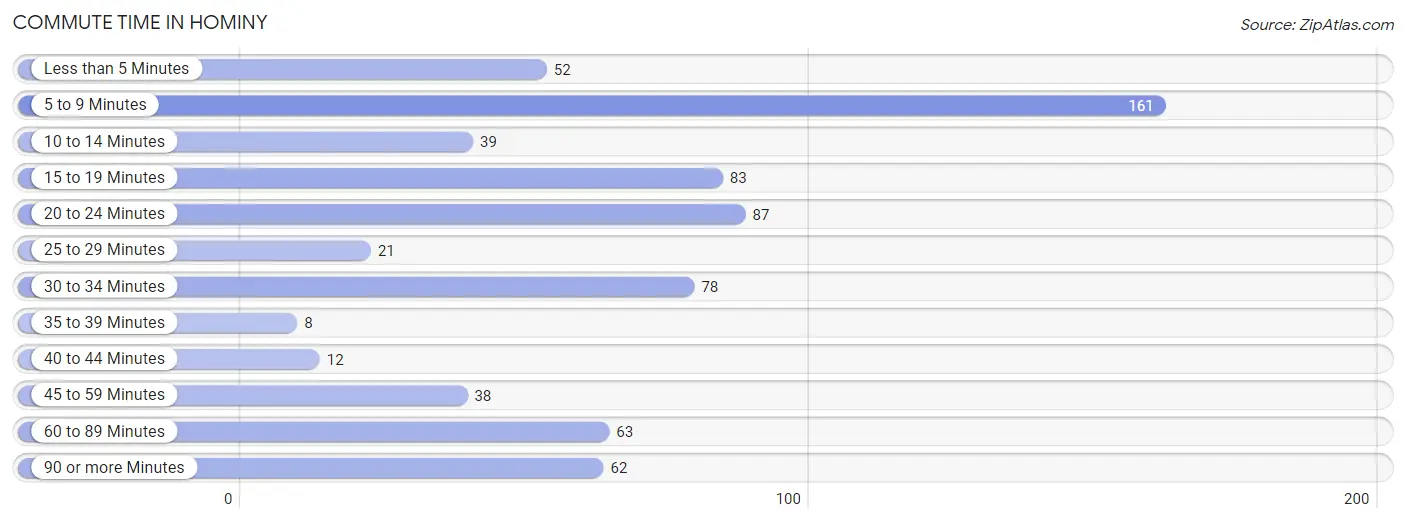
| Commute Time | # Commuters | % Commuters |
| Less than 5 Minutes | 52 | 7.4% |
| 5 to 9 Minutes | 161 | 22.9% |
| 10 to 14 Minutes | 39 | 5.5% |
| 15 to 19 Minutes | 83 | 11.8% |
| 20 to 24 Minutes | 87 | 12.4% |
| 25 to 29 Minutes | 21 | 3.0% |
| 30 to 34 Minutes | 78 | 11.1% |
| 35 to 39 Minutes | 8 | 1.1% |
| 40 to 44 Minutes | 12 | 1.7% |
| 45 to 59 Minutes | 38 | 5.4% |
| 60 to 89 Minutes | 63 | 8.9% |
| 90 or more Minutes | 62 | 8.8% |
Commute Time by Sex in Hominy
The most common commute times in Hominy are 5 to 9 minutes (72 commuters, 19.3%) for males and 5 to 9 minutes (89 commuters, 26.9%) for females.
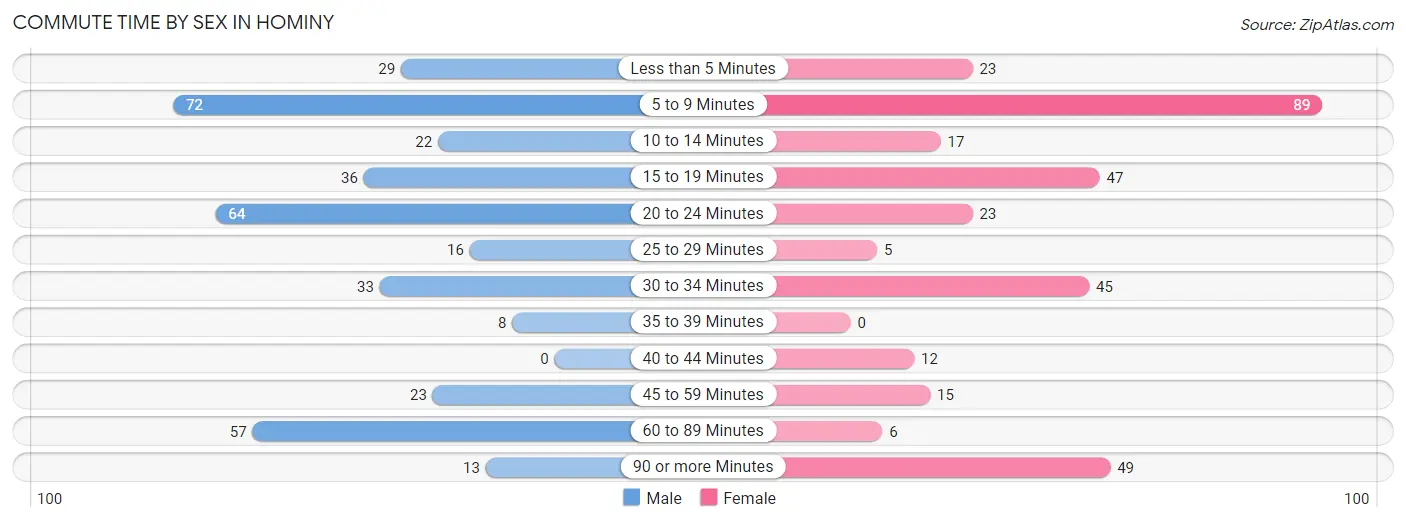
| Commute Time | Male | Female |
| Less than 5 Minutes | 29 (7.8%) | 23 (7.0%) |
| 5 to 9 Minutes | 72 (19.3%) | 89 (26.9%) |
| 10 to 14 Minutes | 22 (5.9%) | 17 (5.1%) |
| 15 to 19 Minutes | 36 (9.7%) | 47 (14.2%) |
| 20 to 24 Minutes | 64 (17.2%) | 23 (7.0%) |
| 25 to 29 Minutes | 16 (4.3%) | 5 (1.5%) |
| 30 to 34 Minutes | 33 (8.8%) | 45 (13.6%) |
| 35 to 39 Minutes | 8 (2.1%) | 0 (0.0%) |
| 40 to 44 Minutes | 0 (0.0%) | 12 (3.6%) |
| 45 to 59 Minutes | 23 (6.2%) | 15 (4.5%) |
| 60 to 89 Minutes | 57 (15.3%) | 6 (1.8%) |
| 90 or more Minutes | 13 (3.5%) | 49 (14.8%) |
Time of Departure to Work by Sex in Hominy
The most frequent times of departure to work in Hominy are 5:00 AM to 5:29 AM (68, 18.2%) for males and 8:30 AM to 8:59 AM (71, 21.4%) for females.
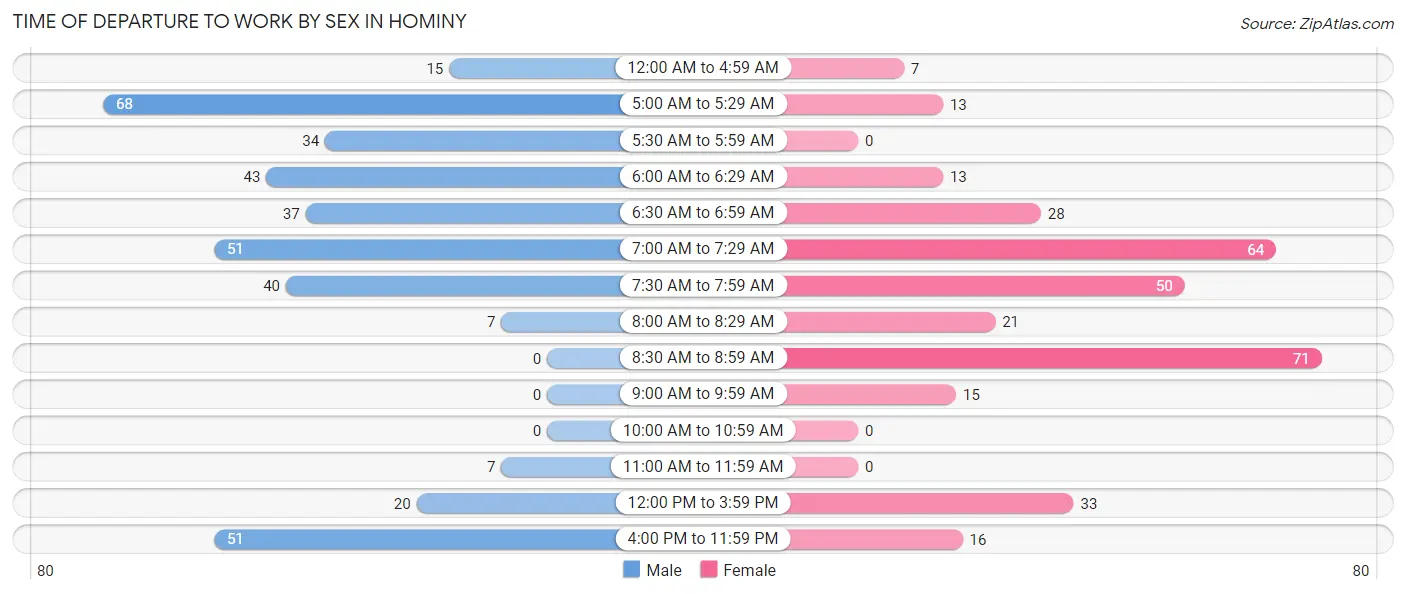
| Time of Departure | Male | Female |
| 12:00 AM to 4:59 AM | 15 (4.0%) | 7 (2.1%) |
| 5:00 AM to 5:29 AM | 68 (18.2%) | 13 (3.9%) |
| 5:30 AM to 5:59 AM | 34 (9.1%) | 0 (0.0%) |
| 6:00 AM to 6:29 AM | 43 (11.5%) | 13 (3.9%) |
| 6:30 AM to 6:59 AM | 37 (9.9%) | 28 (8.5%) |
| 7:00 AM to 7:29 AM | 51 (13.7%) | 64 (19.3%) |
| 7:30 AM to 7:59 AM | 40 (10.7%) | 50 (15.1%) |
| 8:00 AM to 8:29 AM | 7 (1.9%) | 21 (6.3%) |
| 8:30 AM to 8:59 AM | 0 (0.0%) | 71 (21.4%) |
| 9:00 AM to 9:59 AM | 0 (0.0%) | 15 (4.5%) |
| 10:00 AM to 10:59 AM | 0 (0.0%) | 0 (0.0%) |
| 11:00 AM to 11:59 AM | 7 (1.9%) | 0 (0.0%) |
| 12:00 PM to 3:59 PM | 20 (5.4%) | 33 (10.0%) |
| 4:00 PM to 11:59 PM | 51 (13.7%) | 16 (4.8%) |
| Total | 373 (100.0%) | 331 (100.0%) |
Housing Occupancy in Hominy
Occupancy by Ownership in Hominy
Of the total 957 dwellings in Hominy, owner-occupied units account for 646 (67.5%), while renter-occupied units make up 311 (32.5%).
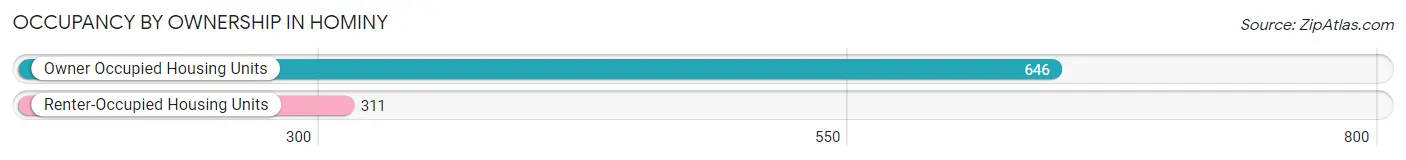
| Occupancy | # Housing Units | % Housing Units |
| Owner Occupied Housing Units | 646 | 67.5% |
| Renter-Occupied Housing Units | 311 | 32.5% |
| Total Occupied Housing Units | 957 | 100.0% |
Occupancy by Household Size in Hominy
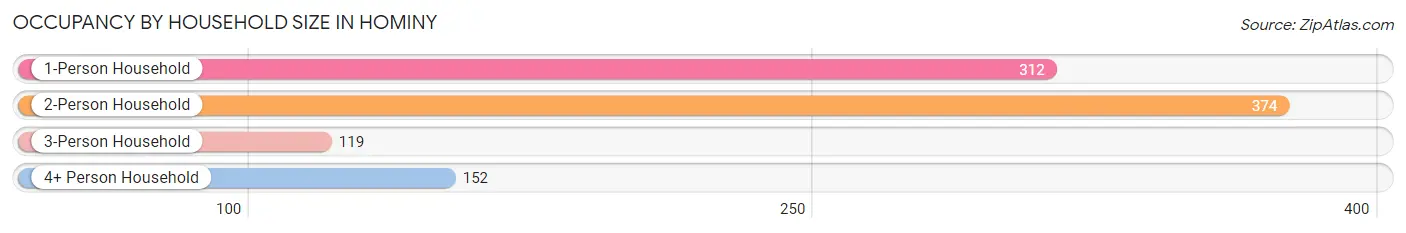
| Household Size | # Housing Units | % Housing Units |
| 1-Person Household | 312 | 32.6% |
| 2-Person Household | 374 | 39.1% |
| 3-Person Household | 119 | 12.4% |
| 4+ Person Household | 152 | 15.9% |
| Total Housing Units | 957 | 100.0% |
Occupancy by Ownership by Household Size in Hominy
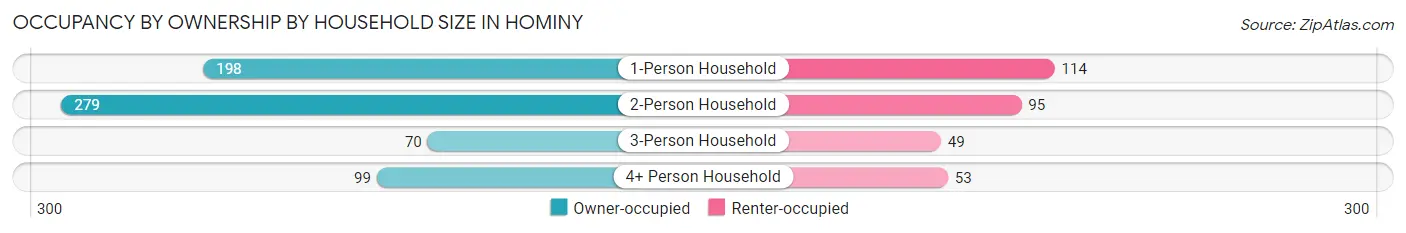
| Household Size | Owner-occupied | Renter-occupied |
| 1-Person Household | 198 (63.5%) | 114 (36.5%) |
| 2-Person Household | 279 (74.6%) | 95 (25.4%) |
| 3-Person Household | 70 (58.8%) | 49 (41.2%) |
| 4+ Person Household | 99 (65.1%) | 53 (34.9%) |
| Total Housing Units | 646 (67.5%) | 311 (32.5%) |
Occupancy by Educational Attainment in Hominy
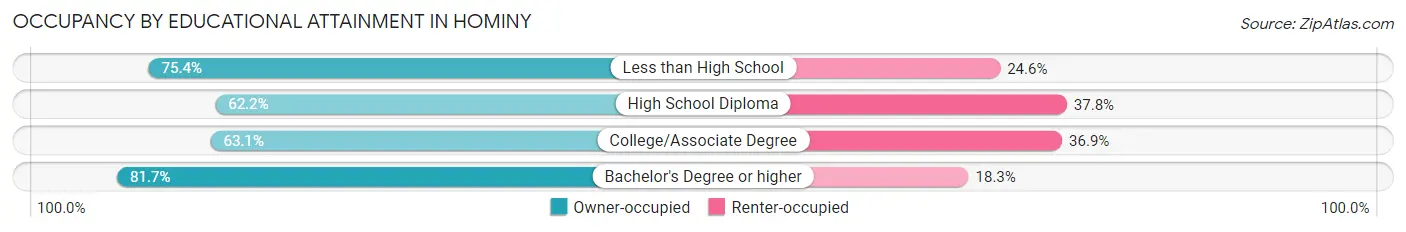
| Household Size | Owner-occupied | Renter-occupied |
| Less than High School | 141 (75.4%) | 46 (24.6%) |
| High School Diploma | 217 (62.2%) | 132 (37.8%) |
| College/Associate Degree | 190 (63.1%) | 111 (36.9%) |
| Bachelor's Degree or higher | 98 (81.7%) | 22 (18.3%) |
Occupancy by Age of Householder in Hominy
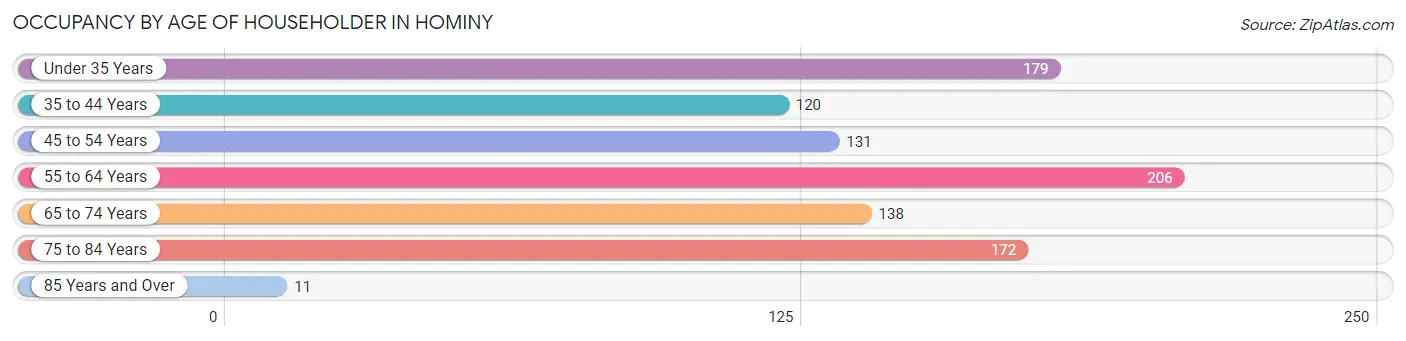
| Age Bracket | # Households | % Households |
| Under 35 Years | 179 | 18.7% |
| 35 to 44 Years | 120 | 12.5% |
| 45 to 54 Years | 131 | 13.7% |
| 55 to 64 Years | 206 | 21.5% |
| 65 to 74 Years | 138 | 14.4% |
| 75 to 84 Years | 172 | 18.0% |
| 85 Years and Over | 11 | 1.1% |
| Total | 957 | 100.0% |
Housing Finances in Hominy
Median Income by Occupancy in Hominy
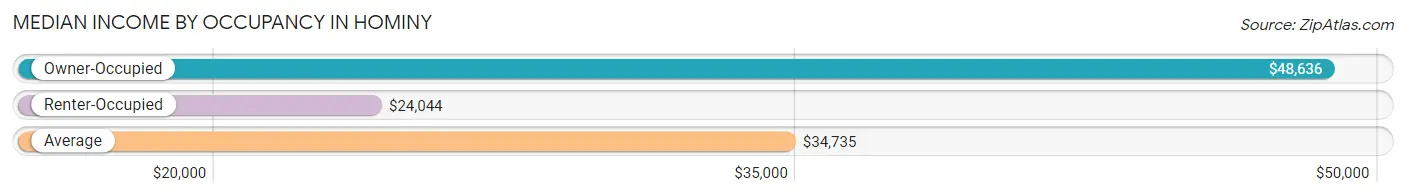
| Occupancy Type | # Households | Median Income |
| Owner-Occupied | 646 (67.5%) | $48,636 |
| Renter-Occupied | 311 (32.5%) | $24,044 |
| Average | 957 (100.0%) | $34,735 |
Occupancy by Householder Income Bracket in Hominy
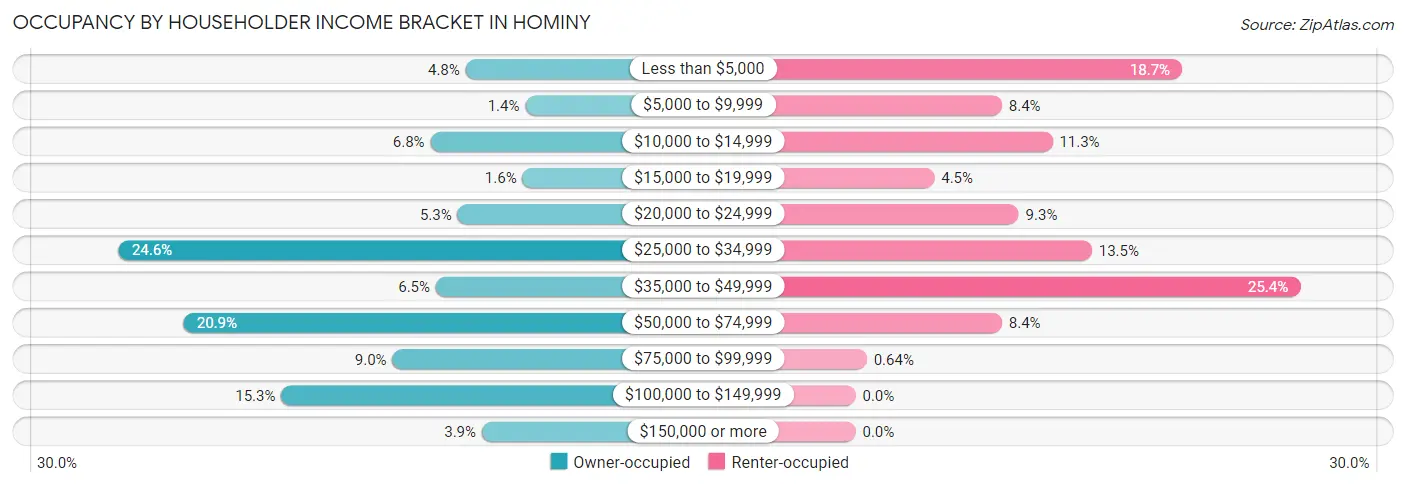
| Income Bracket | Owner-occupied | Renter-occupied |
| Less than $5,000 | 31 (4.8%) | 58 (18.6%) |
| $5,000 to $9,999 | 9 (1.4%) | 26 (8.4%) |
| $10,000 to $14,999 | 44 (6.8%) | 35 (11.3%) |
| $15,000 to $19,999 | 10 (1.5%) | 14 (4.5%) |
| $20,000 to $24,999 | 34 (5.3%) | 29 (9.3%) |
| $25,000 to $34,999 | 159 (24.6%) | 42 (13.5%) |
| $35,000 to $49,999 | 42 (6.5%) | 79 (25.4%) |
| $50,000 to $74,999 | 135 (20.9%) | 26 (8.4%) |
| $75,000 to $99,999 | 58 (9.0%) | 2 (0.6%) |
| $100,000 to $149,999 | 99 (15.3%) | 0 (0.0%) |
| $150,000 or more | 25 (3.9%) | 0 (0.0%) |
| Total | 646 (100.0%) | 311 (100.0%) |
Monthly Housing Cost Tiers in Hominy
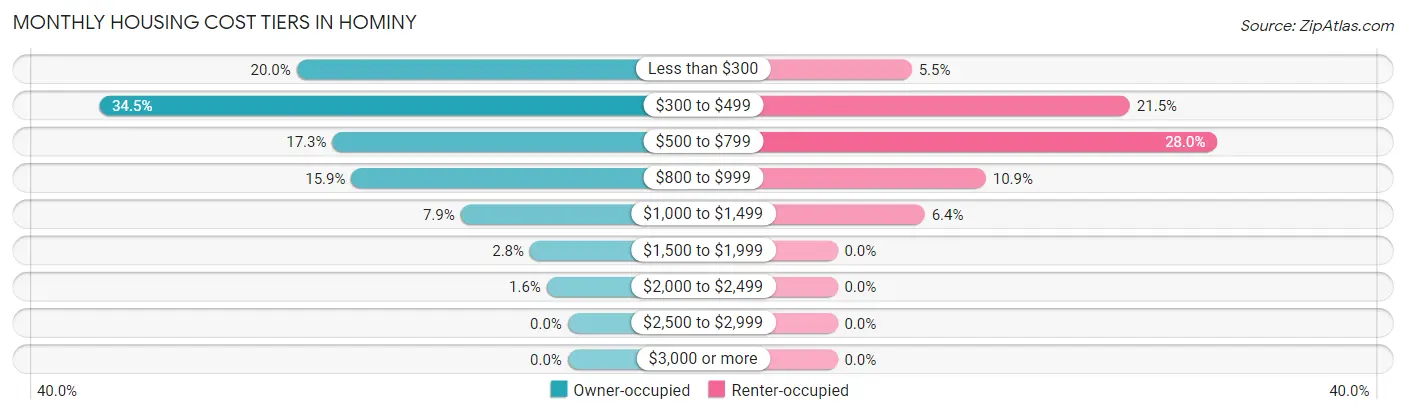
| Monthly Cost | Owner-occupied | Renter-occupied |
| Less than $300 | 129 (20.0%) | 17 (5.5%) |
| $300 to $499 | 223 (34.5%) | 67 (21.5%) |
| $500 to $799 | 112 (17.3%) | 87 (28.0%) |
| $800 to $999 | 103 (15.9%) | 34 (10.9%) |
| $1,000 to $1,499 | 51 (7.9%) | 20 (6.4%) |
| $1,500 to $1,999 | 18 (2.8%) | 0 (0.0%) |
| $2,000 to $2,499 | 10 (1.5%) | 0 (0.0%) |
| $2,500 to $2,999 | 0 (0.0%) | 0 (0.0%) |
| $3,000 or more | 0 (0.0%) | 0 (0.0%) |
| Total | 646 (100.0%) | 311 (100.0%) |
Physical Housing Characteristics in Hominy
Housing Structures in Hominy
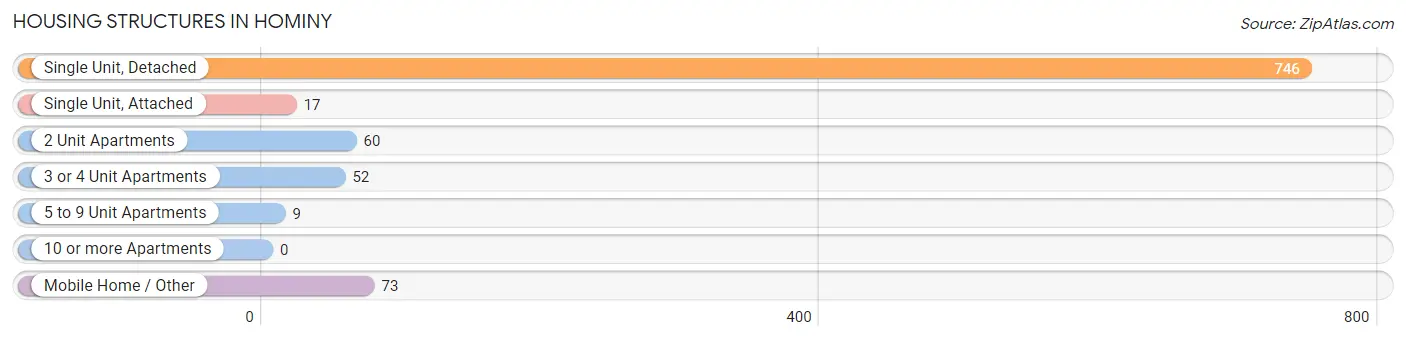
| Structure Type | # Housing Units | % Housing Units |
| Single Unit, Detached | 746 | 77.9% |
| Single Unit, Attached | 17 | 1.8% |
| 2 Unit Apartments | 60 | 6.3% |
| 3 or 4 Unit Apartments | 52 | 5.4% |
| 5 to 9 Unit Apartments | 9 | 0.9% |
| 10 or more Apartments | 0 | 0.0% |
| Mobile Home / Other | 73 | 7.6% |
| Total | 957 | 100.0% |
Housing Structures by Occupancy in Hominy
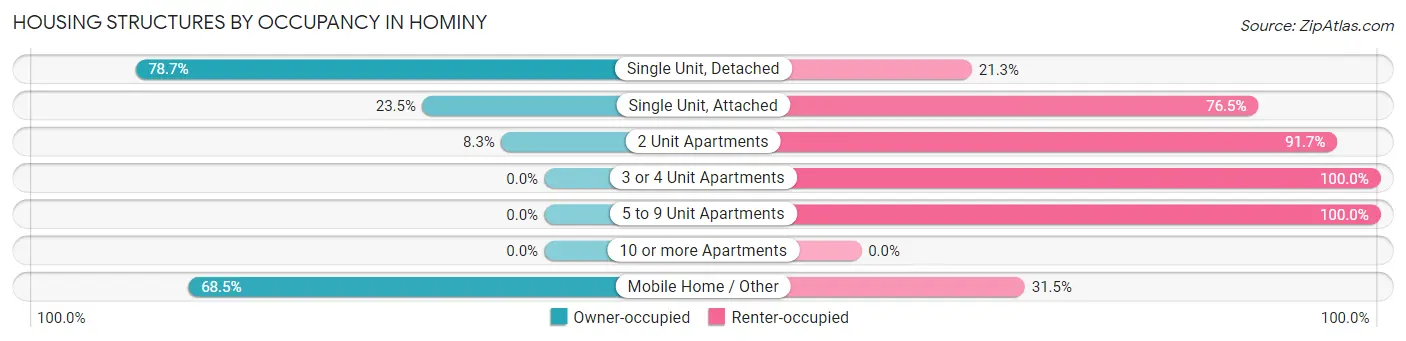
| Structure Type | Owner-occupied | Renter-occupied |
| Single Unit, Detached | 587 (78.7%) | 159 (21.3%) |
| Single Unit, Attached | 4 (23.5%) | 13 (76.5%) |
| 2 Unit Apartments | 5 (8.3%) | 55 (91.7%) |
| 3 or 4 Unit Apartments | 0 (0.0%) | 52 (100.0%) |
| 5 to 9 Unit Apartments | 0 (0.0%) | 9 (100.0%) |
| 10 or more Apartments | 0 (0.0%) | 0 (0.0%) |
| Mobile Home / Other | 50 (68.5%) | 23 (31.5%) |
| Total | 646 (67.5%) | 311 (32.5%) |
Housing Structures by Number of Rooms in Hominy
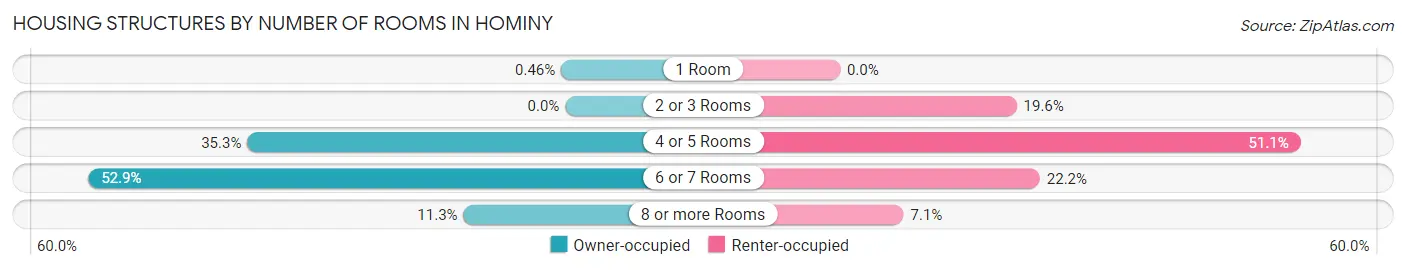
| Number of Rooms | Owner-occupied | Renter-occupied |
| 1 Room | 3 (0.5%) | 0 (0.0%) |
| 2 or 3 Rooms | 0 (0.0%) | 61 (19.6%) |
| 4 or 5 Rooms | 228 (35.3%) | 159 (51.1%) |
| 6 or 7 Rooms | 342 (52.9%) | 69 (22.2%) |
| 8 or more Rooms | 73 (11.3%) | 22 (7.1%) |
| Total | 646 (100.0%) | 311 (100.0%) |
Housing Structure by Heating Type in Hominy
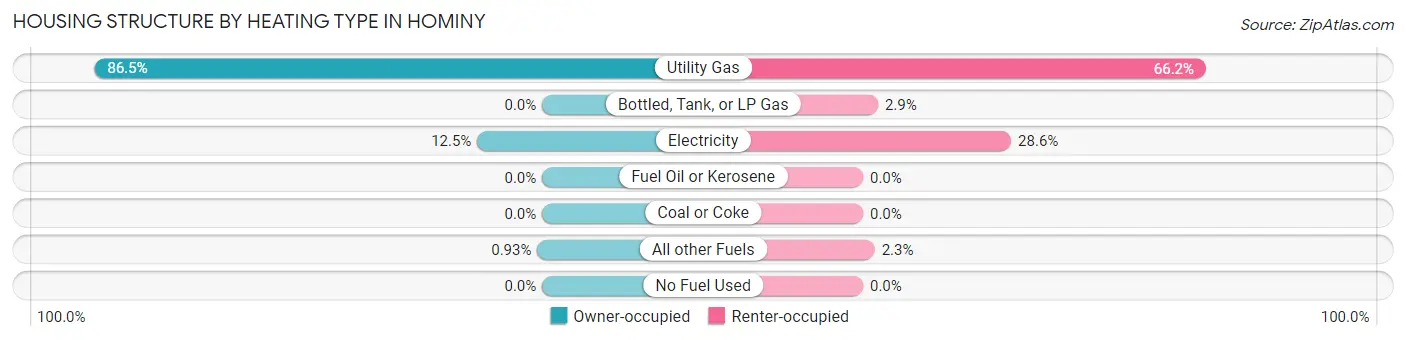
| Heating Type | Owner-occupied | Renter-occupied |
| Utility Gas | 559 (86.5%) | 206 (66.2%) |
| Bottled, Tank, or LP Gas | 0 (0.0%) | 9 (2.9%) |
| Electricity | 81 (12.5%) | 89 (28.6%) |
| Fuel Oil or Kerosene | 0 (0.0%) | 0 (0.0%) |
| Coal or Coke | 0 (0.0%) | 0 (0.0%) |
| All other Fuels | 6 (0.9%) | 7 (2.2%) |
| No Fuel Used | 0 (0.0%) | 0 (0.0%) |
| Total | 646 (100.0%) | 311 (100.0%) |
Household Vehicle Usage in Hominy
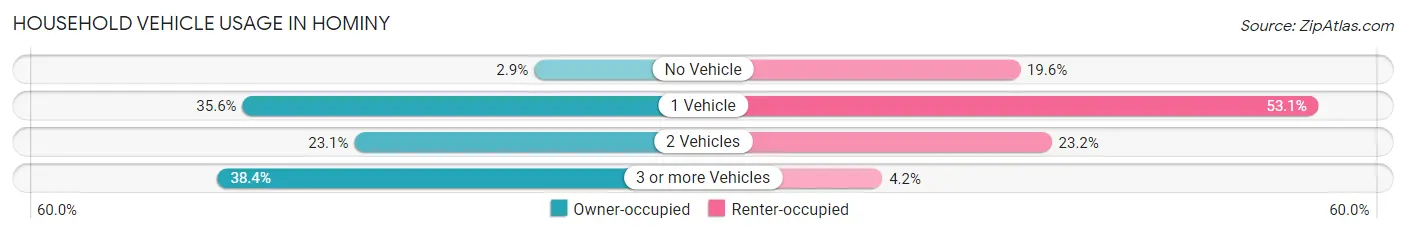
| Vehicles per Household | Owner-occupied | Renter-occupied |
| No Vehicle | 19 (2.9%) | 61 (19.6%) |
| 1 Vehicle | 230 (35.6%) | 165 (53.0%) |
| 2 Vehicles | 149 (23.1%) | 72 (23.2%) |
| 3 or more Vehicles | 248 (38.4%) | 13 (4.2%) |
| Total | 646 (100.0%) | 311 (100.0%) |
Real Estate & Mortgages in Hominy
Real Estate and Mortgage Overview in Hominy
| Characteristic | Without Mortgage | With Mortgage |
| Housing Units | 405 | 241 |
| Median Property Value | $56,700 | $94,600 |
| Median Household Income | $34,565 | $15 |
| Monthly Housing Costs | $370 | $0 |
| Real Estate Taxes | $414 | $17 |
Property Value by Mortgage Status in Hominy
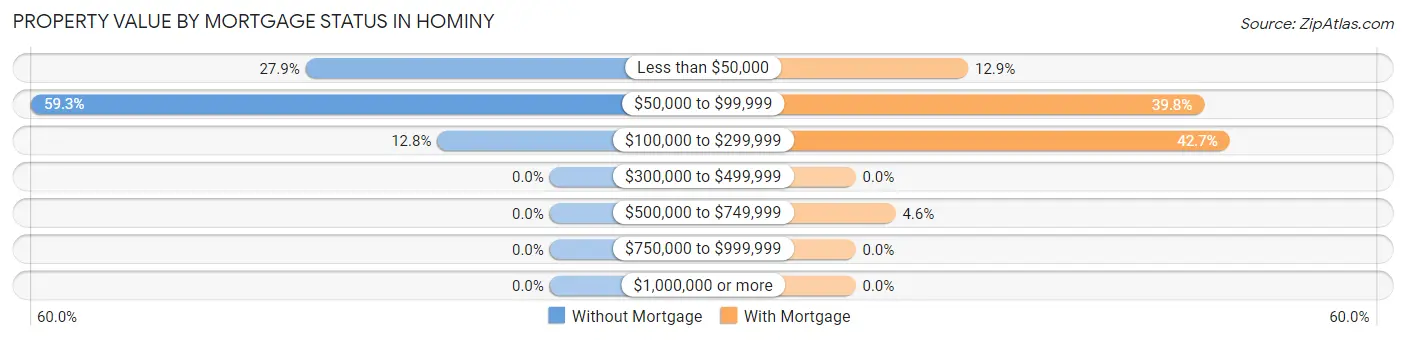
| Property Value | Without Mortgage | With Mortgage |
| Less than $50,000 | 113 (27.9%) | 31 (12.9%) |
| $50,000 to $99,999 | 240 (59.3%) | 96 (39.8%) |
| $100,000 to $299,999 | 52 (12.8%) | 103 (42.7%) |
| $300,000 to $499,999 | 0 (0.0%) | 0 (0.0%) |
| $500,000 to $749,999 | 0 (0.0%) | 11 (4.6%) |
| $750,000 to $999,999 | 0 (0.0%) | 0 (0.0%) |
| $1,000,000 or more | 0 (0.0%) | 0 (0.0%) |
| Total | 405 (100.0%) | 241 (100.0%) |
Household Income by Mortgage Status in Hominy
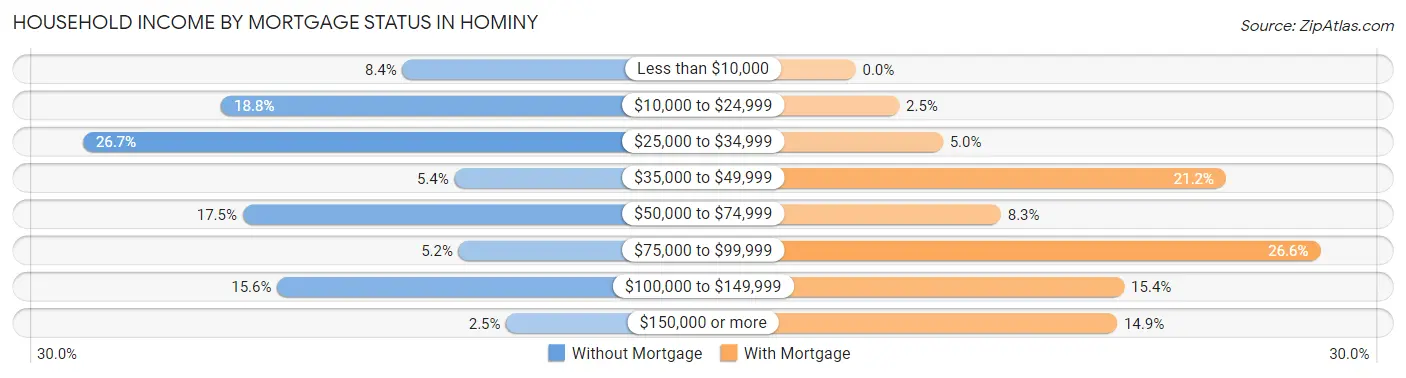
| Household Income | Without Mortgage | With Mortgage |
| Less than $10,000 | 34 (8.4%) | 0 (0.0%) |
| $10,000 to $24,999 | 76 (18.8%) | 6 (2.5%) |
| $25,000 to $34,999 | 108 (26.7%) | 12 (5.0%) |
| $35,000 to $49,999 | 22 (5.4%) | 51 (21.2%) |
| $50,000 to $74,999 | 71 (17.5%) | 20 (8.3%) |
| $75,000 to $99,999 | 21 (5.2%) | 64 (26.6%) |
| $100,000 to $149,999 | 63 (15.6%) | 37 (15.3%) |
| $150,000 or more | 10 (2.5%) | 36 (14.9%) |
| Total | 405 (100.0%) | 241 (100.0%) |
Property Value to Household Income Ratio in Hominy
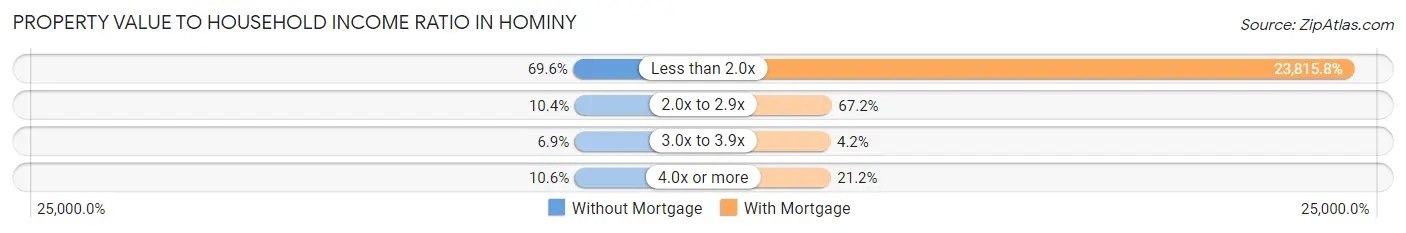
| Value-to-Income Ratio | Without Mortgage | With Mortgage |
| Less than 2.0x | 282 (69.6%) | 57,396 (23,815.8%) |
| 2.0x to 2.9x | 42 (10.4%) | 162 (67.2%) |
| 3.0x to 3.9x | 28 (6.9%) | 10 (4.2%) |
| 4.0x or more | 43 (10.6%) | 51 (21.2%) |
| Total | 405 (100.0%) | 241 (100.0%) |
Real Estate Taxes by Mortgage Status in Hominy
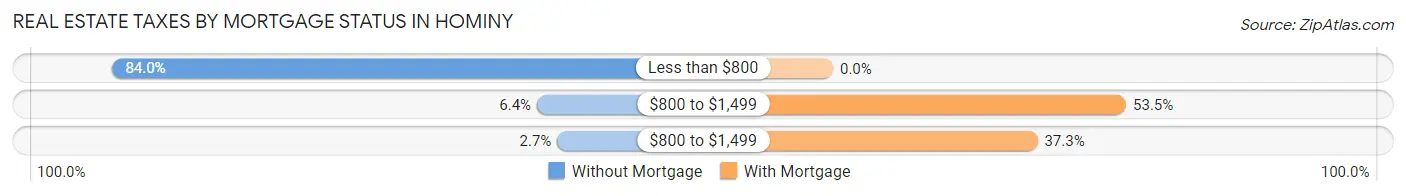
| Property Taxes | Without Mortgage | With Mortgage |
| Less than $800 | 340 (84.0%) | 0 (0.0%) |
| $800 to $1,499 | 26 (6.4%) | 129 (53.5%) |
| $800 to $1,499 | 11 (2.7%) | 90 (37.3%) |
| Total | 405 (100.0%) | 241 (100.0%) |
Health & Disability in Hominy
Health Insurance Coverage by Age in Hominy
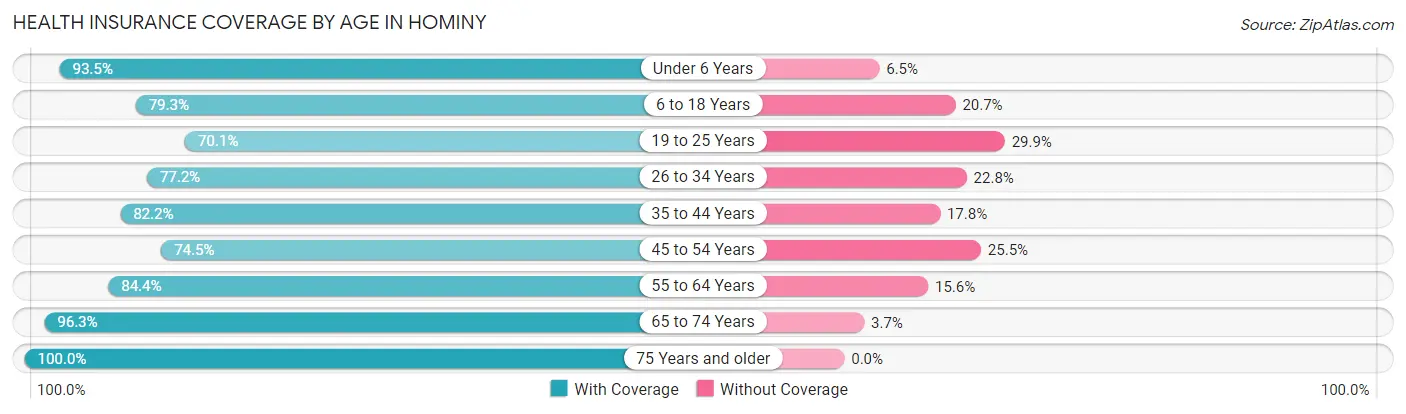
| Age Bracket | With Coverage | Without Coverage |
| Under 6 Years | 186 (93.5%) | 13 (6.5%) |
| 6 to 18 Years | 195 (79.3%) | 51 (20.7%) |
| 19 to 25 Years | 150 (70.1%) | 64 (29.9%) |
| 26 to 34 Years | 159 (77.2%) | 47 (22.8%) |
| 35 to 44 Years | 175 (82.2%) | 38 (17.8%) |
| 45 to 54 Years | 155 (74.5%) | 53 (25.5%) |
| 55 to 64 Years | 270 (84.4%) | 50 (15.6%) |
| 65 to 74 Years | 235 (96.3%) | 9 (3.7%) |
| 75 Years and older | 223 (100.0%) | 0 (0.0%) |
| Total | 1,748 (84.3%) | 325 (15.7%) |
Health Insurance Coverage by Citizenship Status in Hominy
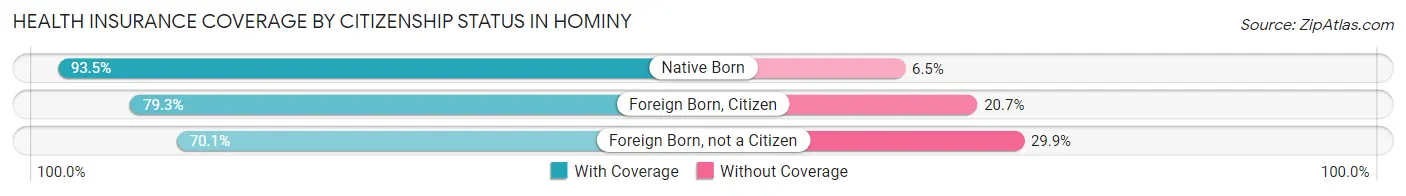
| Citizenship Status | With Coverage | Without Coverage |
| Native Born | 186 (93.5%) | 13 (6.5%) |
| Foreign Born, Citizen | 195 (79.3%) | 51 (20.7%) |
| Foreign Born, not a Citizen | 150 (70.1%) | 64 (29.9%) |
Health Insurance Coverage by Household Income in Hominy
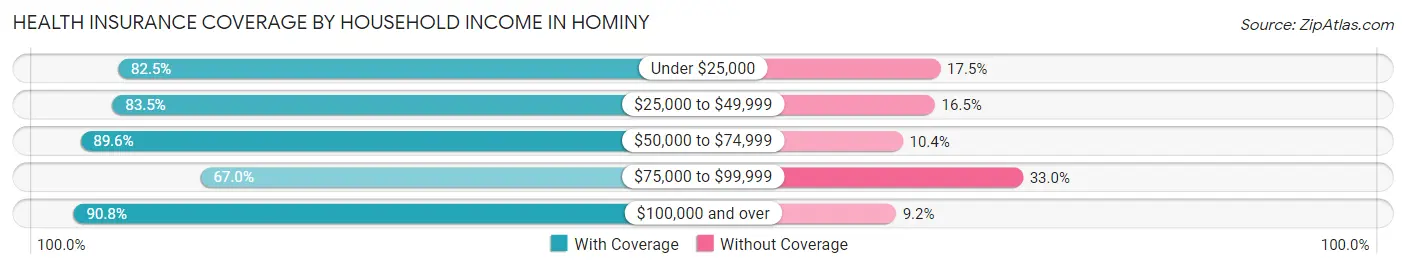
| Household Income | With Coverage | Without Coverage |
| Under $25,000 | 453 (82.5%) | 96 (17.5%) |
| $25,000 to $49,999 | 472 (83.5%) | 93 (16.5%) |
| $50,000 to $74,999 | 386 (89.6%) | 45 (10.4%) |
| $75,000 to $99,999 | 120 (67.0%) | 59 (33.0%) |
| $100,000 and over | 317 (90.8%) | 32 (9.2%) |
Public vs Private Health Insurance Coverage by Age in Hominy
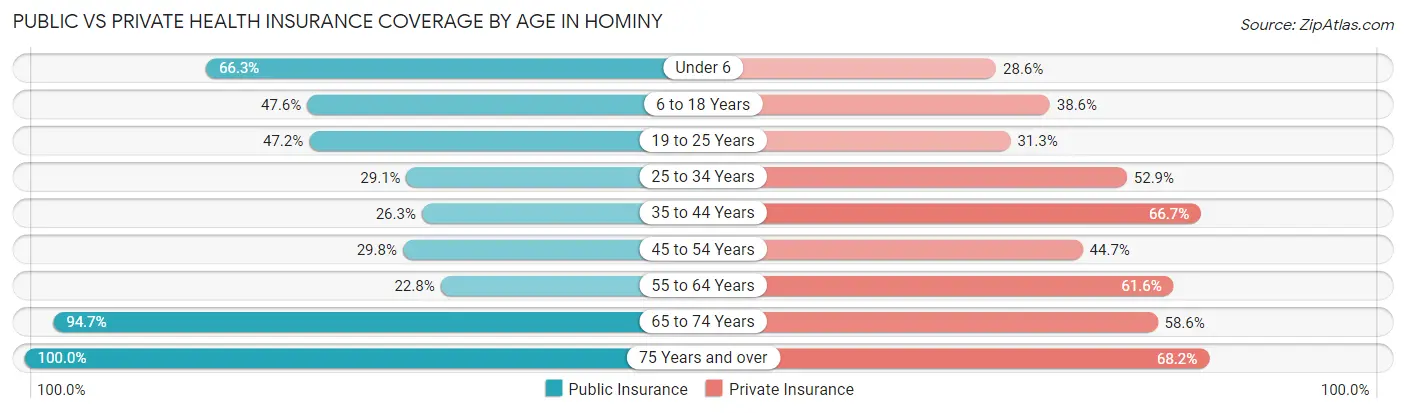
| Age Bracket | Public Insurance | Private Insurance |
| Under 6 | 132 (66.3%) | 57 (28.6%) |
| 6 to 18 Years | 117 (47.6%) | 95 (38.6%) |
| 19 to 25 Years | 101 (47.2%) | 67 (31.3%) |
| 25 to 34 Years | 60 (29.1%) | 109 (52.9%) |
| 35 to 44 Years | 56 (26.3%) | 142 (66.7%) |
| 45 to 54 Years | 62 (29.8%) | 93 (44.7%) |
| 55 to 64 Years | 73 (22.8%) | 197 (61.6%) |
| 65 to 74 Years | 231 (94.7%) | 143 (58.6%) |
| 75 Years and over | 223 (100.0%) | 152 (68.2%) |
| Total | 1,055 (50.9%) | 1,055 (50.9%) |
Disability Status by Sex by Age in Hominy
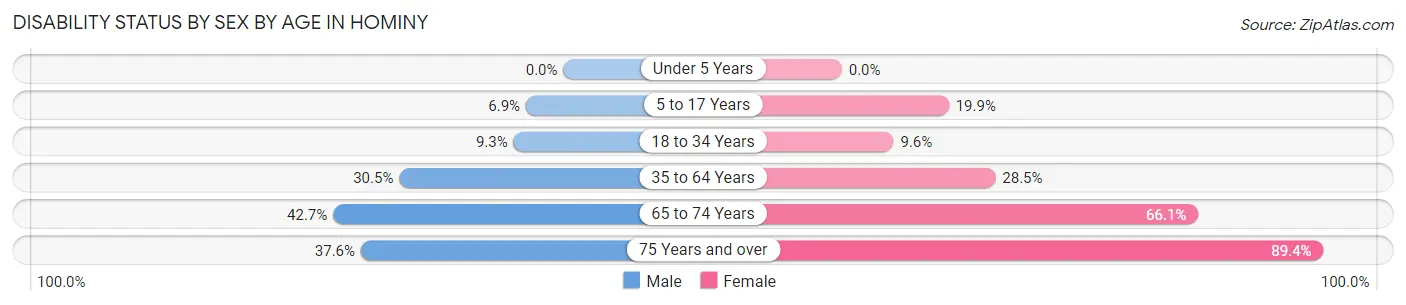
| Age Bracket | Male | Female |
| Under 5 Years | 0 (0.0%) | 0 (0.0%) |
| 5 to 17 Years | 10 (6.9%) | 26 (19.9%) |
| 18 to 34 Years | 21 (9.2%) | 19 (9.6%) |
| 35 to 64 Years | 106 (30.5%) | 112 (28.5%) |
| 65 to 74 Years | 50 (42.7%) | 84 (66.1%) |
| 75 Years and over | 59 (37.6%) | 59 (89.4%) |
Disability Class by Sex by Age in Hominy
Disability Class: Hearing Difficulty
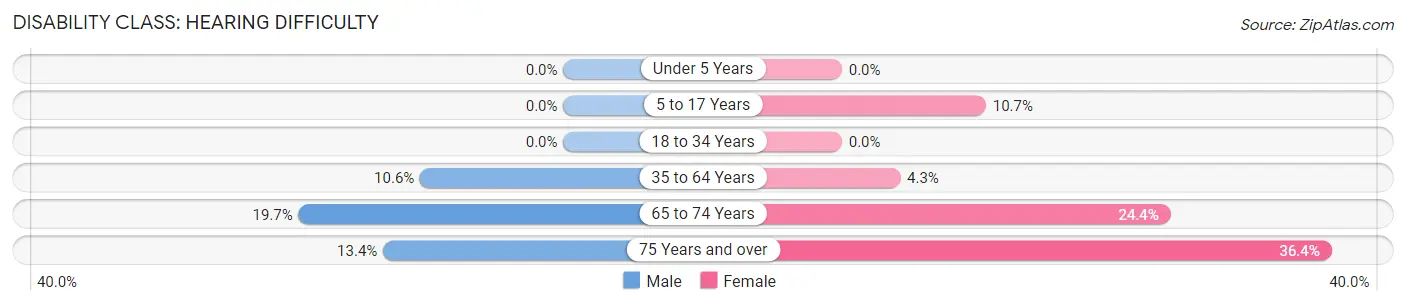
| Age Bracket | Male | Female |
| Under 5 Years | 0 (0.0%) | 0 (0.0%) |
| 5 to 17 Years | 0 (0.0%) | 14 (10.7%) |
| 18 to 34 Years | 0 (0.0%) | 0 (0.0%) |
| 35 to 64 Years | 37 (10.6%) | 17 (4.3%) |
| 65 to 74 Years | 23 (19.7%) | 31 (24.4%) |
| 75 Years and over | 21 (13.4%) | 24 (36.4%) |
Disability Class: Vision Difficulty
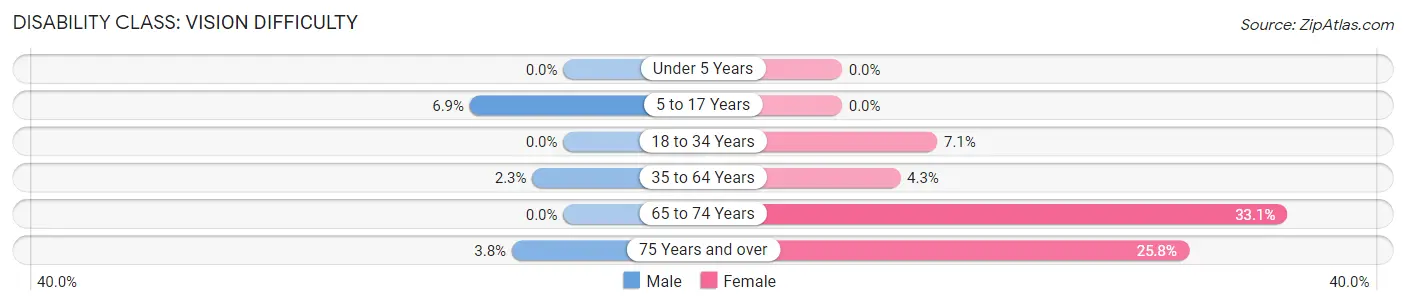
| Age Bracket | Male | Female |
| Under 5 Years | 0 (0.0%) | 0 (0.0%) |
| 5 to 17 Years | 10 (6.9%) | 0 (0.0%) |
| 18 to 34 Years | 0 (0.0%) | 14 (7.1%) |
| 35 to 64 Years | 8 (2.3%) | 17 (4.3%) |
| 65 to 74 Years | 0 (0.0%) | 42 (33.1%) |
| 75 Years and over | 6 (3.8%) | 17 (25.8%) |
Disability Class: Cognitive Difficulty
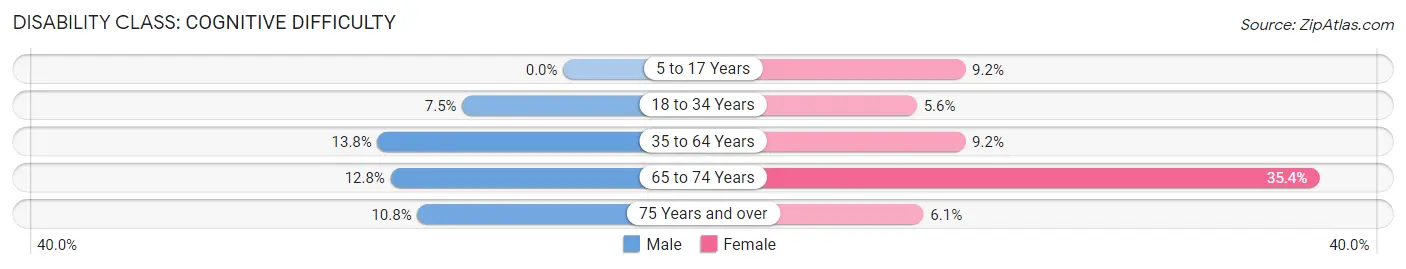
| Age Bracket | Male | Female |
| 5 to 17 Years | 0 (0.0%) | 12 (9.2%) |
| 18 to 34 Years | 17 (7.5%) | 11 (5.6%) |
| 35 to 64 Years | 48 (13.8%) | 36 (9.2%) |
| 65 to 74 Years | 15 (12.8%) | 45 (35.4%) |
| 75 Years and over | 17 (10.8%) | 4 (6.1%) |
Disability Class: Ambulatory Difficulty
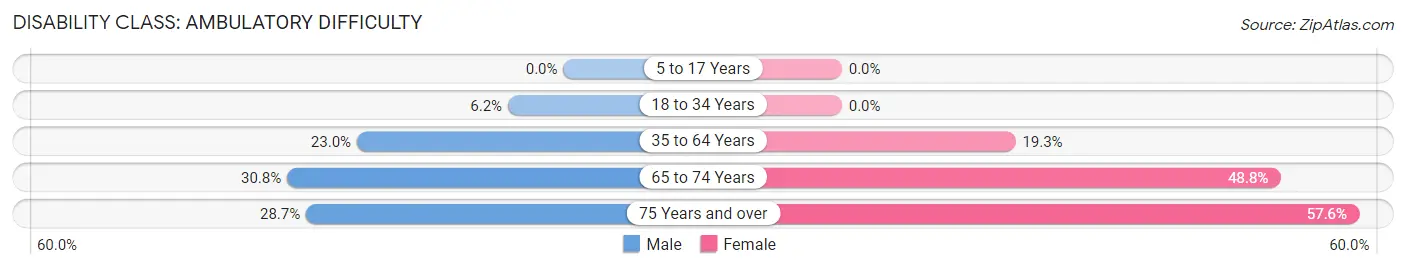
| Age Bracket | Male | Female |
| 5 to 17 Years | 0 (0.0%) | 0 (0.0%) |
| 18 to 34 Years | 14 (6.2%) | 0 (0.0%) |
| 35 to 64 Years | 80 (23.0%) | 76 (19.3%) |
| 65 to 74 Years | 36 (30.8%) | 62 (48.8%) |
| 75 Years and over | 45 (28.7%) | 38 (57.6%) |
Disability Class: Self-Care Difficulty
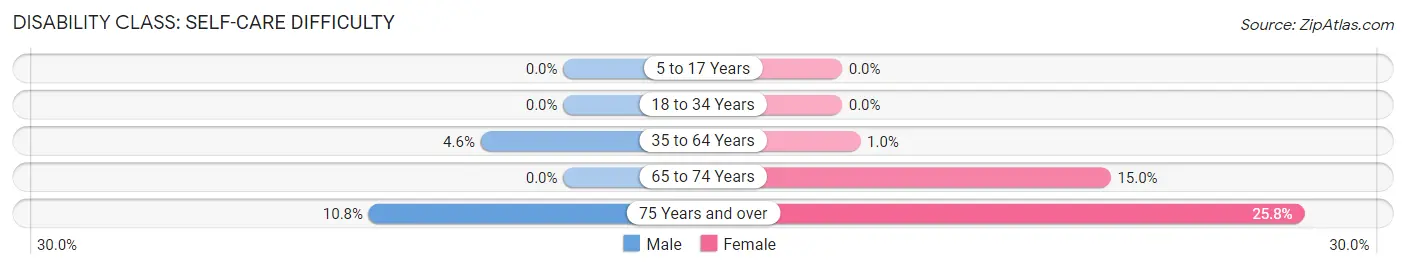
| Age Bracket | Male | Female |
| 5 to 17 Years | 0 (0.0%) | 0 (0.0%) |
| 18 to 34 Years | 0 (0.0%) | 0 (0.0%) |
| 35 to 64 Years | 16 (4.6%) | 4 (1.0%) |
| 65 to 74 Years | 0 (0.0%) | 19 (15.0%) |
| 75 Years and over | 17 (10.8%) | 17 (25.8%) |
Technology Access in Hominy
Computing Device Access in Hominy
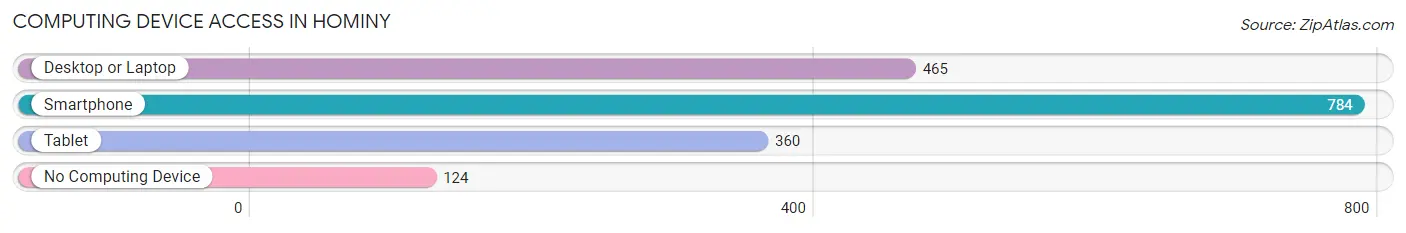
| Device Type | # Households | % Households |
| Desktop or Laptop | 465 | 48.6% |
| Smartphone | 784 | 81.9% |
| Tablet | 360 | 37.6% |
| No Computing Device | 124 | 13.0% |
| Total | 957 | 100.0% |
Internet Access in Hominy
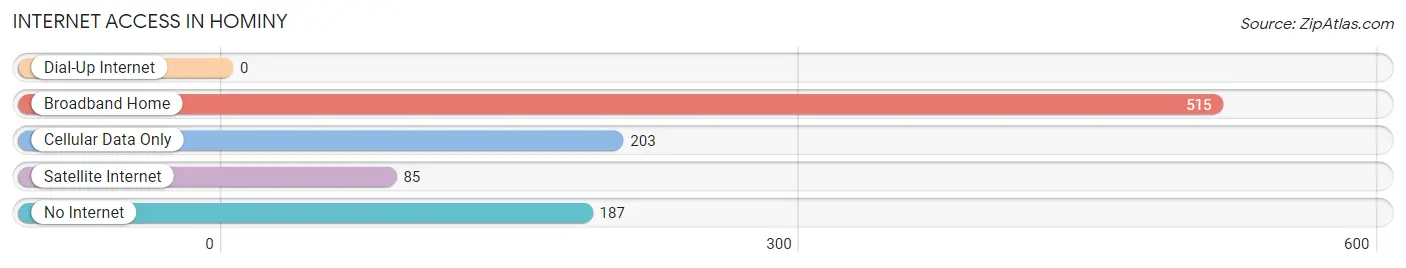
| Internet Type | # Households | % Households |
| Dial-Up Internet | 0 | 0.0% |
| Broadband Home | 515 | 53.8% |
| Cellular Data Only | 203 | 21.2% |
| Satellite Internet | 85 | 8.9% |
| No Internet | 187 | 19.5% |
| Total | 957 | 100.0% |
Hominy Summary
Hominy, Oklahoma is a small town located in Osage County, Oklahoma. It is situated about 20 miles north of Tulsa and is part of the Tulsa Metropolitan Statistical Area. The town has a population of approximately 3,000 people and is known for its rich Native American heritage.
Geography
Hominy is located in the Osage Plains region of Oklahoma. The town is situated on the banks of the Hominy Creek, which is a tributary of the Arkansas River. The town is surrounded by rolling hills and is located in a region of the state known for its rich agricultural land. The town is located at an elevation of 745 feet above sea level.
Economy
Hominy’s economy is largely based on agriculture. The town is home to several large farms and ranches, as well as a number of smaller family-owned farms. The town is also home to several businesses, including a grocery store, a hardware store, a bank, and a few restaurants.
Demographics
As of the 2010 census, the population of Hominy was 3,077. The racial makeup of the town was 79.3% White, 15.2% Native American, 0.7% African American, 0.3% Asian, and 4.5% from other races. The median household income was $30,938, and the median family income was $37,813.
History
Hominy was founded in 1872 by a group of Osage Indians. The town was named after the Hominy Creek, which was named after the Osage word for “corn”. The town was originally a trading post for the Osage Indians, and it quickly grew into a small settlement.
In the early 1900s, the town began to grow rapidly as more settlers moved to the area. The town was incorporated in 1907 and the first mayor was elected in 1908. The town continued to grow throughout the 20th century, and by the 2000s, it had become a thriving small town.
Today, Hominy is a vibrant small town with a rich history and culture. The town is home to several festivals and events throughout the year, including the Hominy Indian Days Festival, which celebrates the town’s Native American heritage. The town is also home to several museums, including the Osage County Historical Museum and the Hominy Indian Museum.
Hominy is a great place to live and visit, and it is a great example of a small town with a rich history and culture. The town is a great place to explore and experience the unique culture of the Osage Indians.
Common Questions
What is Per Capita Income in Hominy?
Per Capita income in Hominy is $15,396.
What is the Median Family Income in Hominy?
Median Family Income in Hominy is $42,500.
What is the Median Household income in Hominy?
Median Household Income in Hominy is $34,735.
What is Income or Wage Gap in Hominy?
Income or Wage Gap in Hominy is 21.2%.
Women in Hominy earn 78.8 cents for every dollar earned by a man.
What is Family Income Deficit in Hominy?
Family Income Deficit in Hominy is $14,207.
Families that are below poverty line in Hominy earn $14,207 less on average than the poverty threshold level.
What is Inequality or Gini Index in Hominy?
Inequality or Gini Index in Hominy is 0.47.
What is the Total Population of Hominy?
Total Population of Hominy is 3,327.
What is the Total Male Population of Hominy?
Total Male Population of Hominy is 2,339.
What is the Total Female Population of Hominy?
Total Female Population of Hominy is 988.
What is the Ratio of Males per 100 Females in Hominy?
There are 236.74 Males per 100 Females in Hominy.
What is the Ratio of Females per 100 Males in Hominy?
There are 42.24 Females per 100 Males in Hominy.
What is the Median Population Age in Hominy?
Median Population Age in Hominy is 41.7 Years.
What is the Average Family Size in Hominy
Average Family Size in Hominy is 2.6 People.
What is the Average Household Size in Hominy
Average Household Size in Hominy is 2.2 People.
How Large is the Labor Force in Hominy?
There are 796 People in the Labor Forcein in Hominy.
What is the Percentage of People in the Labor Force in Hominy?
27.1% of People are in the Labor Force in Hominy.
What is the Unemployment Rate in Hominy?
Unemployment Rate in Hominy is 6.7%.