Rocky, OK Map & Demographics
Rocky Map
Rocky Overview
$25,605
PER CAPITA INCOME
$57,857
AVG FAMILY INCOME
$45,000
AVG HOUSEHOLD INCOME
65.4%
WAGE / INCOME GAP [ % ]
34.6¢/ $1
WAGE / INCOME GAP [ $ ]
0.31
INEQUALITY / GINI INDEX
266
TOTAL POPULATION
122
MALE POPULATION
144
FEMALE POPULATION
84.72
MALES / 100 FEMALES
118.03
FEMALES / 100 MALES
56.9
MEDIAN AGE
4.9
AVG FAMILY SIZE
4.2
AVG HOUSEHOLD SIZE
105
LABOR FORCE [ PEOPLE ]
44.1%
PERCENT IN LABOR FORCE
16.2%
UNEMPLOYMENT RATE
Rocky Zip Codes
Rocky Area Codes
Income in Rocky
Income Overview in Rocky
Per Capita Income in Rocky is $25,605, while median incomes of families and households are $57,857 and $45,000 respectively.
| Characteristic | Number | Measure |
| Per Capita Income | 266 | $25,605 |
| Median Family Income | 48 | $57,857 |
| Mean Family Income | 48 | $64,721 |
| Median Household Income | 64 | $45,000 |
| Mean Household Income | 64 | $59,423 |
| Income Deficit | 48 | $0 |
| Wage / Income Gap (%) | 266 | 65.41% |
| Wage / Income Gap ($) | 266 | 34.59¢ per $1 |
| Gini / Inequality Index | 266 | 0.31 |
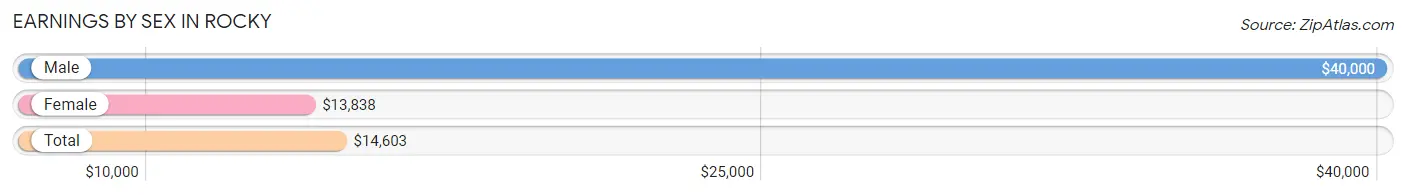
Earnings by Sex in Rocky
Average Earnings in Rocky are $14,603, $40,000 for men and $13,838 for women, a difference of 65.4%.
| Sex | Number | Average Earnings |
| Male | 86 (45.0%) | $40,000 |
| Female | 105 (55.0%) | $13,838 |
| Total | 191 (100.0%) | $14,603 |
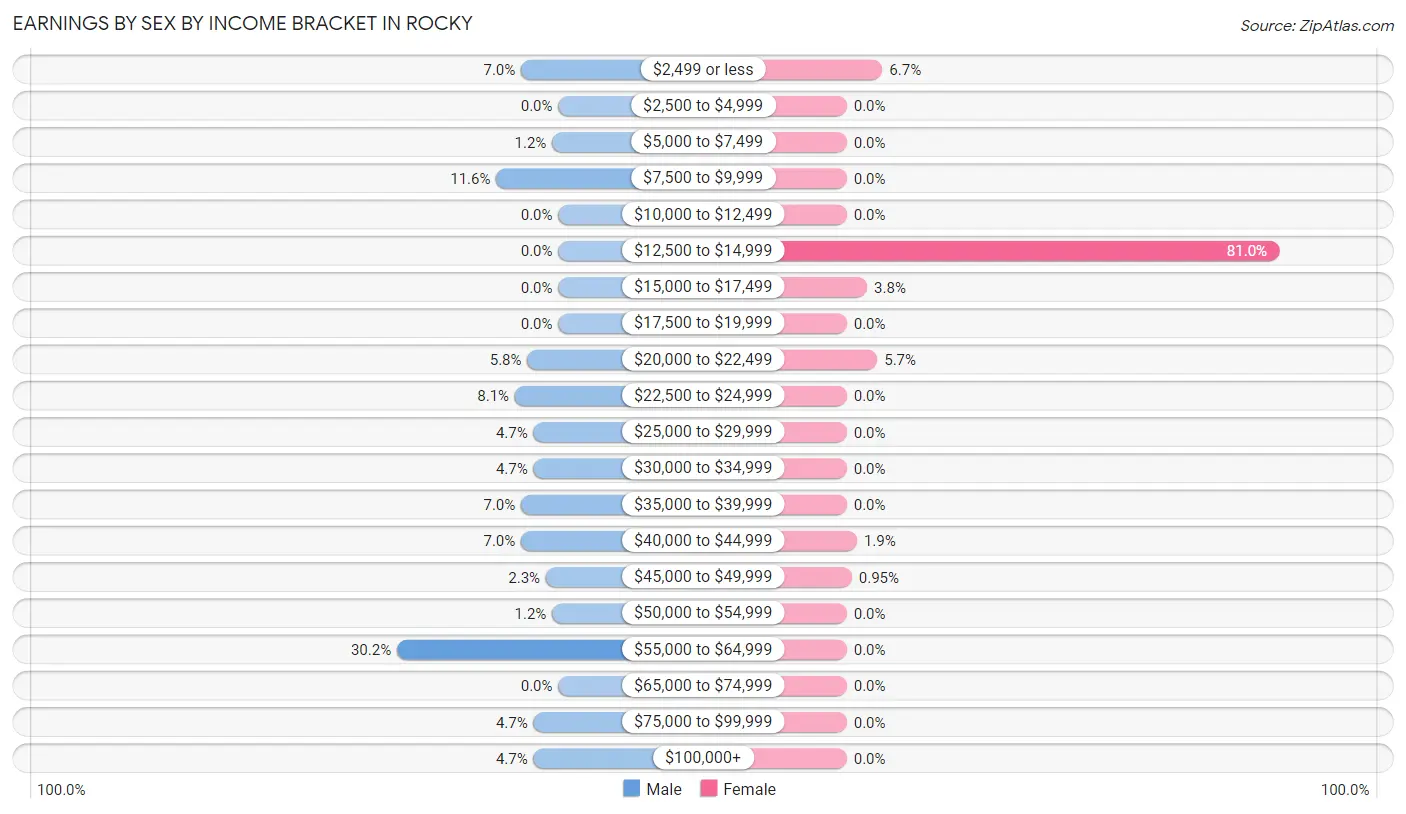
Earnings by Sex by Income Bracket in Rocky
The most common earnings brackets in Rocky are $55,000 to $64,999 for men (26 | 30.2%) and $12,500 to $14,999 for women (85 | 80.9%).
| Income | Male | Female |
| $2,499 or less | 6 (7.0%) | 7 (6.7%) |
| $2,500 to $4,999 | 0 (0.0%) | 0 (0.0%) |
| $5,000 to $7,499 | 1 (1.2%) | 0 (0.0%) |
| $7,500 to $9,999 | 10 (11.6%) | 0 (0.0%) |
| $10,000 to $12,499 | 0 (0.0%) | 0 (0.0%) |
| $12,500 to $14,999 | 0 (0.0%) | 85 (80.9%) |
| $15,000 to $17,499 | 0 (0.0%) | 4 (3.8%) |
| $17,500 to $19,999 | 0 (0.0%) | 0 (0.0%) |
| $20,000 to $22,499 | 5 (5.8%) | 6 (5.7%) |
| $22,500 to $24,999 | 7 (8.1%) | 0 (0.0%) |
| $25,000 to $29,999 | 4 (4.6%) | 0 (0.0%) |
| $30,000 to $34,999 | 4 (4.6%) | 0 (0.0%) |
| $35,000 to $39,999 | 6 (7.0%) | 0 (0.0%) |
| $40,000 to $44,999 | 6 (7.0%) | 2 (1.9%) |
| $45,000 to $49,999 | 2 (2.3%) | 1 (0.9%) |
| $50,000 to $54,999 | 1 (1.2%) | 0 (0.0%) |
| $55,000 to $64,999 | 26 (30.2%) | 0 (0.0%) |
| $65,000 to $74,999 | 0 (0.0%) | 0 (0.0%) |
| $75,000 to $99,999 | 4 (4.6%) | 0 (0.0%) |
| $100,000+ | 4 (4.6%) | 0 (0.0%) |
| Total | 86 (100.0%) | 105 (100.0%) |
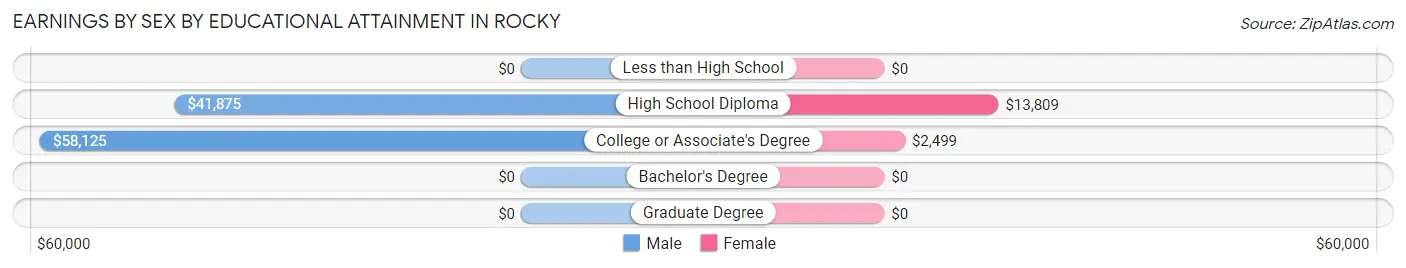
Earnings by Sex by Educational Attainment in Rocky
Average earnings in Rocky are $46,875 for men and $13,794 for women, a difference of 70.6%. Men with an educational attainment of college or associate's degree enjoy the highest average annual earnings of $58,125, while those with high school diploma education earn the least with $41,875. Women with an educational attainment of high school diploma earn the most with the average annual earnings of $13,809, while those with college or associate's degree education have the smallest earnings of $2,499.
| Educational Attainment | Male Income | Female Income |
| Less than High School | - | - |
| High School Diploma | $41,875 | $13,809 |
| College or Associate's Degree | $58,125 | $2,499 |
| Bachelor's Degree | - | - |
| Graduate Degree | - | - |
| Total | $46,875 | $13,794 |
Family Income in Rocky
Family Income Brackets in Rocky
According to the Rocky family income data, there are 16 families falling into the $35,000 to $49,999 income range, which is the most common income bracket and makes up 33.3% of all families.
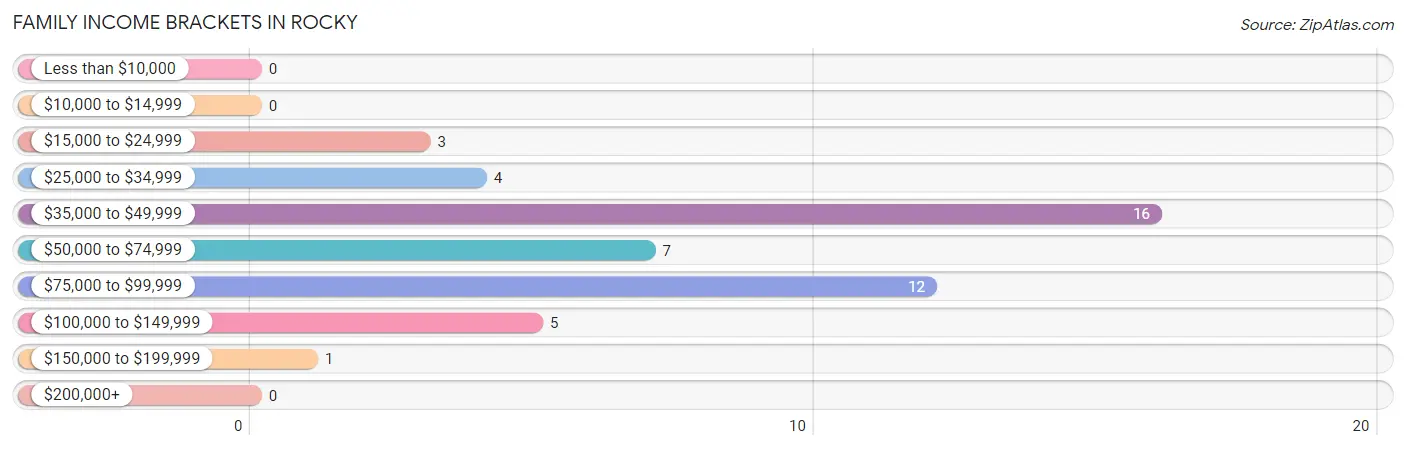
| Income Bracket | # Families | % Families |
| Less than $10,000 | 0 | 0.0% |
| $10,000 to $14,999 | 0 | 0.0% |
| $15,000 to $24,999 | 3 | 6.3% |
| $25,000 to $34,999 | 4 | 8.3% |
| $35,000 to $49,999 | 16 | 33.3% |
| $50,000 to $74,999 | 7 | 14.6% |
| $75,000 to $99,999 | 12 | 25.0% |
| $100,000 to $149,999 | 5 | 10.4% |
| $150,000 to $199,999 | 1 | 2.1% |
| $200,000+ | 0 | 0.0% |
Family Income by Famaliy Size in Rocky
4-person families (15 | 31.2%) account for the highest median family income in Rocky with $78,125 per family, while 2-person families (18 | 37.5%) have the highest median income of $20,416 per family member.
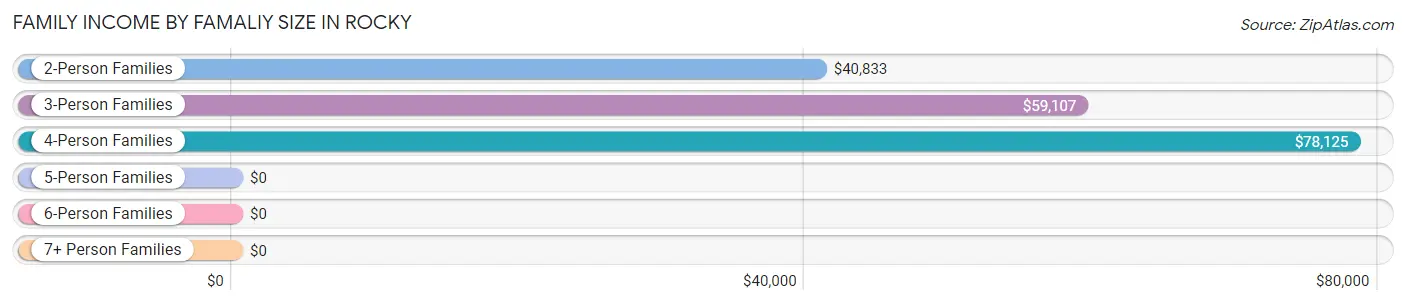
| Income Bracket | # Families | Median Income |
| 2-Person Families | 18 (37.5%) | $40,833 |
| 3-Person Families | 15 (31.2%) | $59,107 |
| 4-Person Families | 15 (31.2%) | $78,125 |
| 5-Person Families | 0 (0.0%) | $0 |
| 6-Person Families | 0 (0.0%) | $0 |
| 7+ Person Families | 0 (0.0%) | $0 |
| Total | 48 (100.0%) | $57,857 |
Family Income by Number of Earners in Rocky
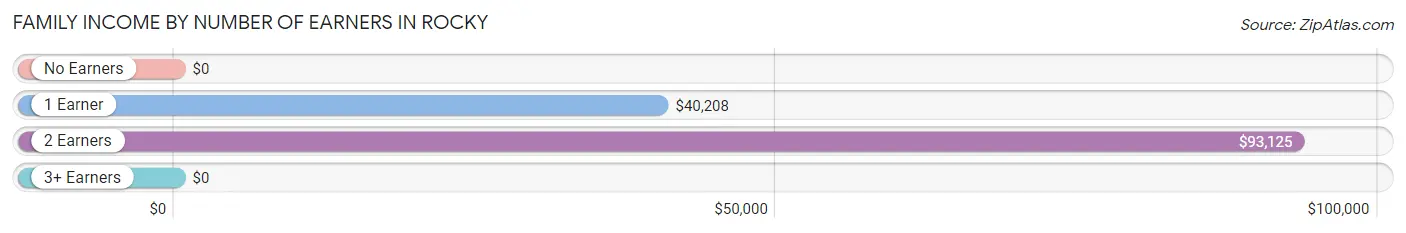
| Number of Earners | # Families | Median Income |
| No Earners | 0 (0.0%) | $0 |
| 1 Earner | 27 (56.2%) | $40,208 |
| 2 Earners | 15 (31.2%) | $93,125 |
| 3+ Earners | 6 (12.5%) | $0 |
| Total | 48 (100.0%) | $57,857 |
Household Income in Rocky
Household Income Brackets in Rocky
With 18 households falling in the category, the $35,000 to $49,999 income range is the most frequent in Rocky, accounting for 28.1% of all households.
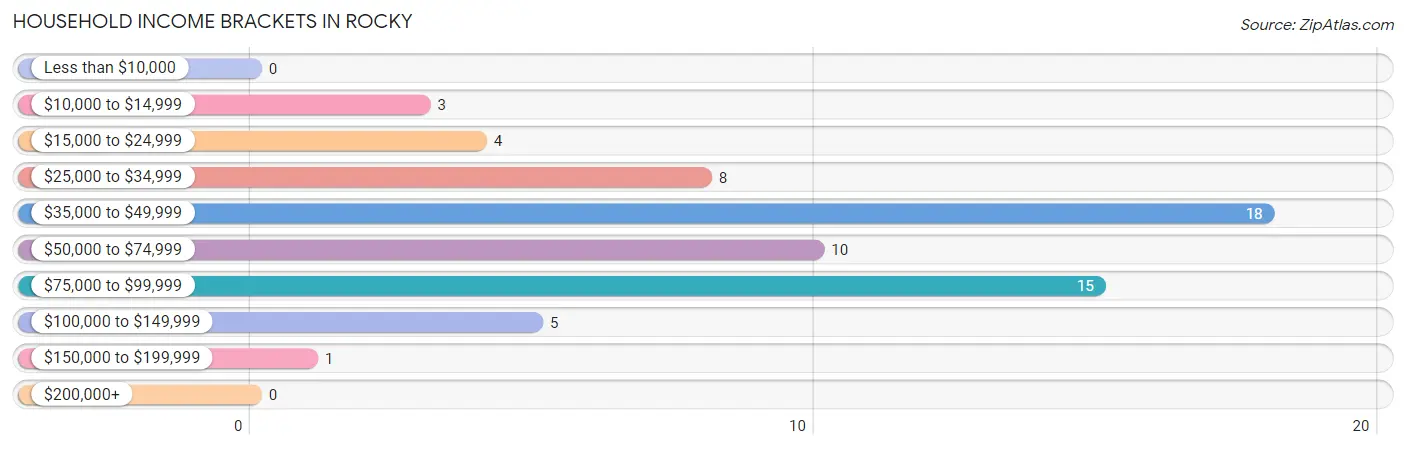
| Income Bracket | # Households | % Households |
| Less than $10,000 | 0 | 0.0% |
| $10,000 to $14,999 | 3 | 4.7% |
| $15,000 to $24,999 | 4 | 6.3% |
| $25,000 to $34,999 | 8 | 12.5% |
| $35,000 to $49,999 | 18 | 28.1% |
| $50,000 to $74,999 | 10 | 15.6% |
| $75,000 to $99,999 | 15 | 23.4% |
| $100,000 to $149,999 | 5 | 7.8% |
| $150,000 to $199,999 | 1 | 1.6% |
| $200,000+ | 0 | 0.0% |
Household Income by Householder Age in Rocky
The median household income in Rocky is $45,000, with the highest median household income of $78,333 found in the 65+ years age bracket for the primary householder. A total of 16 households (25.0%) fall into this category. Meanwhile, the 15 to 24 years age bracket for the primary householder has the lowest median household income of $0, with 11 households (17.2%) in this group.
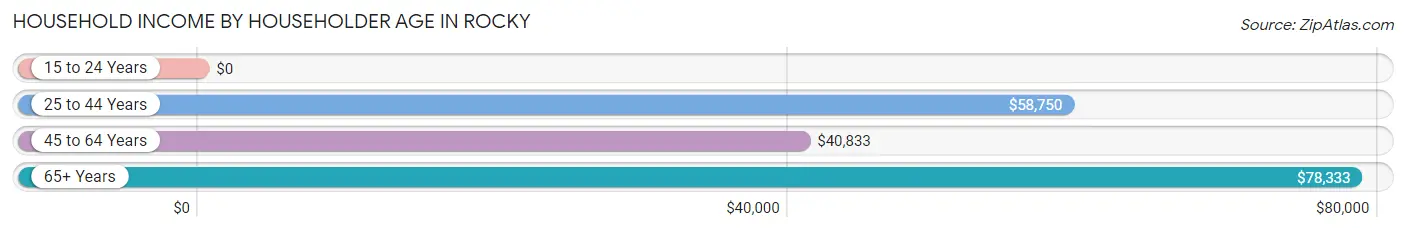
| Income Bracket | # Households | Median Income |
| 15 to 24 Years | 11 (17.2%) | $0 |
| 25 to 44 Years | 23 (35.9%) | $58,750 |
| 45 to 64 Years | 14 (21.9%) | $40,833 |
| 65+ Years | 16 (25.0%) | $78,333 |
| Total | 64 (100.0%) | $45,000 |
Poverty in Rocky
Income Below Poverty by Sex and Age in Rocky
With 4.9% poverty level for males and 3.5% for females among the residents of Rocky, 5 year old males and 25 to 34 year old females are the most vulnerable to poverty, with 3 males (100.0%) and 5 females (31.2%) in their respective age groups living below the poverty level.
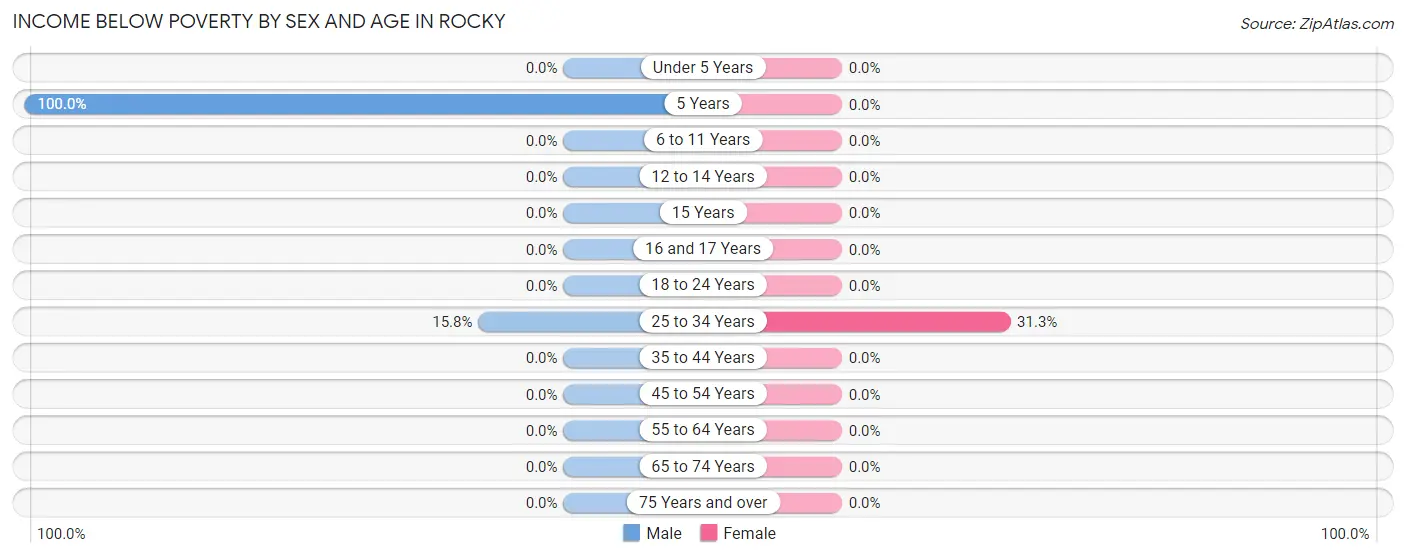
| Age Bracket | Male | Female |
| Under 5 Years | 0 (0.0%) | 0 (0.0%) |
| 5 Years | 3 (100.0%) | 0 (0.0%) |
| 6 to 11 Years | 0 (0.0%) | 0 (0.0%) |
| 12 to 14 Years | 0 (0.0%) | 0 (0.0%) |
| 15 Years | 0 (0.0%) | 0 (0.0%) |
| 16 and 17 Years | 0 (0.0%) | 0 (0.0%) |
| 18 to 24 Years | 0 (0.0%) | 0 (0.0%) |
| 25 to 34 Years | 3 (15.8%) | 5 (31.2%) |
| 35 to 44 Years | 0 (0.0%) | 0 (0.0%) |
| 45 to 54 Years | 0 (0.0%) | 0 (0.0%) |
| 55 to 64 Years | 0 (0.0%) | 0 (0.0%) |
| 65 to 74 Years | 0 (0.0%) | 0 (0.0%) |
| 75 Years and over | 0 (0.0%) | 0 (0.0%) |
| Total | 6 (4.9%) | 5 (3.5%) |
Income Above Poverty by Sex and Age in Rocky
According to the poverty statistics in Rocky, males aged under 5 years and females aged 18 to 24 years are the age groups that are most secure financially, with 100.0% of males and 100.0% of females in these age groups living above the poverty line.
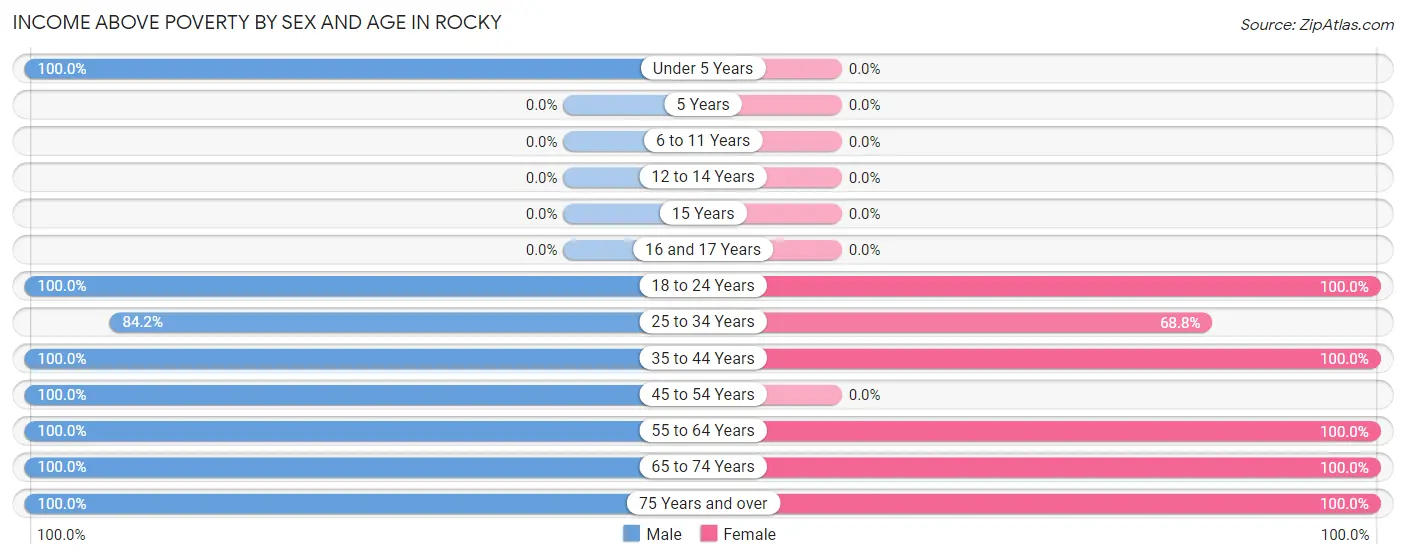
| Age Bracket | Male | Female |
| Under 5 Years | 25 (100.0%) | 0 (0.0%) |
| 5 Years | 0 (0.0%) | 0 (0.0%) |
| 6 to 11 Years | 0 (0.0%) | 0 (0.0%) |
| 12 to 14 Years | 0 (0.0%) | 0 (0.0%) |
| 15 Years | 0 (0.0%) | 0 (0.0%) |
| 16 and 17 Years | 0 (0.0%) | 0 (0.0%) |
| 18 to 24 Years | 20 (100.0%) | 9 (100.0%) |
| 25 to 34 Years | 16 (84.2%) | 11 (68.8%) |
| 35 to 44 Years | 14 (100.0%) | 7 (100.0%) |
| 45 to 54 Years | 12 (100.0%) | 0 (0.0%) |
| 55 to 64 Years | 14 (100.0%) | 13 (100.0%) |
| 65 to 74 Years | 14 (100.0%) | 96 (100.0%) |
| 75 Years and over | 1 (100.0%) | 3 (100.0%) |
| Total | 116 (95.1%) | 139 (96.5%) |
Income Below Poverty Among Married-Couple Families in Rocky
The poverty statistics for married-couple families in Rocky show that 6.2% or 3 of the total 48 families live below the poverty line. Families with 1 or 2 children have the highest poverty rate of 17.6%, comprising of 3 families. On the other hand, families with no children have the lowest poverty rate of 0.0%, which includes 0 families.
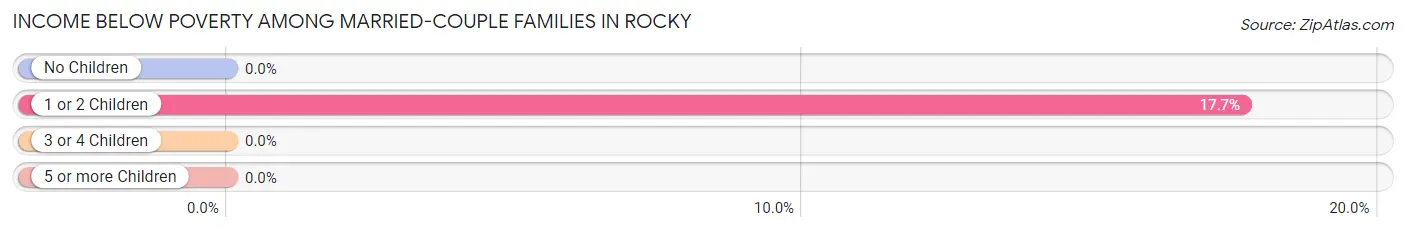
| Children | Above Poverty | Below Poverty |
| No Children | 31 (100.0%) | 0 (0.0%) |
| 1 or 2 Children | 14 (82.4%) | 3 (17.6%) |
| 3 or 4 Children | 0 (0.0%) | 0 (0.0%) |
| 5 or more Children | 0 (0.0%) | 0 (0.0%) |
| Total | 45 (93.8%) | 3 (6.2%) |
Income Below Poverty Among Single-Parent Households in Rocky
| Children | Single Father | Single Mother |
| No Children | 0 (0.0%) | 0 (0.0%) |
| 1 or 2 Children | 0 (0.0%) | 0 (0.0%) |
| 3 or 4 Children | 0 (0.0%) | 0 (0.0%) |
| 5 or more Children | 0 (0.0%) | 0 (0.0%) |
| Total | 0 (0.0%) | 0 (0.0%) |
Income Below Poverty Among Married-Couple vs Single-Parent Households in Rocky
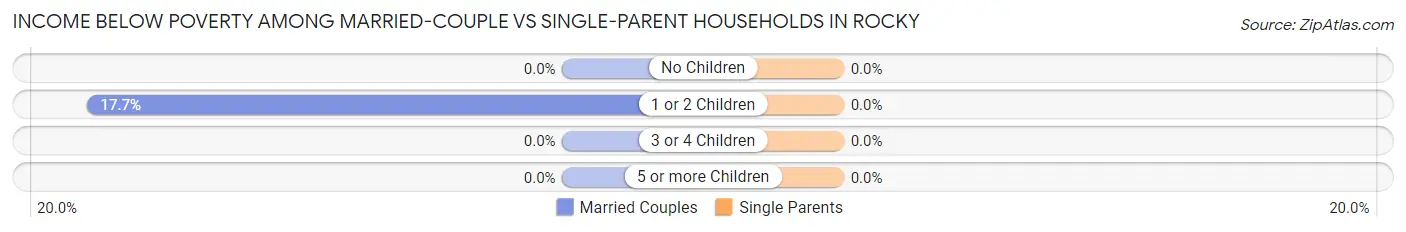
| Children | Married-Couple Families | Single-Parent Households |
| No Children | 0 (0.0%) | 0 (0.0%) |
| 1 or 2 Children | 3 (17.6%) | 0 (0.0%) |
| 3 or 4 Children | 0 (0.0%) | 0 (0.0%) |
| 5 or more Children | 0 (0.0%) | 0 (0.0%) |
| Total | 3 (6.2%) | 0 (0.0%) |
Race in Rocky
The most populous races in Rocky are White / Caucasian (256 | 96.2%), Two or more Races (7 | 2.6%), and Hispanic or Latino (6 | 2.3%).
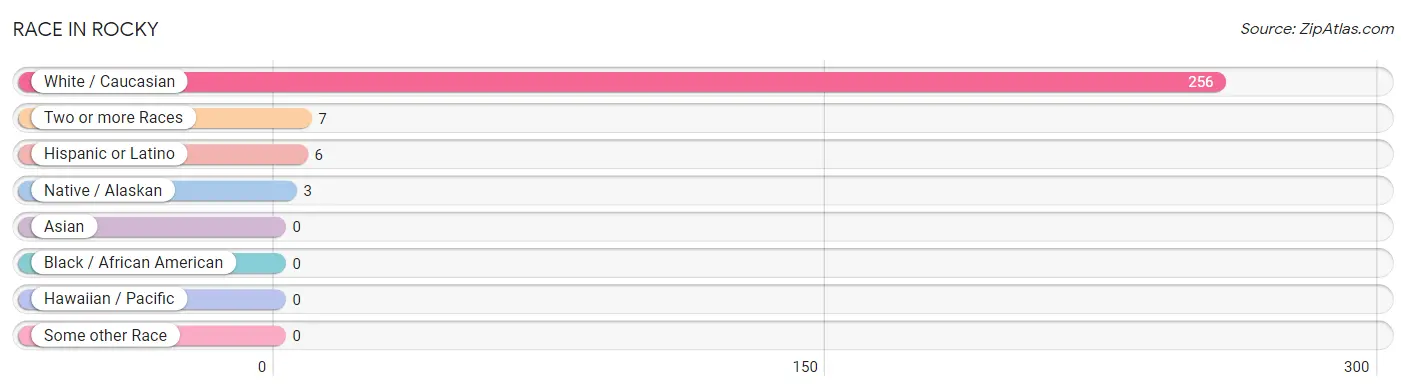
| Race | # Population | % Population |
| Asian | 0 | 0.0% |
| Black / African American | 0 | 0.0% |
| Hawaiian / Pacific | 0 | 0.0% |
| Hispanic or Latino | 6 | 2.3% |
| Native / Alaskan | 3 | 1.1% |
| White / Caucasian | 256 | 96.2% |
| Two or more Races | 7 | 2.6% |
| Some other Race | 0 | 0.0% |
| Total | 266 | 100.0% |
Ancestry in Rocky
The most populous ancestries reported in Rocky are American (87 | 32.7%), English (47 | 17.7%), German (18 | 6.8%), Irish (13 | 4.9%), and French (12 | 4.5%), together accounting for 66.6% of all Rocky residents.
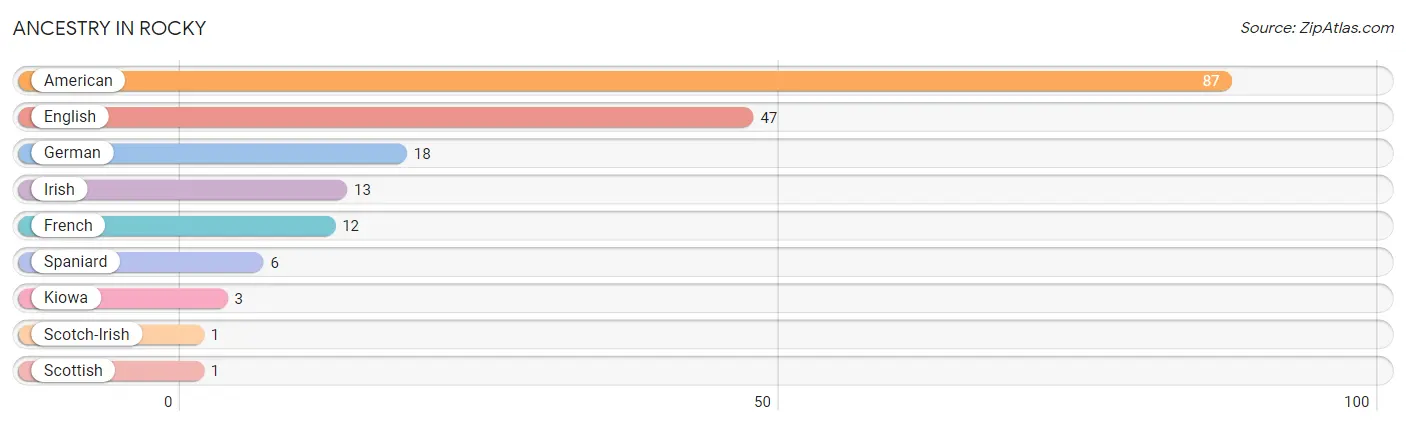
| Ancestry | # Population | % Population |
| American | 87 | 32.7% |
| English | 47 | 17.7% |
| French | 12 | 4.5% |
| German | 18 | 6.8% |
| Irish | 13 | 4.9% |
| Kiowa | 3 | 1.1% |
| Scotch-Irish | 1 | 0.4% |
| Scottish | 1 | 0.4% |
| Spaniard | 6 | 2.3% | View All 9 Rows |
Immigrants in Rocky

| Immigration Origin | # Population | % Population | View All 0 Rows |
Sex and Age in Rocky
Sex and Age in Rocky
The most populous age groups in Rocky are Under 5 Years (25 | 20.5%) for men and 70 to 74 Years (91 | 63.2%) for women.
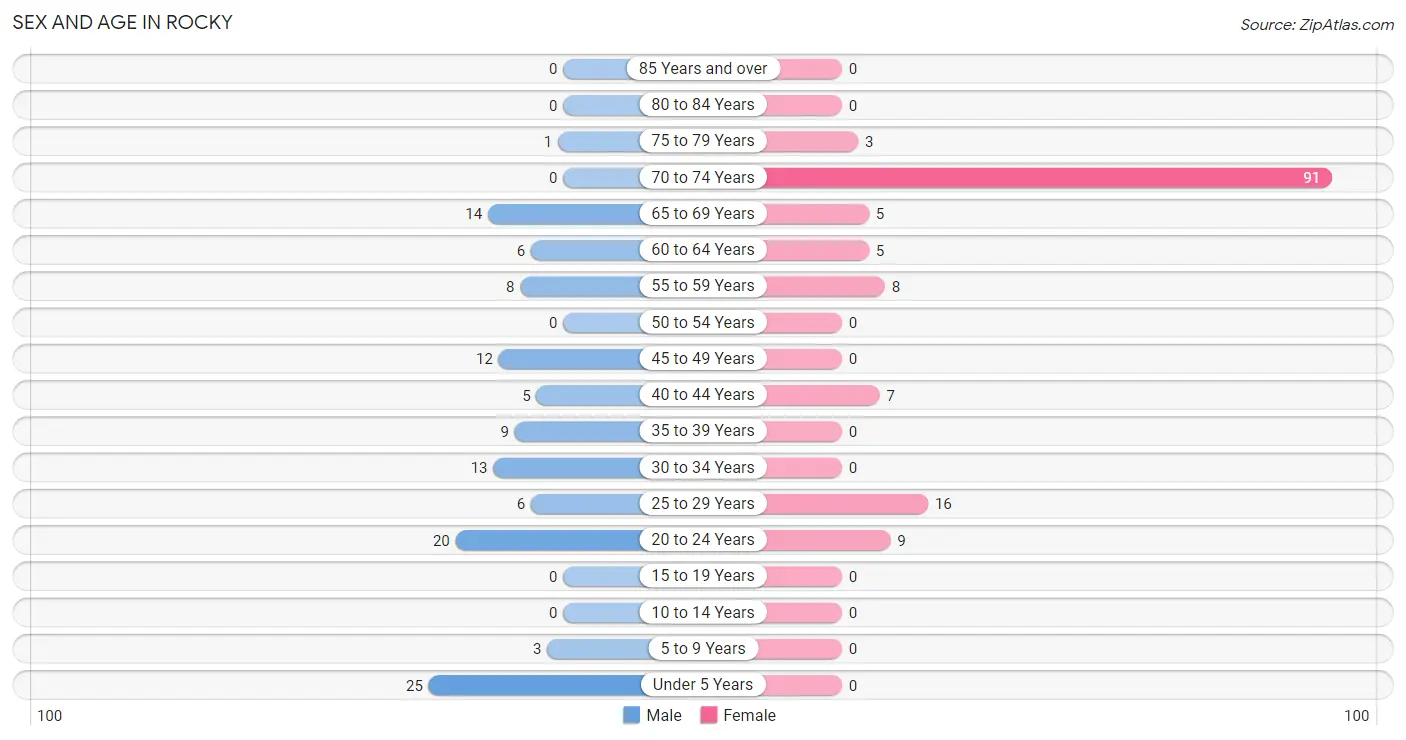
| Age Bracket | Male | Female |
| Under 5 Years | 25 (20.5%) | 0 (0.0%) |
| 5 to 9 Years | 3 (2.5%) | 0 (0.0%) |
| 10 to 14 Years | 0 (0.0%) | 0 (0.0%) |
| 15 to 19 Years | 0 (0.0%) | 0 (0.0%) |
| 20 to 24 Years | 20 (16.4%) | 9 (6.2%) |
| 25 to 29 Years | 6 (4.9%) | 16 (11.1%) |
| 30 to 34 Years | 13 (10.7%) | 0 (0.0%) |
| 35 to 39 Years | 9 (7.4%) | 0 (0.0%) |
| 40 to 44 Years | 5 (4.1%) | 7 (4.9%) |
| 45 to 49 Years | 12 (9.8%) | 0 (0.0%) |
| 50 to 54 Years | 0 (0.0%) | 0 (0.0%) |
| 55 to 59 Years | 8 (6.6%) | 8 (5.6%) |
| 60 to 64 Years | 6 (4.9%) | 5 (3.5%) |
| 65 to 69 Years | 14 (11.5%) | 5 (3.5%) |
| 70 to 74 Years | 0 (0.0%) | 91 (63.2%) |
| 75 to 79 Years | 1 (0.8%) | 3 (2.1%) |
| 80 to 84 Years | 0 (0.0%) | 0 (0.0%) |
| 85 Years and over | 0 (0.0%) | 0 (0.0%) |
| Total | 122 (100.0%) | 144 (100.0%) |
Families and Households in Rocky
Median Family Size in Rocky
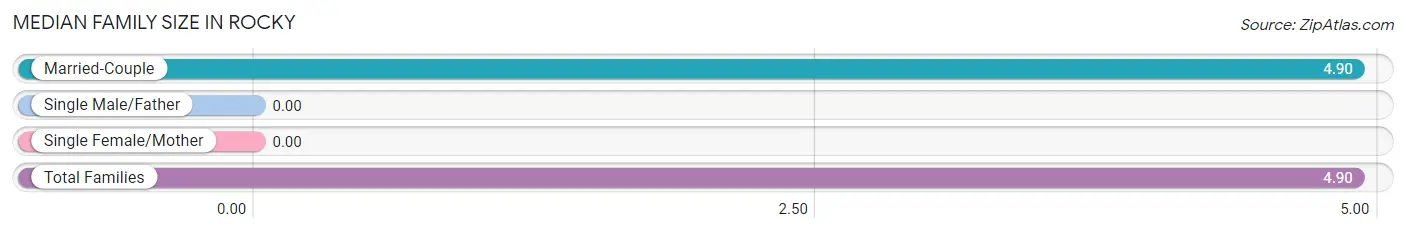
| Family Type | # Families | Family Size |
| Married-Couple | 48 (100.0%) | 4.90 |
| Single Male/Father | 0 (0.0%) | - |
| Single Female/Mother | 0 (0.0%) | - |
| Total Families | 48 (100.0%) | 4.90 |
Median Household Size in Rocky
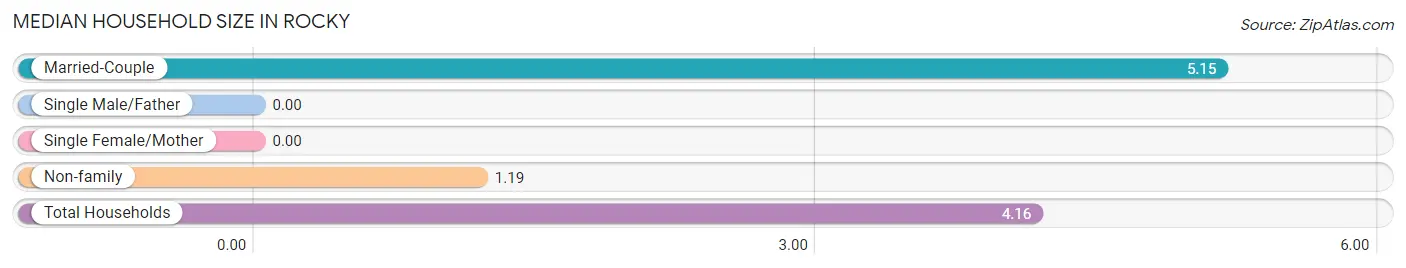
| Household Type | # Households | Household Size |
| Married-Couple | 48 (75.0%) | 5.15 |
| Single Male/Father | 0 (0.0%) | - |
| Single Female/Mother | 0 (0.0%) | - |
| Non-family | 16 (25.0%) | 1.19 |
| Total Households | 64 (100.0%) | 4.16 |
Household Size by Marriage Status in Rocky
Out of a total of 64 households in Rocky, 48 (75.0%) are family households, while 16 (25.0%) are nonfamily households. The most numerous type of family households are 3-person households, comprising 18, and the most common type of nonfamily households are 1-person households, comprising 11.
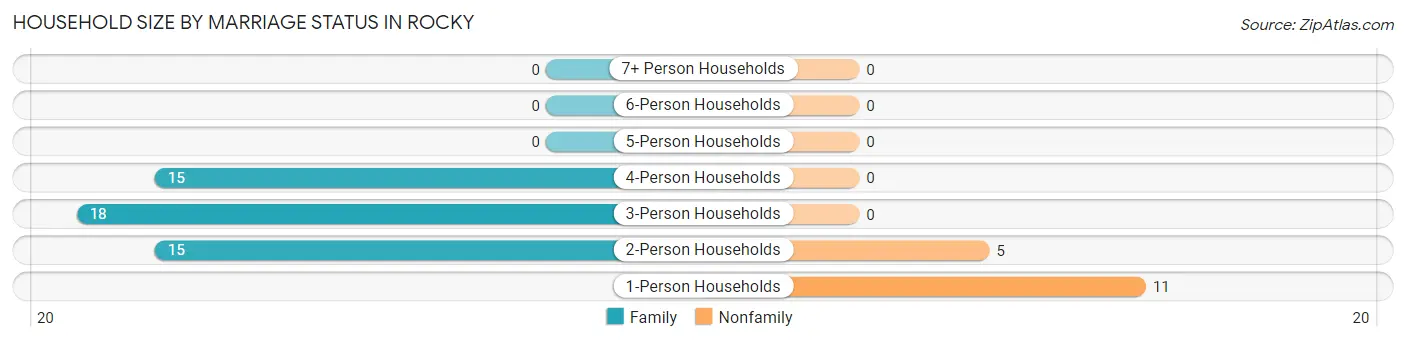
| Household Size | Family Households | Nonfamily Households |
| 1-Person Households | - | 11 (17.2%) |
| 2-Person Households | 15 (23.4%) | 5 (7.8%) |
| 3-Person Households | 18 (28.1%) | 0 (0.0%) |
| 4-Person Households | 15 (23.4%) | 0 (0.0%) |
| 5-Person Households | 0 (0.0%) | 0 (0.0%) |
| 6-Person Households | 0 (0.0%) | 0 (0.0%) |
| 7+ Person Households | 0 (0.0%) | 0 (0.0%) |
| Total | 48 (75.0%) | 16 (25.0%) |
Female Fertility in Rocky
Fertility by Age in Rocky
Average fertility rate in Rocky is 188.0 births per 1,000 women. Women in the age bracket of 20 to 34 years have the highest fertility rate with 240.0 births per 1,000 women. Women in the age bracket of 20 to 34 years acount for 100.0% of all women with births.
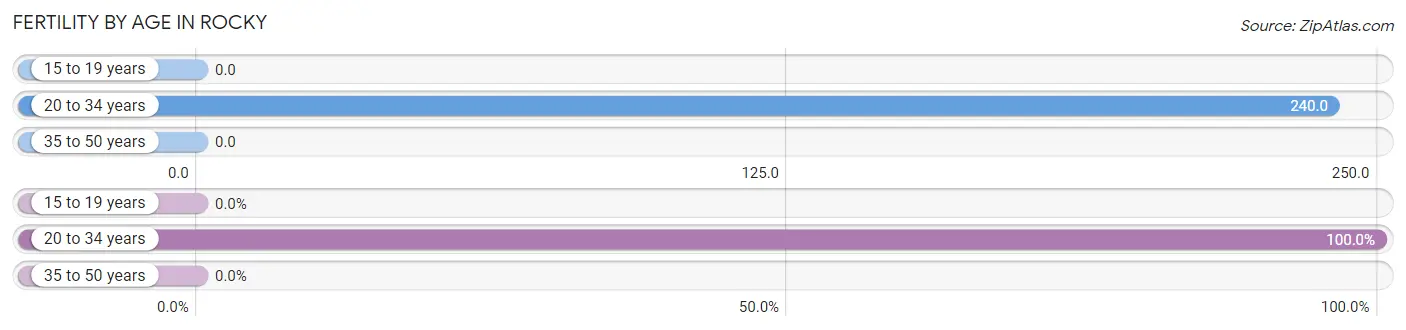
| Age Bracket | Women with Births | Births / 1,000 Women |
| 15 to 19 years | 0 (0.0%) | 0.0 |
| 20 to 34 years | 6 (100.0%) | 240.0 |
| 35 to 50 years | 0 (0.0%) | 0.0 |
| Total | 6 (100.0%) | 188.0 |
Fertility by Age by Marriage Status in Rocky
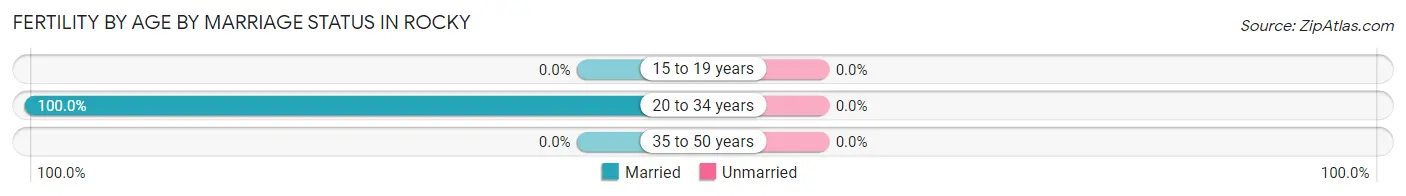
| Age Bracket | Married | Unmarried |
| 15 to 19 years | 0 (0.0%) | 0 (0.0%) |
| 20 to 34 years | 6 (100.0%) | 0 (0.0%) |
| 35 to 50 years | 0 (0.0%) | 0 (0.0%) |
| Total | 6 (100.0%) | 0 (0.0%) |
Fertility by Education in Rocky
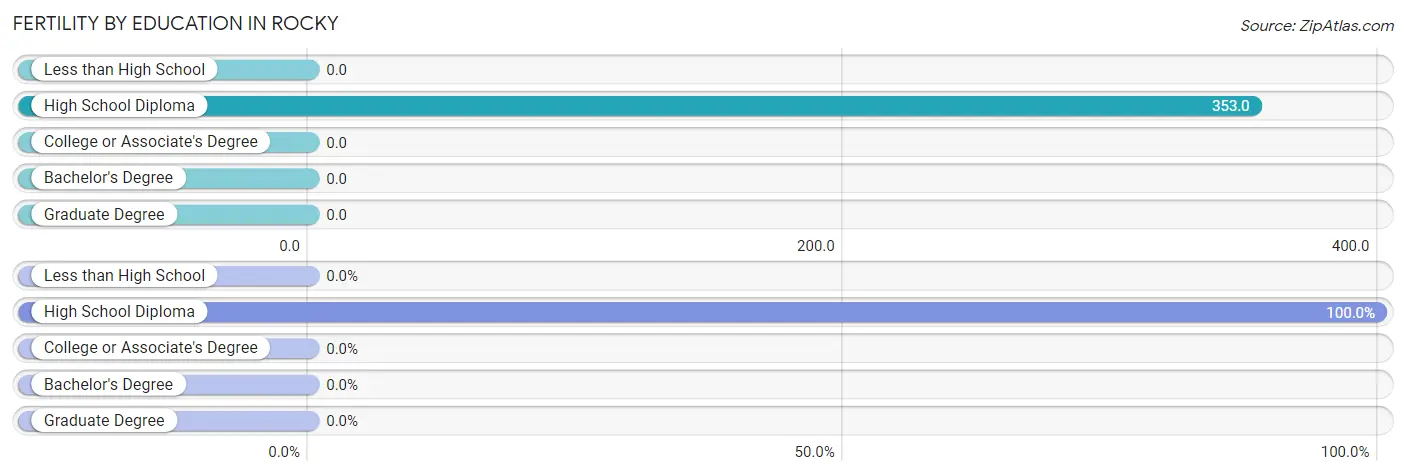
| Educational Attainment | Women with Births | Births / 1,000 Women |
| Less than High School | 0 (0.0%) | 0.0 |
| High School Diploma | 6 (100.0%) | 353.0 |
| College or Associate's Degree | 0 (0.0%) | 0.0 |
| Bachelor's Degree | 0 (0.0%) | 0.0 |
| Graduate Degree | 0 (0.0%) | 0.0 |
| Total | 6 (100.0%) | 188.0 |
Fertility by Education by Marriage Status in Rocky
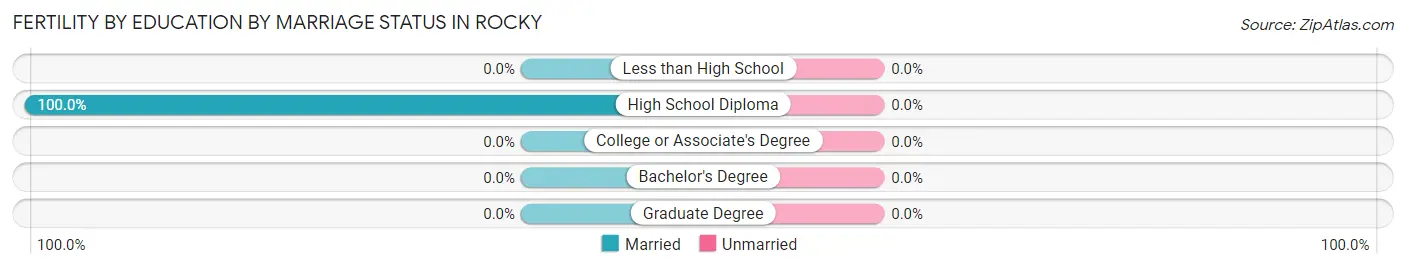
| Educational Attainment | Married | Unmarried |
| Less than High School | 0 (0.0%) | 0 (0.0%) |
| High School Diploma | 6 (100.0%) | 0 (0.0%) |
| College or Associate's Degree | 0 (0.0%) | 0 (0.0%) |
| Bachelor's Degree | 0 (0.0%) | 0 (0.0%) |
| Graduate Degree | 0 (0.0%) | 0 (0.0%) |
| Total | 6 (100.0%) | 0 (0.0%) |
Employment Characteristics in Rocky
Employment by Class of Employer in Rocky
Among the 80 employed individuals in Rocky, private company employees (54 | 67.5%), local government employees (11 | 13.8%), and self-employed (incorporated) (6 | 7.5%) make up the most common classes of employment.
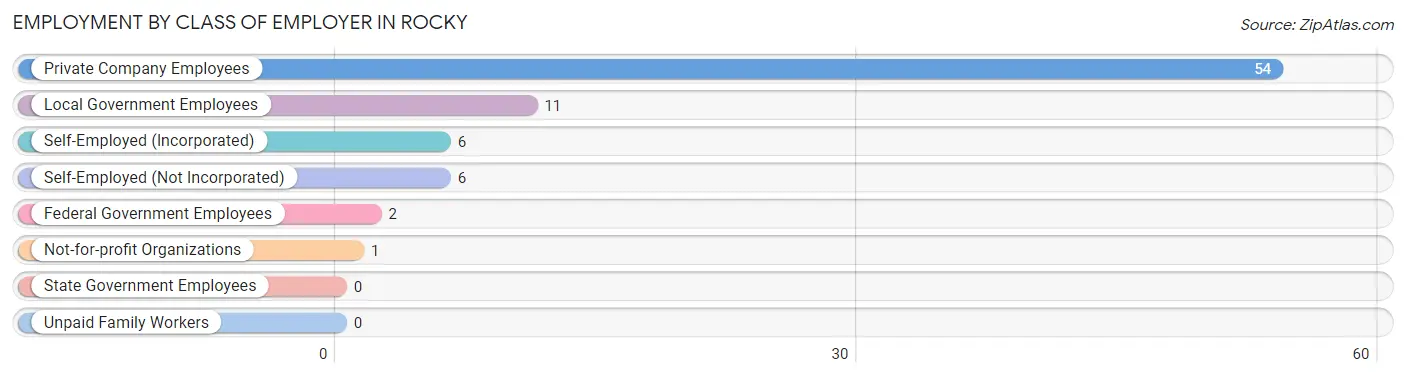
| Employer Class | # Employees | % Employees |
| Private Company Employees | 54 | 67.5% |
| Self-Employed (Incorporated) | 6 | 7.5% |
| Self-Employed (Not Incorporated) | 6 | 7.5% |
| Not-for-profit Organizations | 1 | 1.3% |
| Local Government Employees | 11 | 13.8% |
| State Government Employees | 0 | 0.0% |
| Federal Government Employees | 2 | 2.5% |
| Unpaid Family Workers | 0 | 0.0% |
| Total | 80 | 100.0% |
Employment Status by Age in Rocky
According to the labor force statistics for Rocky, out of the total population over 16 years of age (238), 44.1% or 105 individuals are in the labor force, with 16.2% or 17 of them unemployed. The age group with the highest labor force participation rate is 30 to 34 years, with 100.0% or 13 individuals in the labor force. Within the labor force, the 20 to 24 years age range has the highest percentage of unemployed individuals, with 55.6% or 10 of them being unemployed.
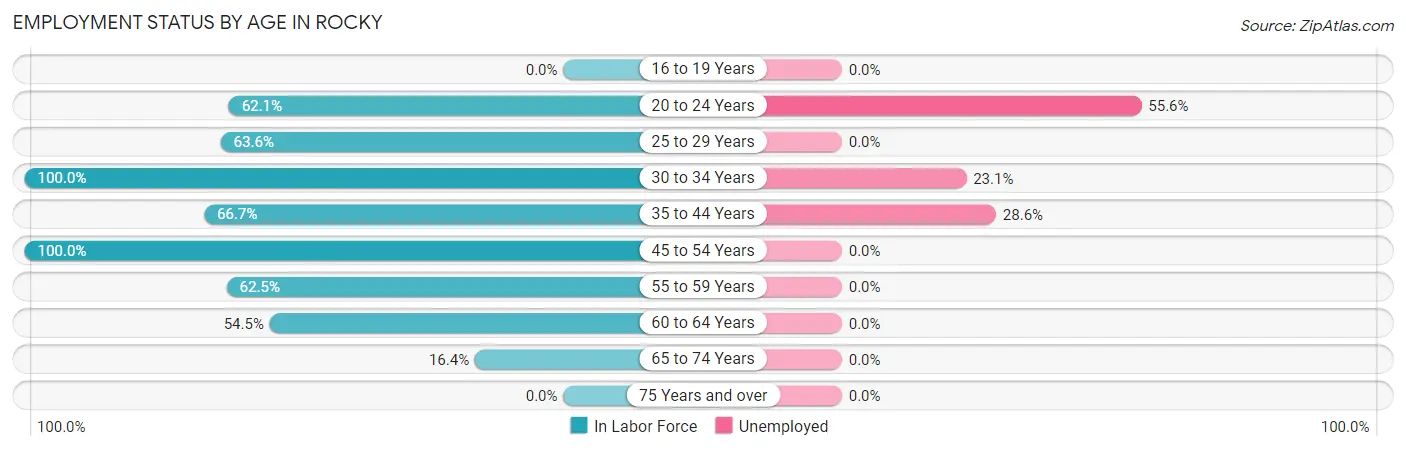
| Age Bracket | In Labor Force | Unemployed |
| 16 to 19 Years | 0 (0.0%) | 0 (0.0%) |
| 20 to 24 Years | 18 (62.1%) | 10 (55.6%) |
| 25 to 29 Years | 14 (63.6%) | 0 (0.0%) |
| 30 to 34 Years | 13 (100.0%) | 3 (23.1%) |
| 35 to 44 Years | 14 (66.7%) | 4 (28.6%) |
| 45 to 54 Years | 12 (100.0%) | 0 (0.0%) |
| 55 to 59 Years | 10 (62.5%) | 0 (0.0%) |
| 60 to 64 Years | 6 (54.5%) | 0 (0.0%) |
| 65 to 74 Years | 18 (16.4%) | 0 (0.0%) |
| 75 Years and over | 0 (0.0%) | 0 (0.0%) |
| Total | 105 (44.1%) | 17 (16.2%) |
Employment Status by Educational Attainment in Rocky
According to labor force statistics for Rocky, 72.6% of individuals (69) out of the total population between 25 and 64 years of age (95) are in the labor force, with 10.1% or 7 of them being unemployed. The group with the highest labor force participation rate are those with the educational attainment of college / associate degree, with 96.4% or 27 individuals in the labor force. Within the labor force, individuals with college / associate degree education have the highest percentage of unemployment, with 11.1% or 3 of them being unemployed.
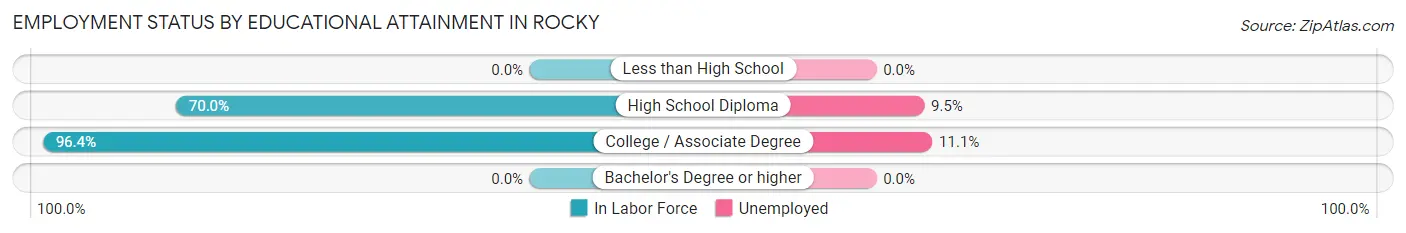
| Educational Attainment | In Labor Force | Unemployed |
| Less than High School | 0 (0.0%) | 0 (0.0%) |
| High School Diploma | 42 (70.0%) | 6 (9.5%) |
| College / Associate Degree | 27 (96.4%) | 3 (11.1%) |
| Bachelor's Degree or higher | 0 (0.0%) | 0 (0.0%) |
| Total | 69 (72.6%) | 10 (10.1%) |
Employment Occupations by Sex in Rocky
Management, Business, Science and Arts Occupations
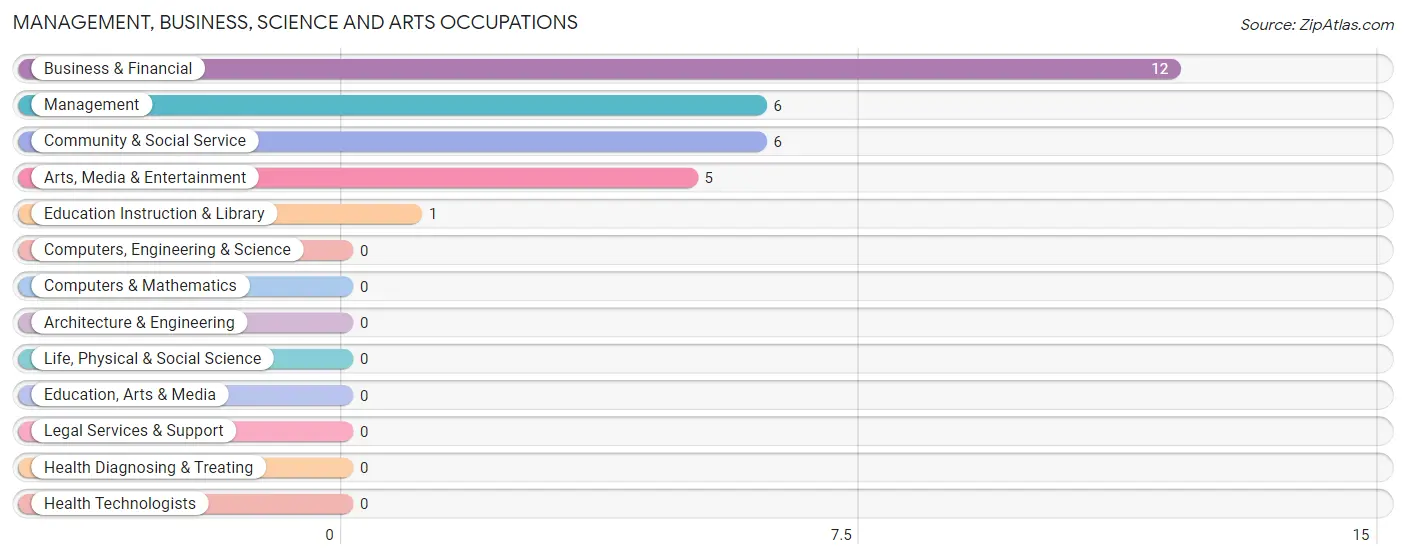
The most common Management, Business, Science and Arts occupations in Rocky are Business & Financial (12 | 13.6%), Management (6 | 6.8%), Community & Social Service (6 | 6.8%), Arts, Media & Entertainment (5 | 5.7%), and Education Instruction & Library (1 | 1.1%).
Management, Business, Science and Arts Occupations by Sex
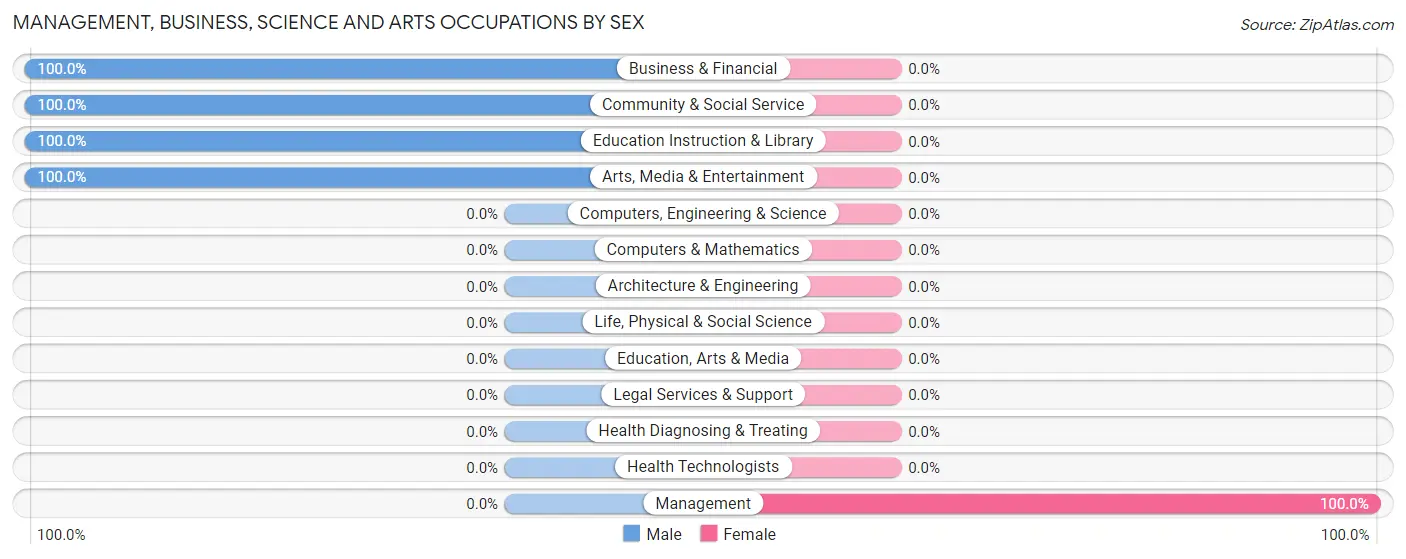
| Occupation | Male | Female |
| Management | 0 (0.0%) | 6 (100.0%) |
| Business & Financial | 12 (100.0%) | 0 (0.0%) |
| Computers, Engineering & Science | 0 (0.0%) | 0 (0.0%) |
| Computers & Mathematics | 0 (0.0%) | 0 (0.0%) |
| Architecture & Engineering | 0 (0.0%) | 0 (0.0%) |
| Life, Physical & Social Science | 0 (0.0%) | 0 (0.0%) |
| Community & Social Service | 6 (100.0%) | 0 (0.0%) |
| Education, Arts & Media | 0 (0.0%) | 0 (0.0%) |
| Legal Services & Support | 0 (0.0%) | 0 (0.0%) |
| Education Instruction & Library | 1 (100.0%) | 0 (0.0%) |
| Arts, Media & Entertainment | 5 (100.0%) | 0 (0.0%) |
| Health Diagnosing & Treating | 0 (0.0%) | 0 (0.0%) |
| Health Technologists | 0 (0.0%) | 0 (0.0%) |
| Total (Category) | 18 (75.0%) | 6 (25.0%) |
| Total (Overall) | 68 (77.3%) | 20 (22.7%) |
Services Occupations
The most common Services occupations in Rocky are Security & Protection (1 | 1.1%), Law Enforcement (1 | 1.1%), and Personal Care & Service (1 | 1.1%).
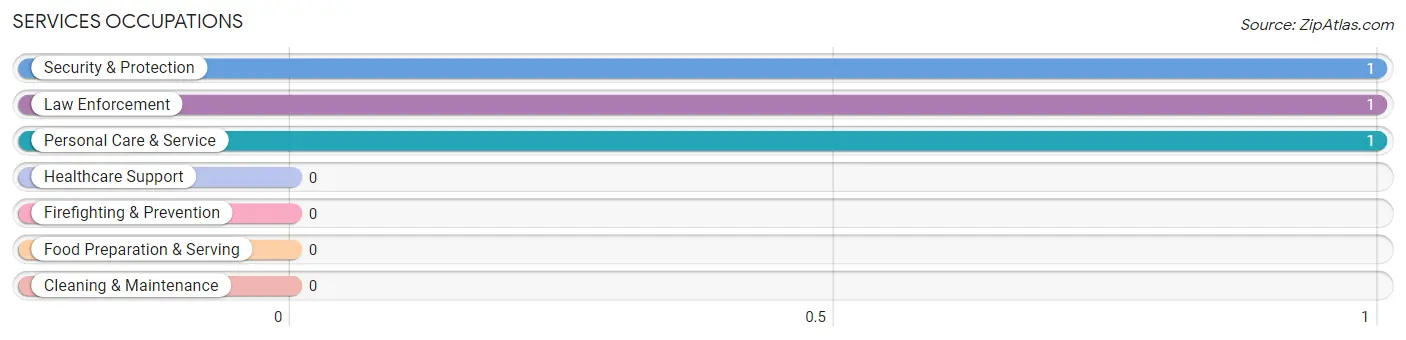
Services Occupations by Sex
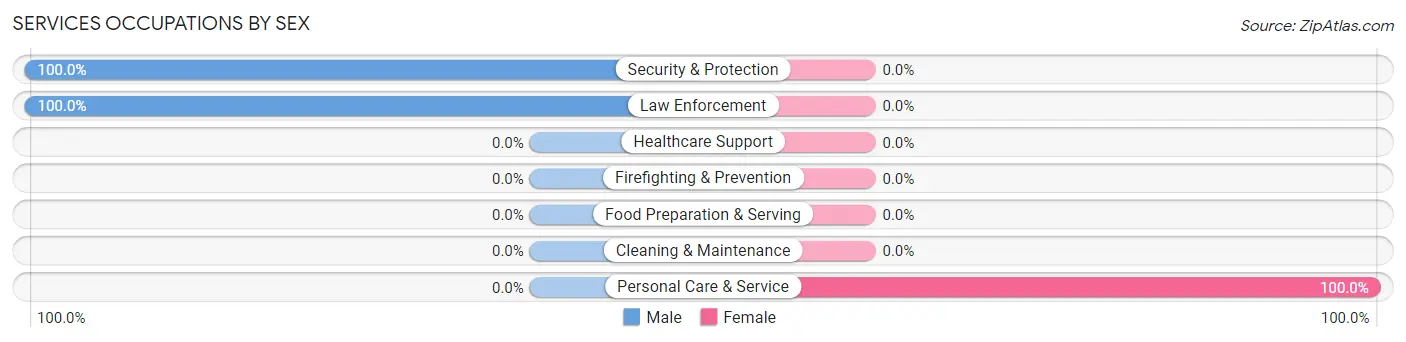
| Occupation | Male | Female |
| Healthcare Support | 0 (0.0%) | 0 (0.0%) |
| Security & Protection | 1 (100.0%) | 0 (0.0%) |
| Firefighting & Prevention | 0 (0.0%) | 0 (0.0%) |
| Law Enforcement | 1 (100.0%) | 0 (0.0%) |
| Food Preparation & Serving | 0 (0.0%) | 0 (0.0%) |
| Cleaning & Maintenance | 0 (0.0%) | 0 (0.0%) |
| Personal Care & Service | 0 (0.0%) | 1 (100.0%) |
| Total (Category) | 1 (50.0%) | 1 (50.0%) |
| Total (Overall) | 68 (77.3%) | 20 (22.7%) |
Sales and Office Occupations
The most common Sales and Office occupations in Rocky are Office & Administration (6 | 6.8%), and Sales & Related (4 | 4.5%).
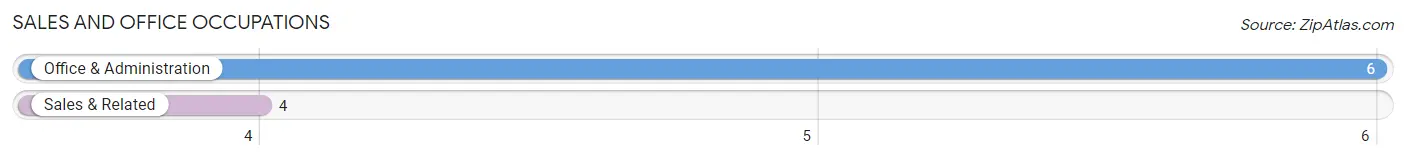
Sales and Office Occupations by Sex

| Occupation | Male | Female |
| Sales & Related | 0 (0.0%) | 4 (100.0%) |
| Office & Administration | 2 (33.3%) | 4 (66.7%) |
| Total (Category) | 2 (20.0%) | 8 (80.0%) |
| Total (Overall) | 68 (77.3%) | 20 (22.7%) |
Natural Resources, Construction and Maintenance Occupations
The most common Natural Resources, Construction and Maintenance occupations in Rocky are , and Construction & Extraction (21 | 23.9%).
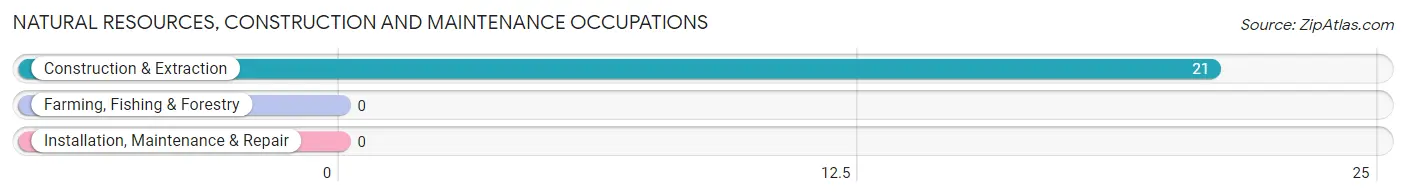
Natural Resources, Construction and Maintenance Occupations by Sex
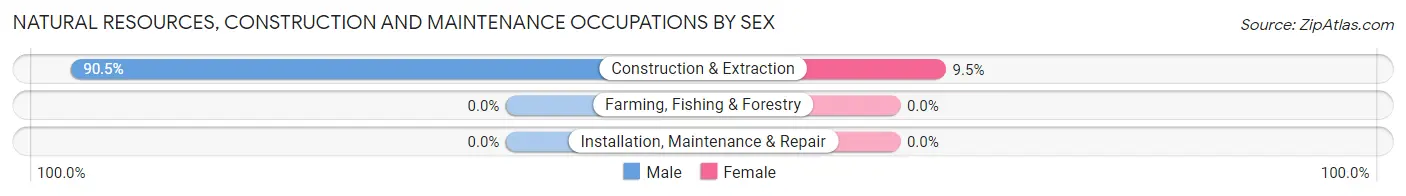
| Occupation | Male | Female |
| Farming, Fishing & Forestry | 0 (0.0%) | 0 (0.0%) |
| Construction & Extraction | 19 (90.5%) | 2 (9.5%) |
| Installation, Maintenance & Repair | 0 (0.0%) | 0 (0.0%) |
| Total (Category) | 19 (90.5%) | 2 (9.5%) |
| Total (Overall) | 68 (77.3%) | 20 (22.7%) |
Production, Transportation and Moving Occupations
The most common Production, Transportation and Moving occupations in Rocky are Transportation (14 | 15.9%), Production (13 | 14.8%), and Material Moving (4 | 4.5%).
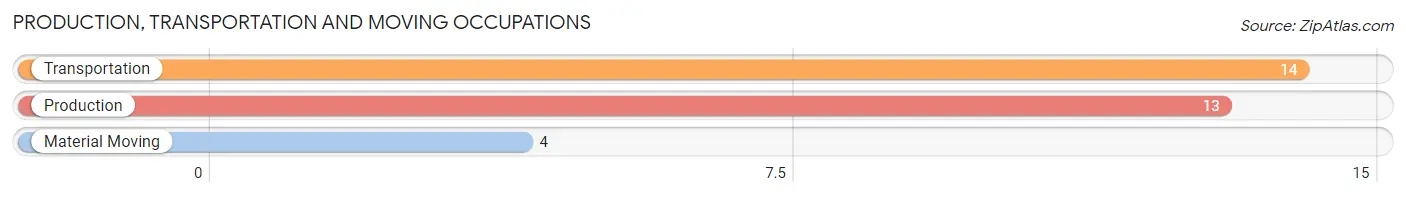
Production, Transportation and Moving Occupations by Sex
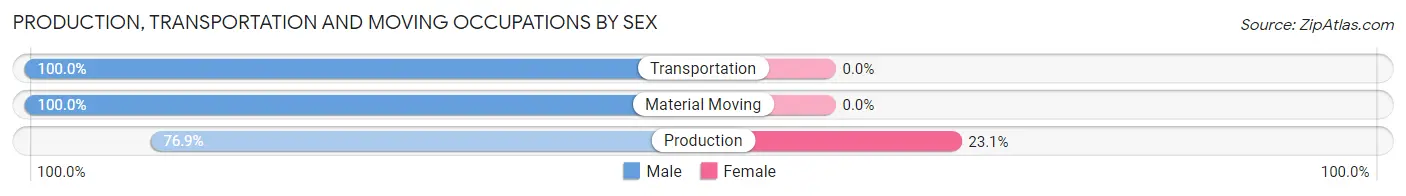
| Occupation | Male | Female |
| Production | 10 (76.9%) | 3 (23.1%) |
| Transportation | 14 (100.0%) | 0 (0.0%) |
| Material Moving | 4 (100.0%) | 0 (0.0%) |
| Total (Category) | 28 (90.3%) | 3 (9.7%) |
| Total (Overall) | 68 (77.3%) | 20 (22.7%) |
Employment Industries by Sex in Rocky
Employment Industries in Rocky
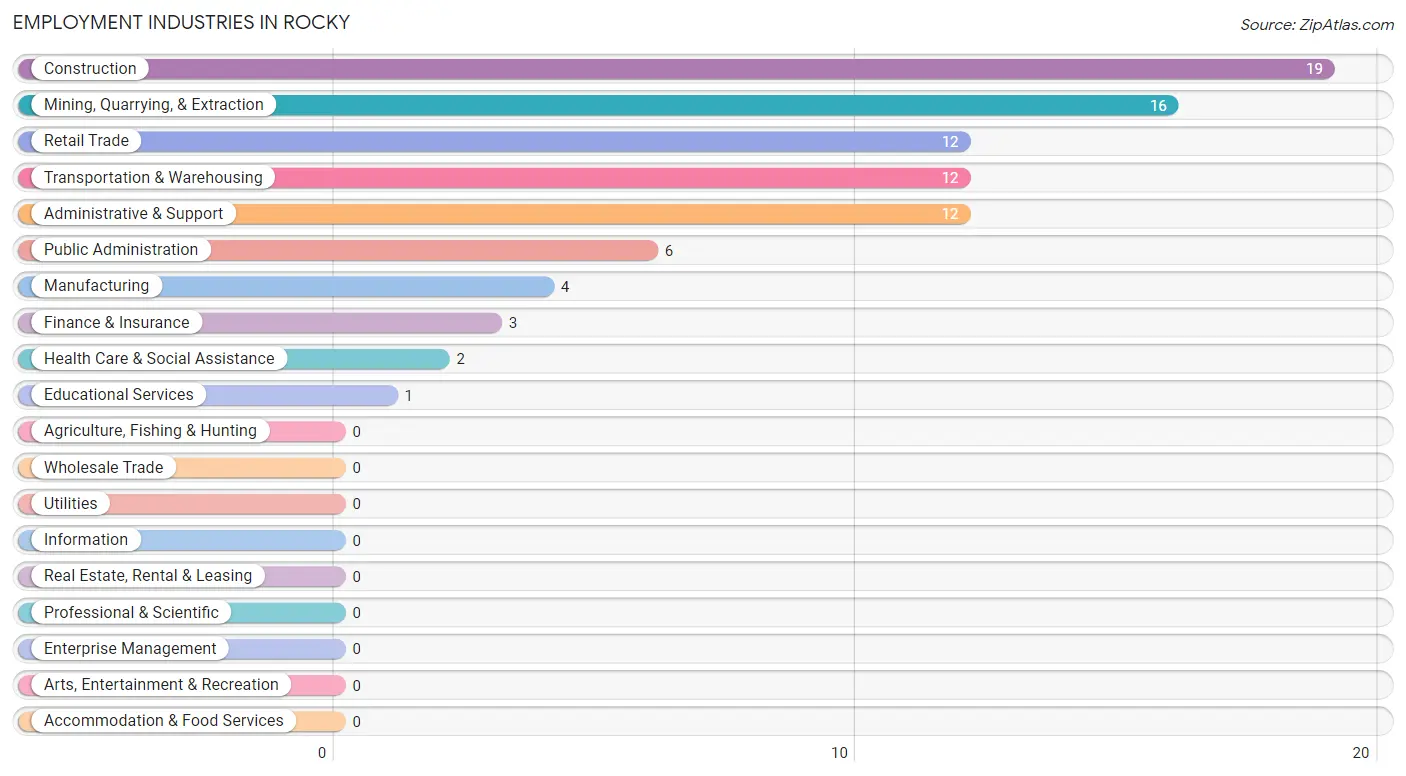
The major employment industries in Rocky include Construction (19 | 21.6%), Mining, Quarrying, & Extraction (16 | 18.2%), Retail Trade (12 | 13.6%), Transportation & Warehousing (12 | 13.6%), and Administrative & Support (12 | 13.6%).
Employment Industries by Sex in Rocky
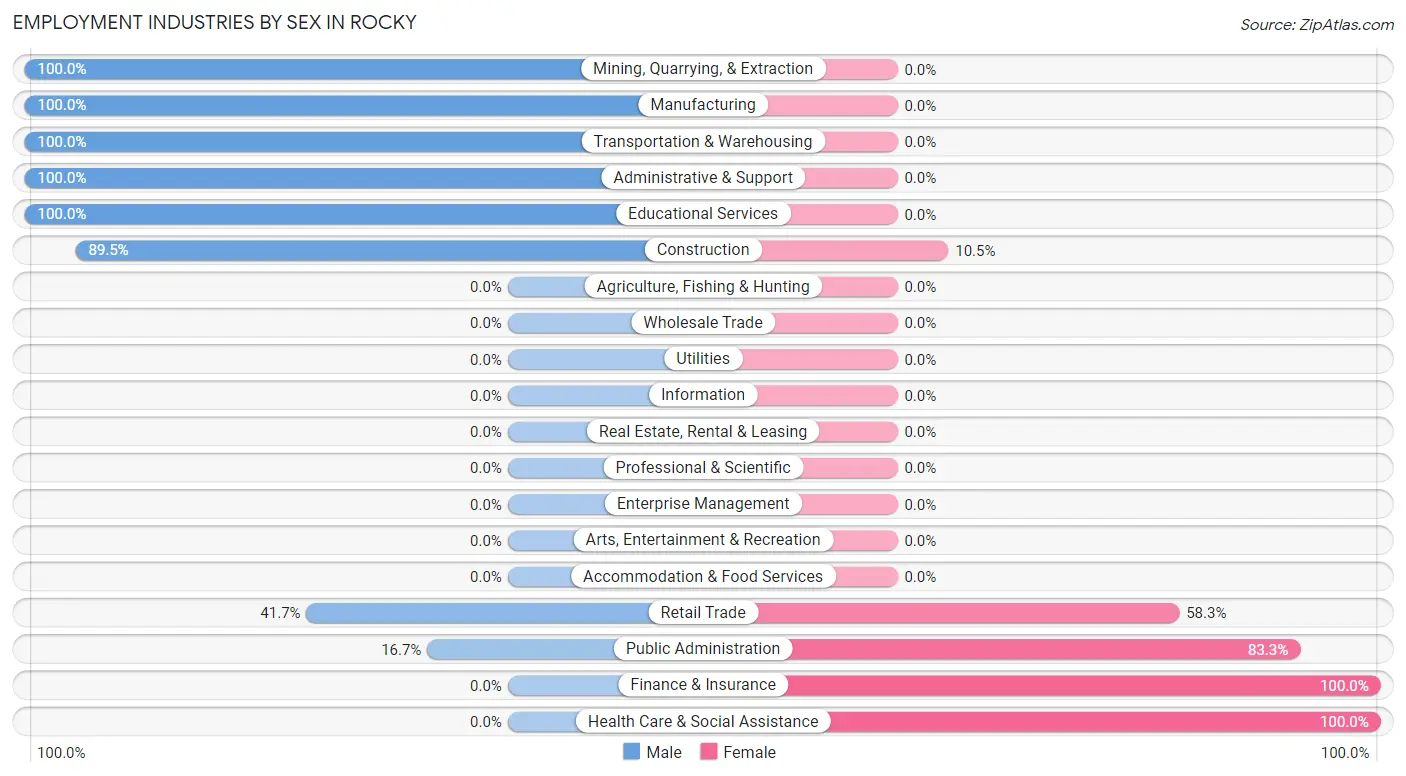
The Rocky industries that see more men than women are Mining, Quarrying, & Extraction (100.0%), Manufacturing (100.0%), and Transportation & Warehousing (100.0%), whereas the industries that tend to have a higher number of women are Finance & Insurance (100.0%), Health Care & Social Assistance (100.0%), and Public Administration (83.3%).
| Industry | Male | Female |
| Agriculture, Fishing & Hunting | 0 (0.0%) | 0 (0.0%) |
| Mining, Quarrying, & Extraction | 16 (100.0%) | 0 (0.0%) |
| Construction | 17 (89.5%) | 2 (10.5%) |
| Manufacturing | 4 (100.0%) | 0 (0.0%) |
| Wholesale Trade | 0 (0.0%) | 0 (0.0%) |
| Retail Trade | 5 (41.7%) | 7 (58.3%) |
| Transportation & Warehousing | 12 (100.0%) | 0 (0.0%) |
| Utilities | 0 (0.0%) | 0 (0.0%) |
| Information | 0 (0.0%) | 0 (0.0%) |
| Finance & Insurance | 0 (0.0%) | 3 (100.0%) |
| Real Estate, Rental & Leasing | 0 (0.0%) | 0 (0.0%) |
| Professional & Scientific | 0 (0.0%) | 0 (0.0%) |
| Enterprise Management | 0 (0.0%) | 0 (0.0%) |
| Administrative & Support | 12 (100.0%) | 0 (0.0%) |
| Educational Services | 1 (100.0%) | 0 (0.0%) |
| Health Care & Social Assistance | 0 (0.0%) | 2 (100.0%) |
| Arts, Entertainment & Recreation | 0 (0.0%) | 0 (0.0%) |
| Accommodation & Food Services | 0 (0.0%) | 0 (0.0%) |
| Public Administration | 1 (16.7%) | 5 (83.3%) |
| Total | 68 (77.3%) | 20 (22.7%) |
Education in Rocky
School Enrollment in Rocky
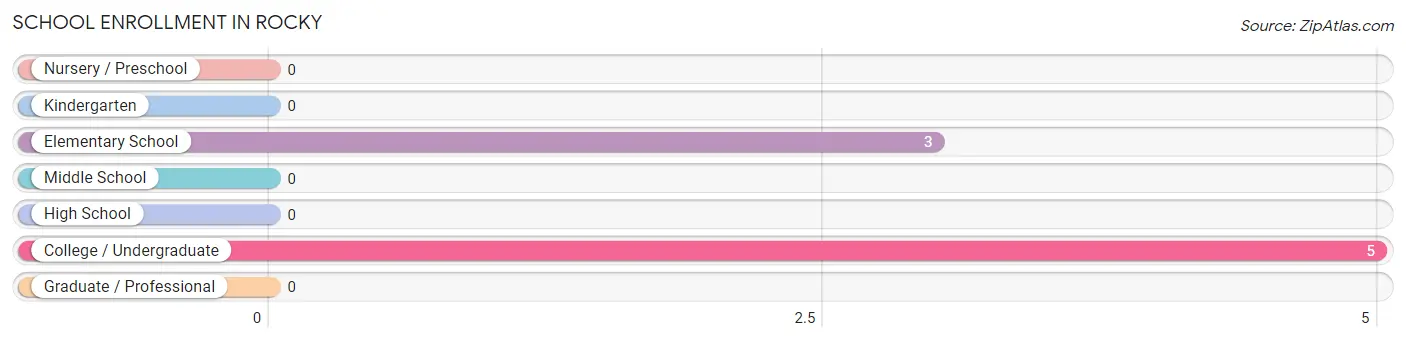
The most common levels of schooling among the 8 students in Rocky are college / undergraduate (5 | 62.5%), and elementary school (3 | 37.5%).
| School Level | # Students | % Students |
| Nursery / Preschool | 0 | 0.0% |
| Kindergarten | 0 | 0.0% |
| Elementary School | 3 | 37.5% |
| Middle School | 0 | 0.0% |
| High School | 0 | 0.0% |
| College / Undergraduate | 5 | 62.5% |
| Graduate / Professional | 0 | 0.0% |
| Total | 8 | 100.0% |
School Enrollment by Age by Funding Source in Rocky
| Age Bracket | Public School | Private School |
| 3 to 4 Year Olds | 0 (0.0%) | 0 (0.0%) |
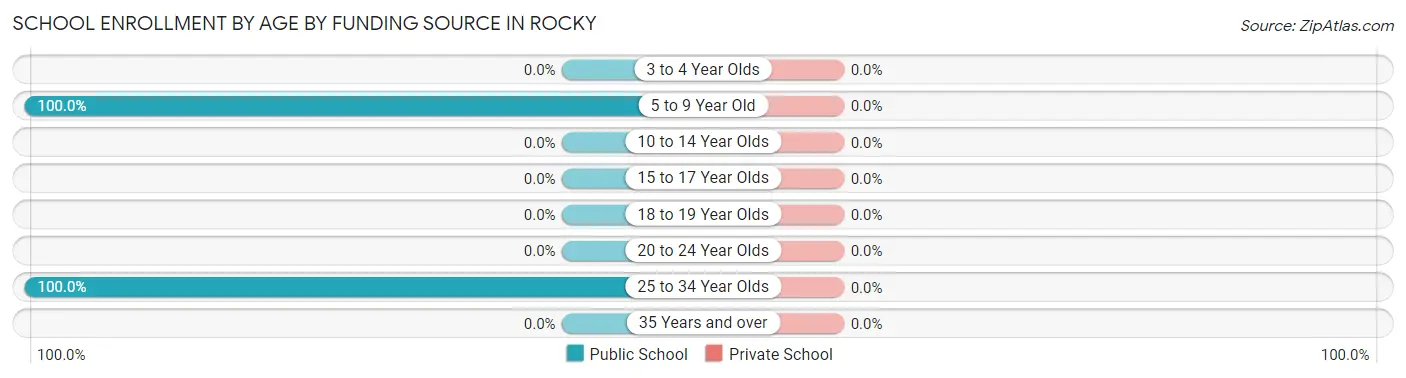
| 5 to 9 Year Old | 3 (100.0%) | 0 (0.0%) |
| 10 to 14 Year Olds | 0 (0.0%) | 0 (0.0%) |
| 15 to 17 Year Olds | 0 (0.0%) | 0 (0.0%) |
| 18 to 19 Year Olds | 0 (0.0%) | 0 (0.0%) |
| 20 to 24 Year Olds | 0 (0.0%) | 0 (0.0%) |
| 25 to 34 Year Olds | 5 (100.0%) | 0 (0.0%) |
| 35 Years and over | 0 (0.0%) | 0 (0.0%) |
| Total | 8 (100.0%) | 0 (0.0%) |
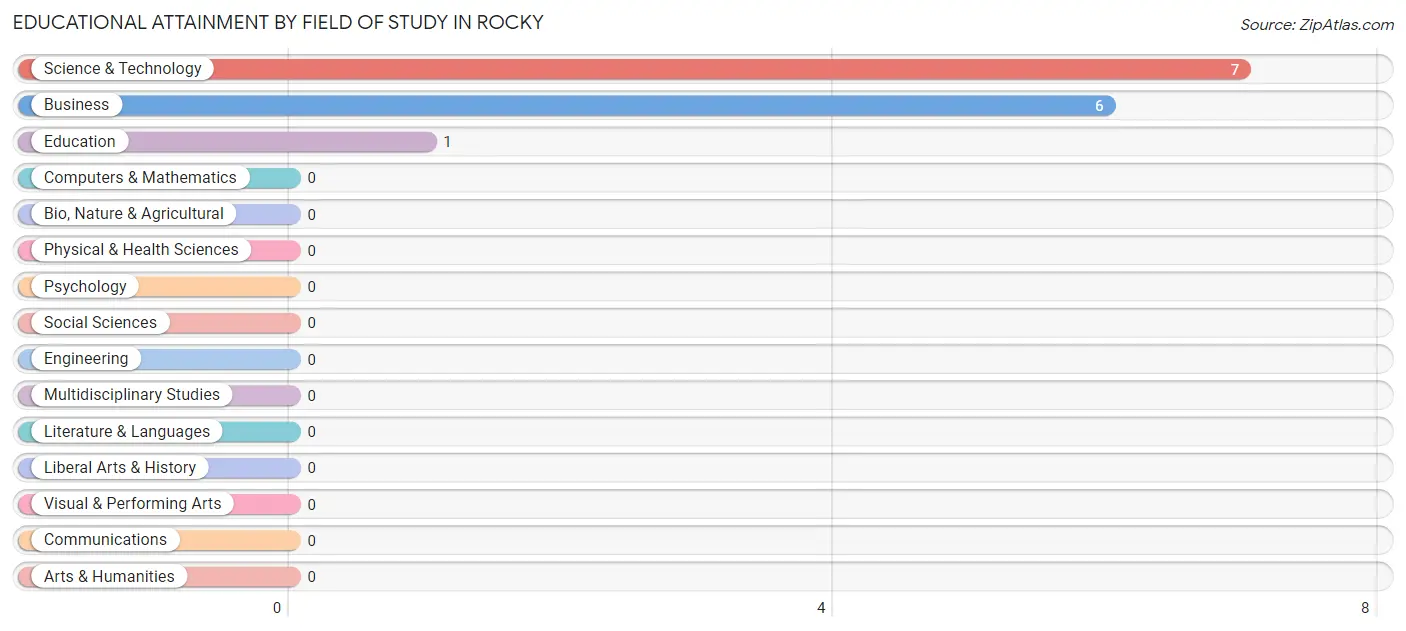
Educational Attainment by Field of Study in Rocky
Science & technology (7 | 50.0%), business (6 | 42.9%), and education (1 | 7.1%) are the most common fields of study among 14 individuals in Rocky who have obtained a bachelor's degree or higher.
| Field of Study | # Graduates | % Graduates |
| Computers & Mathematics | 0 | 0.0% |
| Bio, Nature & Agricultural | 0 | 0.0% |
| Physical & Health Sciences | 0 | 0.0% |
| Psychology | 0 | 0.0% |
| Social Sciences | 0 | 0.0% |
| Engineering | 0 | 0.0% |
| Multidisciplinary Studies | 0 | 0.0% |
| Science & Technology | 7 | 50.0% |
| Business | 6 | 42.9% |
| Education | 1 | 7.1% |
| Literature & Languages | 0 | 0.0% |
| Liberal Arts & History | 0 | 0.0% |
| Visual & Performing Arts | 0 | 0.0% |
| Communications | 0 | 0.0% |
| Arts & Humanities | 0 | 0.0% |
| Total | 14 | 100.0% |
Transportation & Commute in Rocky
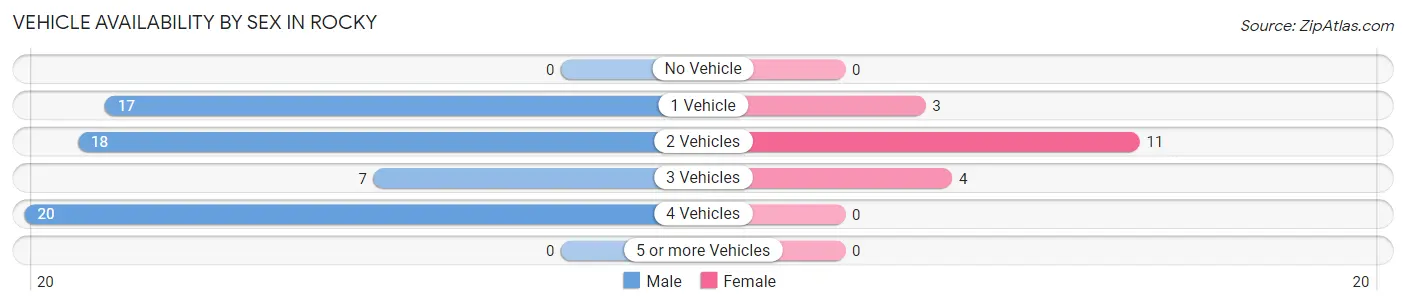
Vehicle Availability by Sex in Rocky
The most prevalent vehicle ownership categories in Rocky are males with 4 vehicles (20, accounting for 32.3%) and females with 4 vehicles (0, making up 111.1%).
| Vehicles Available | Male | Female |
| No Vehicle | 0 (0.0%) | 0 (0.0%) |
| 1 Vehicle | 17 (27.4%) | 3 (16.7%) |
| 2 Vehicles | 18 (29.0%) | 11 (61.1%) |
| 3 Vehicles | 7 (11.3%) | 4 (22.2%) |
| 4 Vehicles | 20 (32.3%) | 0 (0.0%) |
| 5 or more Vehicles | 0 (0.0%) | 0 (0.0%) |
| Total | 62 (100.0%) | 18 (100.0%) |
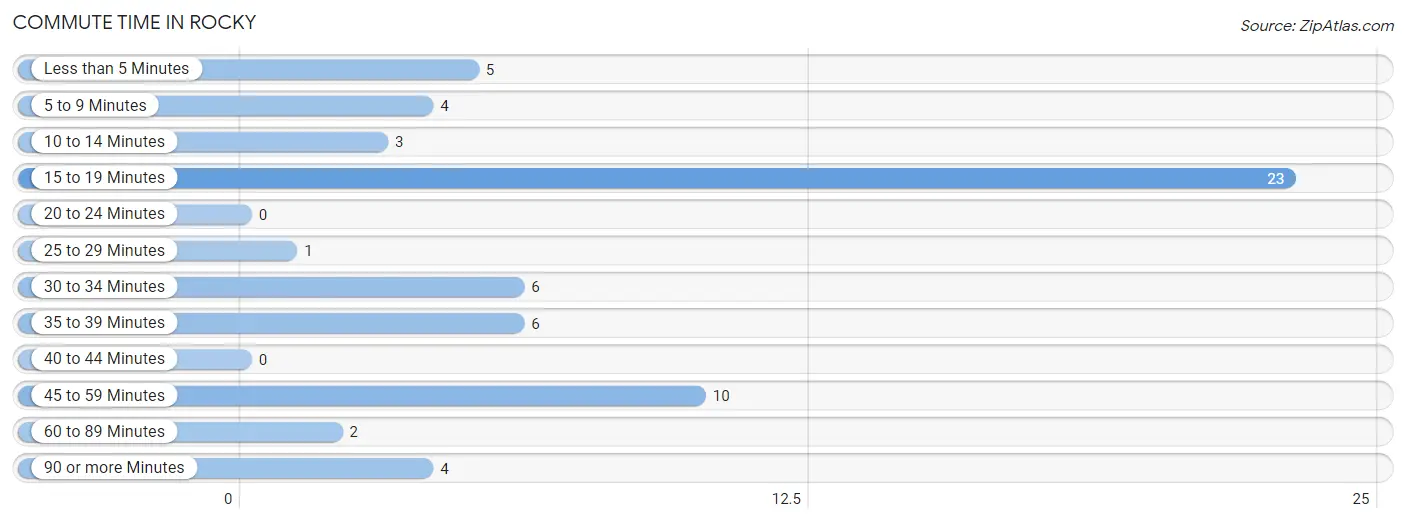
Commute Time in Rocky
The most frequently occuring commute durations in Rocky are 15 to 19 minutes (23 commuters, 35.9%), 45 to 59 minutes (10 commuters, 15.6%), and 30 to 34 minutes (6 commuters, 9.4%).
| Commute Time | # Commuters | % Commuters |
| Less than 5 Minutes | 5 | 7.8% |
| 5 to 9 Minutes | 4 | 6.2% |
| 10 to 14 Minutes | 3 | 4.7% |
| 15 to 19 Minutes | 23 | 35.9% |
| 20 to 24 Minutes | 0 | 0.0% |
| 25 to 29 Minutes | 1 | 1.6% |
| 30 to 34 Minutes | 6 | 9.4% |
| 35 to 39 Minutes | 6 | 9.4% |
| 40 to 44 Minutes | 0 | 0.0% |
| 45 to 59 Minutes | 10 | 15.6% |
| 60 to 89 Minutes | 2 | 3.1% |
| 90 or more Minutes | 4 | 6.2% |
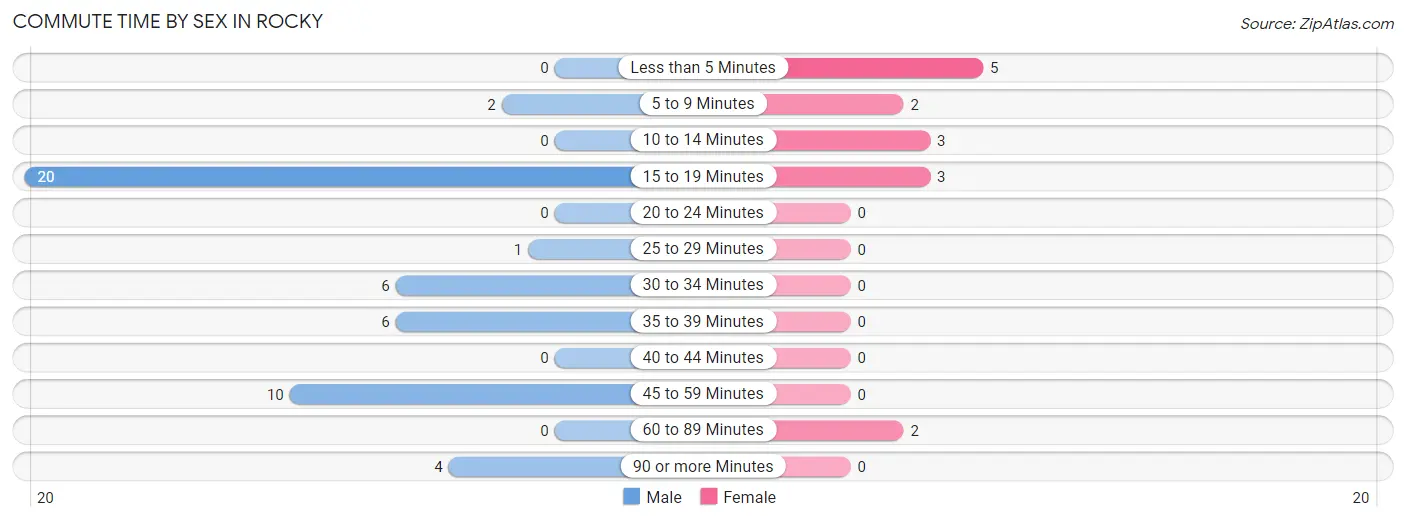
Commute Time by Sex in Rocky
The most common commute times in Rocky are 15 to 19 minutes (20 commuters, 40.8%) for males and less than 5 minutes (5 commuters, 33.3%) for females.
| Commute Time | Male | Female |
| Less than 5 Minutes | 0 (0.0%) | 5 (33.3%) |
| 5 to 9 Minutes | 2 (4.1%) | 2 (13.3%) |
| 10 to 14 Minutes | 0 (0.0%) | 3 (20.0%) |
| 15 to 19 Minutes | 20 (40.8%) | 3 (20.0%) |
| 20 to 24 Minutes | 0 (0.0%) | 0 (0.0%) |
| 25 to 29 Minutes | 1 (2.0%) | 0 (0.0%) |
| 30 to 34 Minutes | 6 (12.2%) | 0 (0.0%) |
| 35 to 39 Minutes | 6 (12.2%) | 0 (0.0%) |
| 40 to 44 Minutes | 0 (0.0%) | 0 (0.0%) |
| 45 to 59 Minutes | 10 (20.4%) | 0 (0.0%) |
| 60 to 89 Minutes | 0 (0.0%) | 2 (13.3%) |
| 90 or more Minutes | 4 (8.2%) | 0 (0.0%) |
Time of Departure to Work by Sex in Rocky
The most frequent times of departure to work in Rocky are 7:00 AM to 7:29 AM (15, 30.6%) for males and 4:00 PM to 11:59 PM (5, 33.3%) for females.
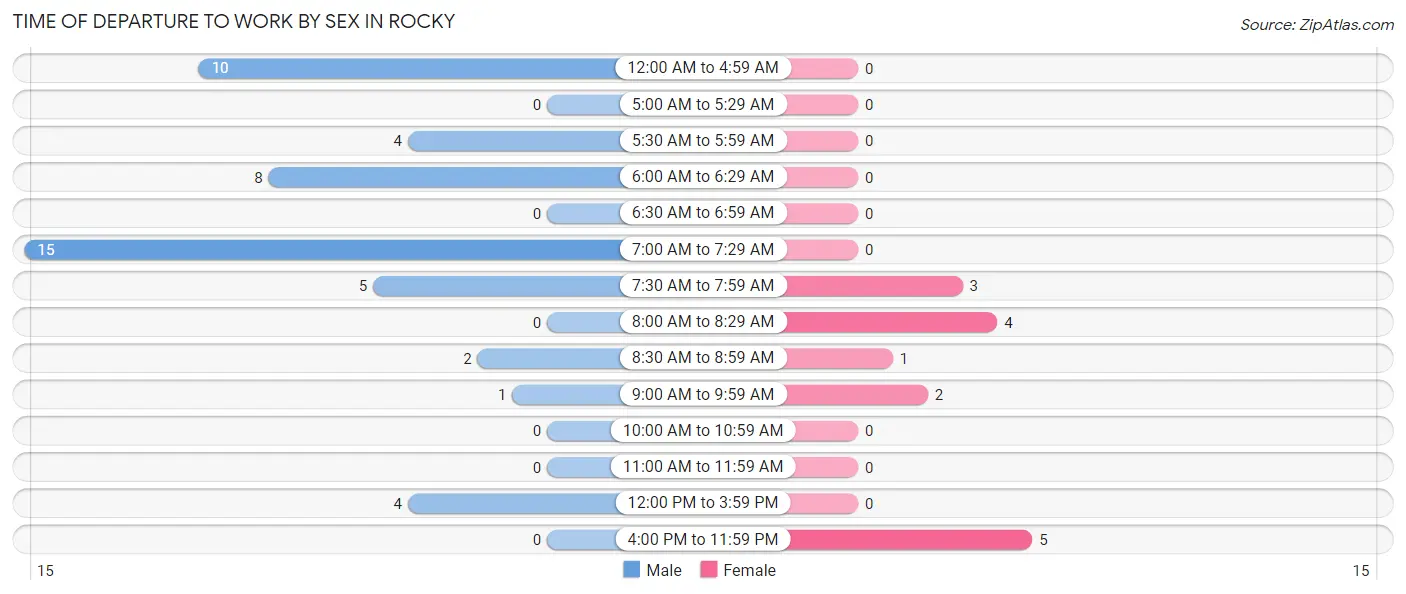
| Time of Departure | Male | Female |
| 12:00 AM to 4:59 AM | 10 (20.4%) | 0 (0.0%) |
| 5:00 AM to 5:29 AM | 0 (0.0%) | 0 (0.0%) |
| 5:30 AM to 5:59 AM | 4 (8.2%) | 0 (0.0%) |
| 6:00 AM to 6:29 AM | 8 (16.3%) | 0 (0.0%) |
| 6:30 AM to 6:59 AM | 0 (0.0%) | 0 (0.0%) |
| 7:00 AM to 7:29 AM | 15 (30.6%) | 0 (0.0%) |
| 7:30 AM to 7:59 AM | 5 (10.2%) | 3 (20.0%) |
| 8:00 AM to 8:29 AM | 0 (0.0%) | 4 (26.7%) |
| 8:30 AM to 8:59 AM | 2 (4.1%) | 1 (6.7%) |
| 9:00 AM to 9:59 AM | 1 (2.0%) | 2 (13.3%) |
| 10:00 AM to 10:59 AM | 0 (0.0%) | 0 (0.0%) |
| 11:00 AM to 11:59 AM | 0 (0.0%) | 0 (0.0%) |
| 12:00 PM to 3:59 PM | 4 (8.2%) | 0 (0.0%) |
| 4:00 PM to 11:59 PM | 0 (0.0%) | 5 (33.3%) |
| Total | 49 (100.0%) | 15 (100.0%) |
Housing Occupancy in Rocky
Occupancy by Ownership in Rocky
Of the total 64 dwellings in Rocky, owner-occupied units account for 49 (76.6%), while renter-occupied units make up 15 (23.4%).
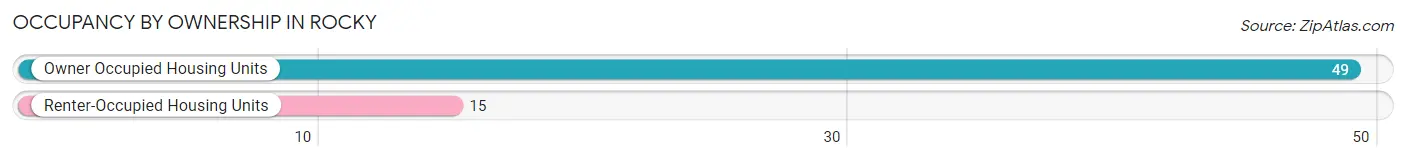
| Occupancy | # Housing Units | % Housing Units |
| Owner Occupied Housing Units | 49 | 76.6% |
| Renter-Occupied Housing Units | 15 | 23.4% |
| Total Occupied Housing Units | 64 | 100.0% |
Occupancy by Household Size in Rocky
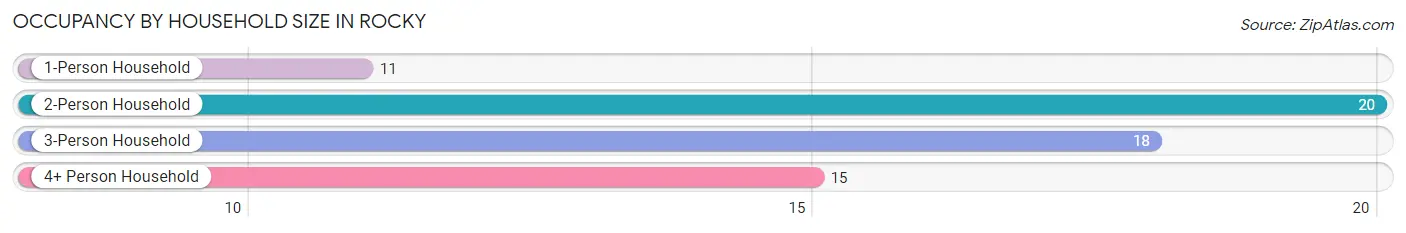
| Household Size | # Housing Units | % Housing Units |
| 1-Person Household | 11 | 17.2% |
| 2-Person Household | 20 | 31.2% |
| 3-Person Household | 18 | 28.1% |
| 4+ Person Household | 15 | 23.4% |
| Total Housing Units | 64 | 100.0% |
Occupancy by Ownership by Household Size in Rocky
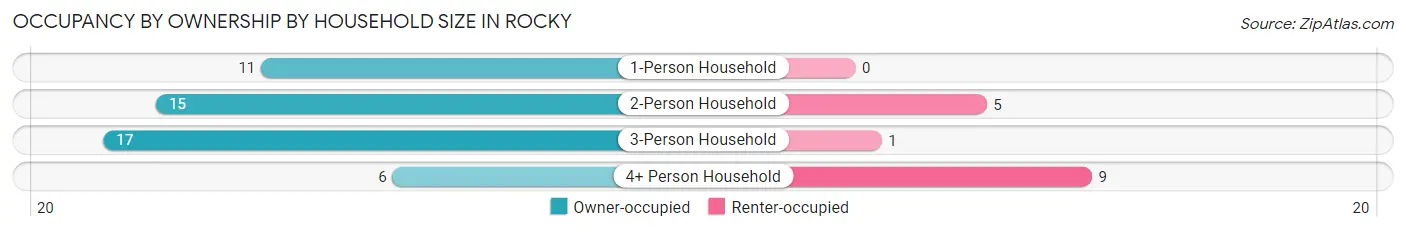
| Household Size | Owner-occupied | Renter-occupied |
| 1-Person Household | 11 (100.0%) | 0 (0.0%) |
| 2-Person Household | 15 (75.0%) | 5 (25.0%) |
| 3-Person Household | 17 (94.4%) | 1 (5.6%) |
| 4+ Person Household | 6 (40.0%) | 9 (60.0%) |
| Total Housing Units | 49 (76.6%) | 15 (23.4%) |
Occupancy by Educational Attainment in Rocky
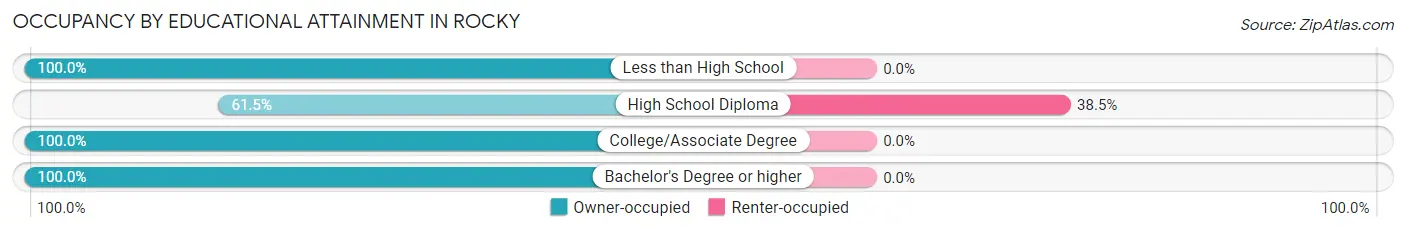
| Household Size | Owner-occupied | Renter-occupied |
| Less than High School | 3 (100.0%) | 0 (0.0%) |
| High School Diploma | 24 (61.5%) | 15 (38.5%) |
| College/Associate Degree | 9 (100.0%) | 0 (0.0%) |
| Bachelor's Degree or higher | 13 (100.0%) | 0 (0.0%) |
Occupancy by Age of Householder in Rocky
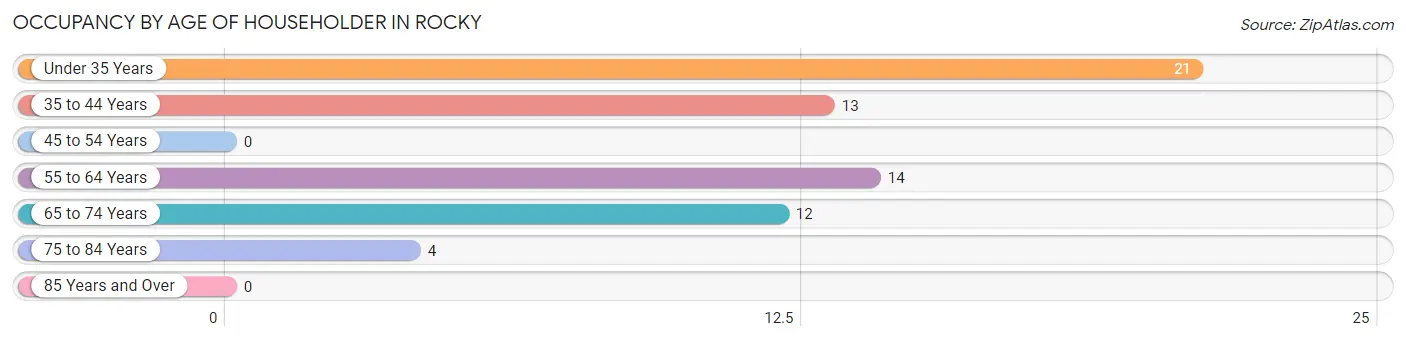
| Age Bracket | # Households | % Households |
| Under 35 Years | 21 | 32.8% |
| 35 to 44 Years | 13 | 20.3% |
| 45 to 54 Years | 0 | 0.0% |
| 55 to 64 Years | 14 | 21.9% |
| 65 to 74 Years | 12 | 18.8% |
| 75 to 84 Years | 4 | 6.2% |
| 85 Years and Over | 0 | 0.0% |
| Total | 64 | 100.0% |
Housing Finances in Rocky
Median Income by Occupancy in Rocky
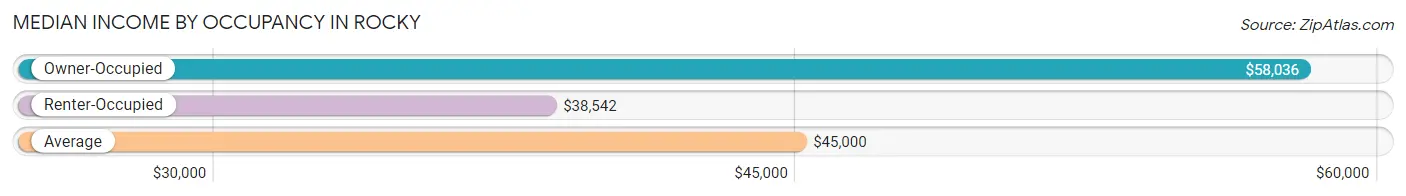
| Occupancy Type | # Households | Median Income |
| Owner-Occupied | 49 (76.6%) | $58,036 |
| Renter-Occupied | 15 (23.4%) | $38,542 |
| Average | 64 (100.0%) | $45,000 |
Occupancy by Householder Income Bracket in Rocky
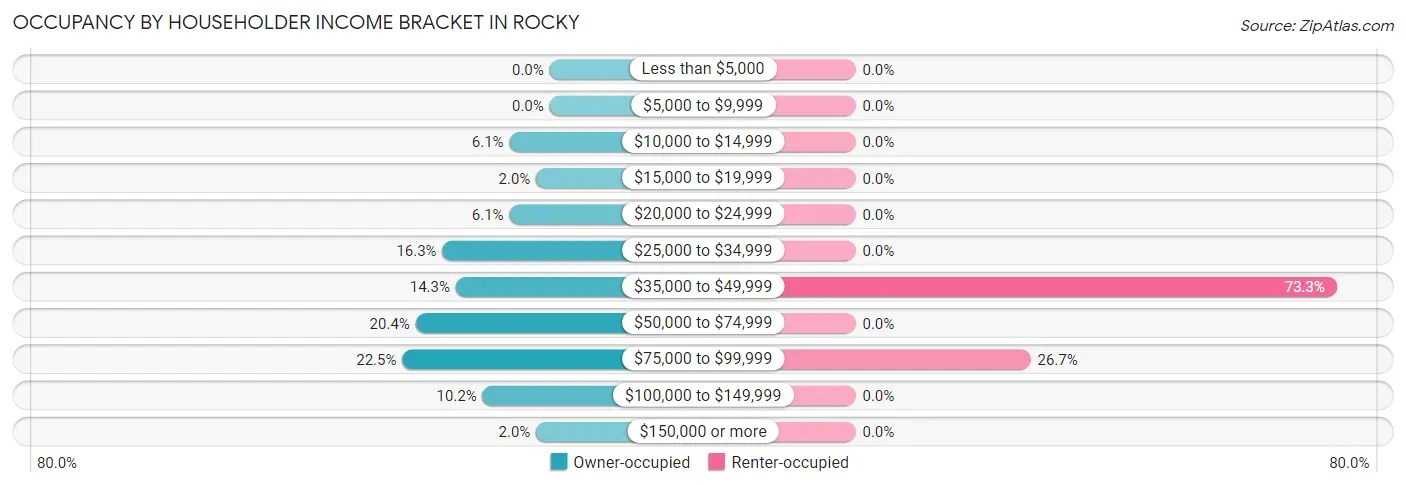
| Income Bracket | Owner-occupied | Renter-occupied |
| Less than $5,000 | 0 (0.0%) | 0 (0.0%) |
| $5,000 to $9,999 | 0 (0.0%) | 0 (0.0%) |
| $10,000 to $14,999 | 3 (6.1%) | 0 (0.0%) |
| $15,000 to $19,999 | 1 (2.0%) | 0 (0.0%) |
| $20,000 to $24,999 | 3 (6.1%) | 0 (0.0%) |
| $25,000 to $34,999 | 8 (16.3%) | 0 (0.0%) |
| $35,000 to $49,999 | 7 (14.3%) | 11 (73.3%) |
| $50,000 to $74,999 | 10 (20.4%) | 0 (0.0%) |
| $75,000 to $99,999 | 11 (22.5%) | 4 (26.7%) |
| $100,000 to $149,999 | 5 (10.2%) | 0 (0.0%) |
| $150,000 or more | 1 (2.0%) | 0 (0.0%) |
| Total | 49 (100.0%) | 15 (100.0%) |
Monthly Housing Cost Tiers in Rocky
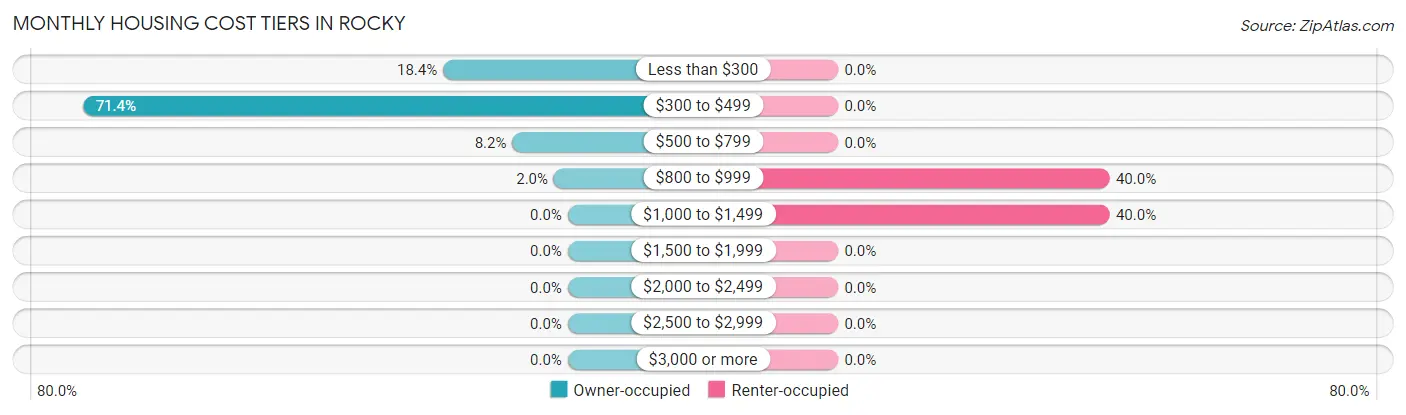
| Monthly Cost | Owner-occupied | Renter-occupied |
| Less than $300 | 9 (18.4%) | 0 (0.0%) |
| $300 to $499 | 35 (71.4%) | 0 (0.0%) |
| $500 to $799 | 4 (8.2%) | 0 (0.0%) |
| $800 to $999 | 1 (2.0%) | 6 (40.0%) |
| $1,000 to $1,499 | 0 (0.0%) | 6 (40.0%) |
| $1,500 to $1,999 | 0 (0.0%) | 0 (0.0%) |
| $2,000 to $2,499 | 0 (0.0%) | 0 (0.0%) |
| $2,500 to $2,999 | 0 (0.0%) | 0 (0.0%) |
| $3,000 or more | 0 (0.0%) | 0 (0.0%) |
| Total | 49 (100.0%) | 15 (100.0%) |
Physical Housing Characteristics in Rocky
Housing Structures in Rocky
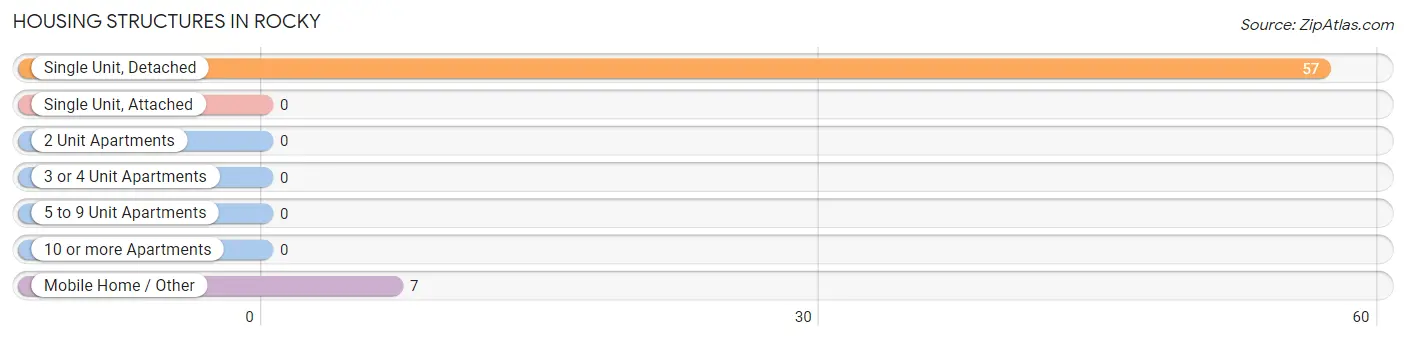
| Structure Type | # Housing Units | % Housing Units |
| Single Unit, Detached | 57 | 89.1% |
| Single Unit, Attached | 0 | 0.0% |
| 2 Unit Apartments | 0 | 0.0% |
| 3 or 4 Unit Apartments | 0 | 0.0% |
| 5 to 9 Unit Apartments | 0 | 0.0% |
| 10 or more Apartments | 0 | 0.0% |
| Mobile Home / Other | 7 | 10.9% |
| Total | 64 | 100.0% |
Housing Structures by Occupancy in Rocky
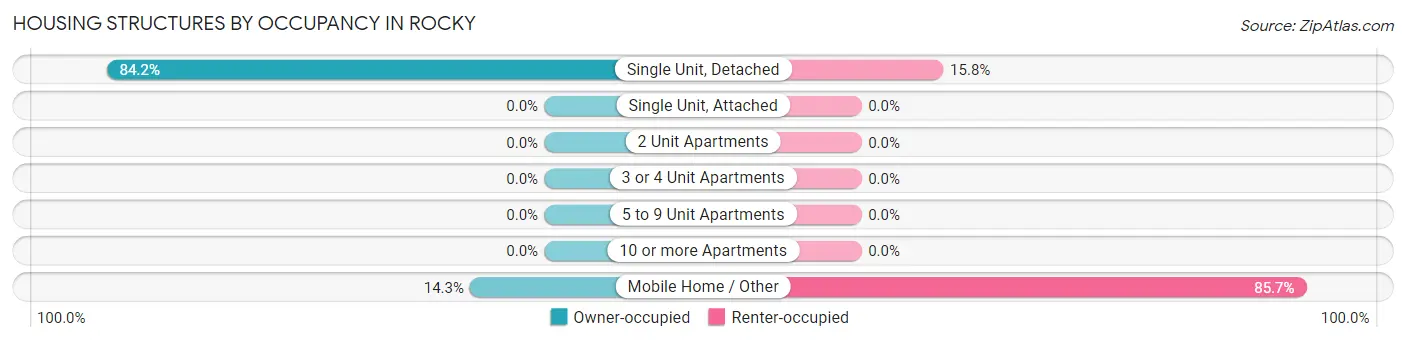
| Structure Type | Owner-occupied | Renter-occupied |
| Single Unit, Detached | 48 (84.2%) | 9 (15.8%) |
| Single Unit, Attached | 0 (0.0%) | 0 (0.0%) |
| 2 Unit Apartments | 0 (0.0%) | 0 (0.0%) |
| 3 or 4 Unit Apartments | 0 (0.0%) | 0 (0.0%) |
| 5 to 9 Unit Apartments | 0 (0.0%) | 0 (0.0%) |
| 10 or more Apartments | 0 (0.0%) | 0 (0.0%) |
| Mobile Home / Other | 1 (14.3%) | 6 (85.7%) |
| Total | 49 (76.6%) | 15 (23.4%) |
Housing Structures by Number of Rooms in Rocky
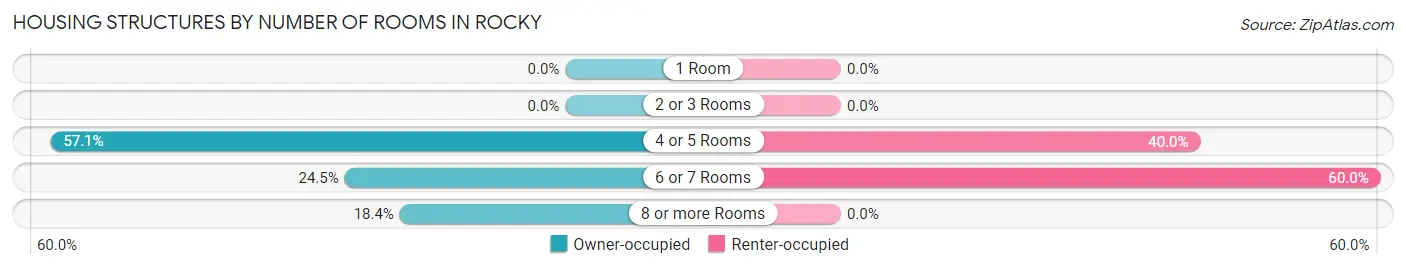
| Number of Rooms | Owner-occupied | Renter-occupied |
| 1 Room | 0 (0.0%) | 0 (0.0%) |
| 2 or 3 Rooms | 0 (0.0%) | 0 (0.0%) |
| 4 or 5 Rooms | 28 (57.1%) | 6 (40.0%) |
| 6 or 7 Rooms | 12 (24.5%) | 9 (60.0%) |
| 8 or more Rooms | 9 (18.4%) | 0 (0.0%) |
| Total | 49 (100.0%) | 15 (100.0%) |
Housing Structure by Heating Type in Rocky
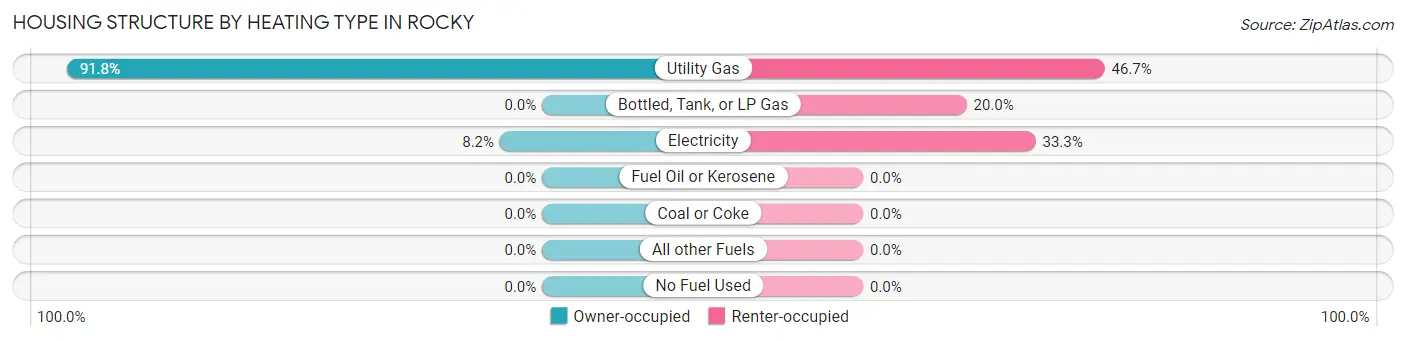
| Heating Type | Owner-occupied | Renter-occupied |
| Utility Gas | 45 (91.8%) | 7 (46.7%) |
| Bottled, Tank, or LP Gas | 0 (0.0%) | 3 (20.0%) |
| Electricity | 4 (8.2%) | 5 (33.3%) |
| Fuel Oil or Kerosene | 0 (0.0%) | 0 (0.0%) |
| Coal or Coke | 0 (0.0%) | 0 (0.0%) |
| All other Fuels | 0 (0.0%) | 0 (0.0%) |
| No Fuel Used | 0 (0.0%) | 0 (0.0%) |
| Total | 49 (100.0%) | 15 (100.0%) |
Household Vehicle Usage in Rocky
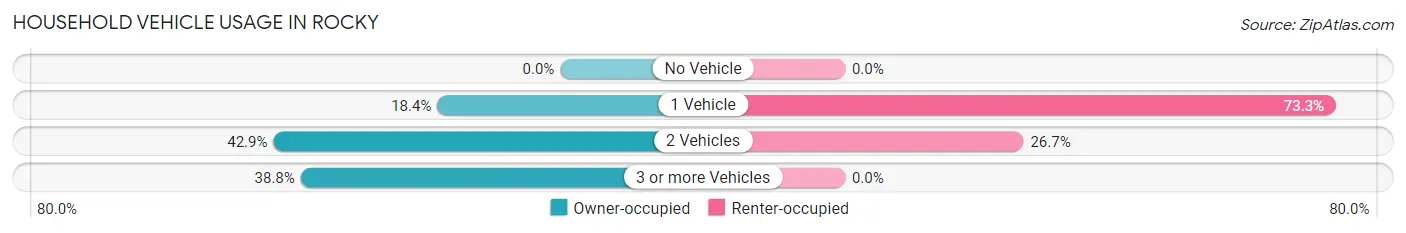
| Vehicles per Household | Owner-occupied | Renter-occupied |
| No Vehicle | 0 (0.0%) | 0 (0.0%) |
| 1 Vehicle | 9 (18.4%) | 11 (73.3%) |
| 2 Vehicles | 21 (42.9%) | 4 (26.7%) |
| 3 or more Vehicles | 19 (38.8%) | 0 (0.0%) |
| Total | 49 (100.0%) | 15 (100.0%) |
Real Estate & Mortgages in Rocky
Real Estate and Mortgage Overview in Rocky
| Characteristic | Without Mortgage | With Mortgage |
| Housing Units | 44 | 5 |
| Median Property Value | $51,700 | $0 |
| Median Household Income | $53,750 | $0 |
| Monthly Housing Costs | $341 | $0 |
| Real Estate Taxes | $199 | $0 |
Property Value by Mortgage Status in Rocky
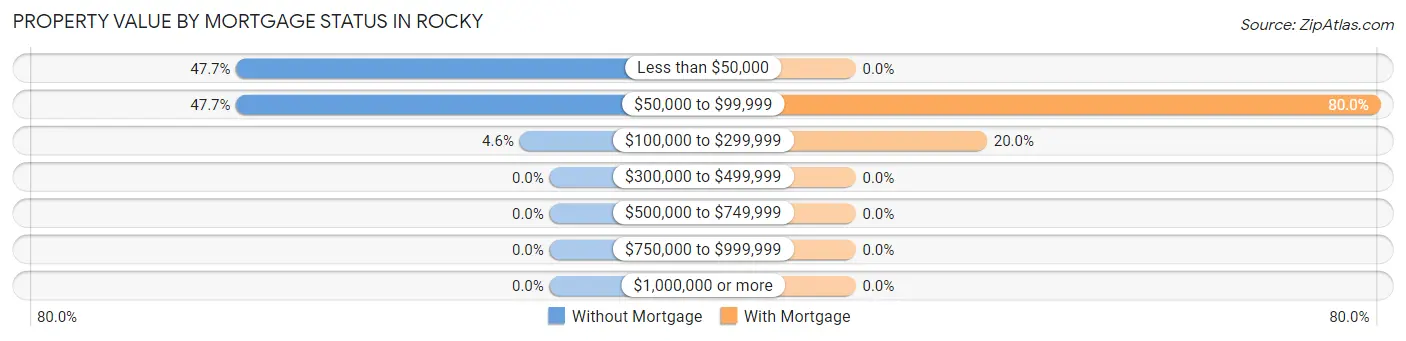
| Property Value | Without Mortgage | With Mortgage |
| Less than $50,000 | 21 (47.7%) | 0 (0.0%) |
| $50,000 to $99,999 | 21 (47.7%) | 4 (80.0%) |
| $100,000 to $299,999 | 2 (4.5%) | 1 (20.0%) |
| $300,000 to $499,999 | 0 (0.0%) | 0 (0.0%) |
| $500,000 to $749,999 | 0 (0.0%) | 0 (0.0%) |
| $750,000 to $999,999 | 0 (0.0%) | 0 (0.0%) |
| $1,000,000 or more | 0 (0.0%) | 0 (0.0%) |
| Total | 44 (100.0%) | 5 (100.0%) |
Household Income by Mortgage Status in Rocky
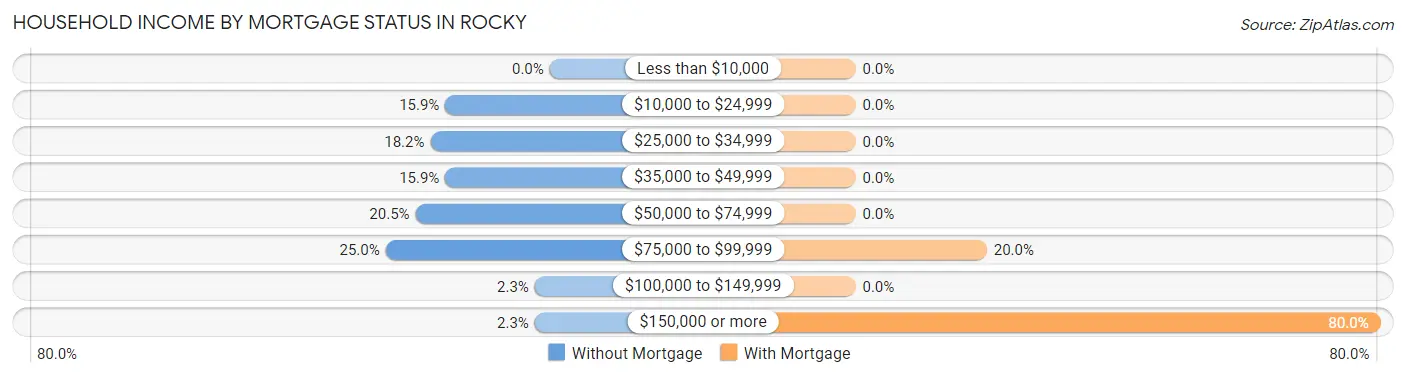
| Household Income | Without Mortgage | With Mortgage |
| Less than $10,000 | 0 (0.0%) | 0 (0.0%) |
| $10,000 to $24,999 | 7 (15.9%) | 0 (0.0%) |
| $25,000 to $34,999 | 8 (18.2%) | 0 (0.0%) |
| $35,000 to $49,999 | 7 (15.9%) | 0 (0.0%) |
| $50,000 to $74,999 | 9 (20.4%) | 0 (0.0%) |
| $75,000 to $99,999 | 11 (25.0%) | 1 (20.0%) |
| $100,000 to $149,999 | 1 (2.3%) | 0 (0.0%) |
| $150,000 or more | 1 (2.3%) | 4 (80.0%) |
| Total | 44 (100.0%) | 5 (100.0%) |
Property Value to Household Income Ratio in Rocky
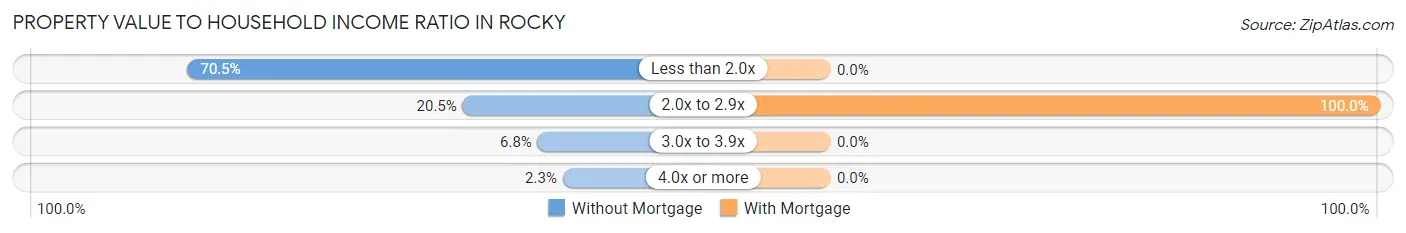
| Value-to-Income Ratio | Without Mortgage | With Mortgage |
| Less than 2.0x | 31 (70.5%) | 0 (0.0%) |
| 2.0x to 2.9x | 9 (20.4%) | 5 (100.0%) |
| 3.0x to 3.9x | 3 (6.8%) | 0 (0.0%) |
| 4.0x or more | 1 (2.3%) | 0 (0.0%) |
| Total | 44 (100.0%) | 5 (100.0%) |
Real Estate Taxes by Mortgage Status in Rocky
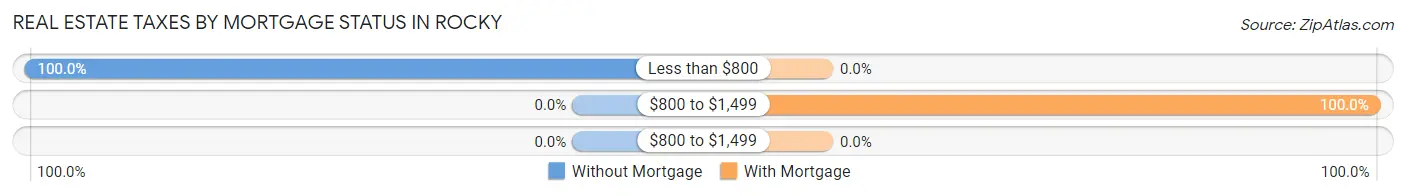
| Property Taxes | Without Mortgage | With Mortgage |
| Less than $800 | 44 (100.0%) | 0 (0.0%) |
| $800 to $1,499 | 0 (0.0%) | 5 (100.0%) |
| $800 to $1,499 | 0 (0.0%) | 0 (0.0%) |
| Total | 44 (100.0%) | 5 (100.0%) |
Health & Disability in Rocky
Health Insurance Coverage by Age in Rocky
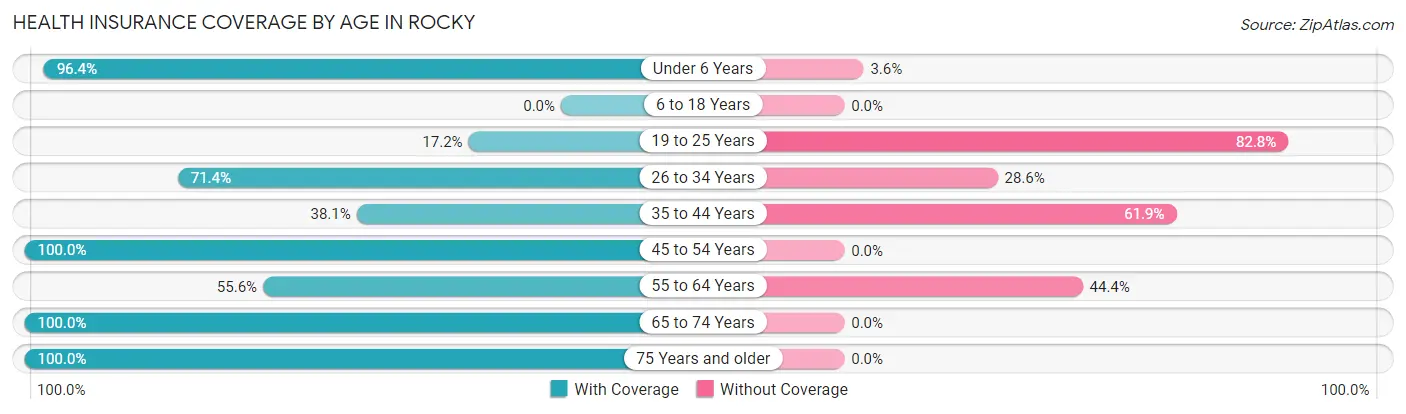
| Age Bracket | With Coverage | Without Coverage |
| Under 6 Years | 27 (96.4%) | 1 (3.6%) |
| 6 to 18 Years | 0 (0.0%) | 0 (0.0%) |
| 19 to 25 Years | 5 (17.2%) | 24 (82.8%) |
| 26 to 34 Years | 25 (71.4%) | 10 (28.6%) |
| 35 to 44 Years | 8 (38.1%) | 13 (61.9%) |
| 45 to 54 Years | 12 (100.0%) | 0 (0.0%) |
| 55 to 64 Years | 15 (55.6%) | 12 (44.4%) |
| 65 to 74 Years | 110 (100.0%) | 0 (0.0%) |
| 75 Years and older | 4 (100.0%) | 0 (0.0%) |
| Total | 206 (77.4%) | 60 (22.6%) |
Health Insurance Coverage by Citizenship Status in Rocky
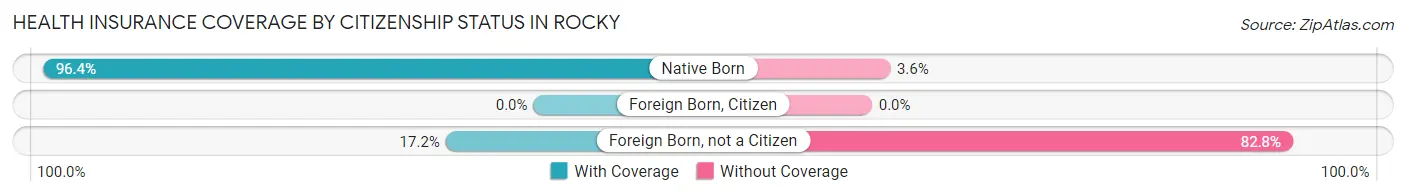
| Citizenship Status | With Coverage | Without Coverage |
| Native Born | 27 (96.4%) | 1 (3.6%) |
| Foreign Born, Citizen | 0 (0.0%) | 0 (0.0%) |
| Foreign Born, not a Citizen | 5 (17.2%) | 24 (82.8%) |
Health Insurance Coverage by Household Income in Rocky
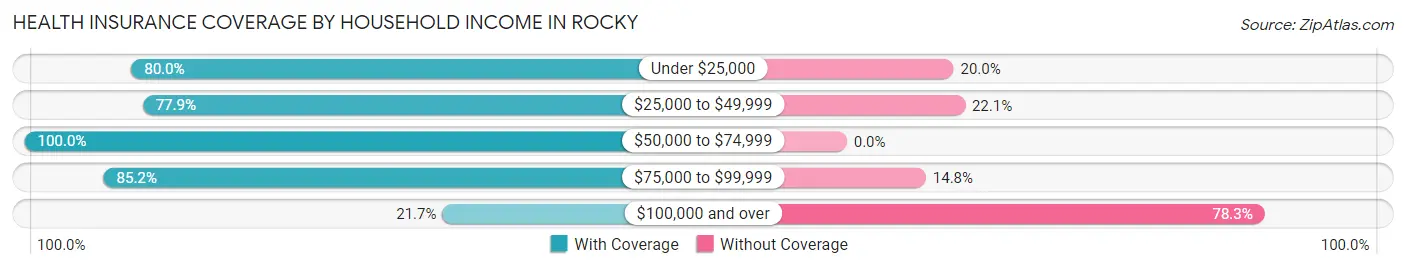
| Household Income | With Coverage | Without Coverage |
| Under $25,000 | 12 (80.0%) | 3 (20.0%) |
| $25,000 to $49,999 | 109 (77.9%) | 31 (22.1%) |
| $50,000 to $74,999 | 34 (100.0%) | 0 (0.0%) |
| $75,000 to $99,999 | 46 (85.2%) | 8 (14.8%) |
| $100,000 and over | 5 (21.7%) | 18 (78.3%) |
Public vs Private Health Insurance Coverage by Age in Rocky
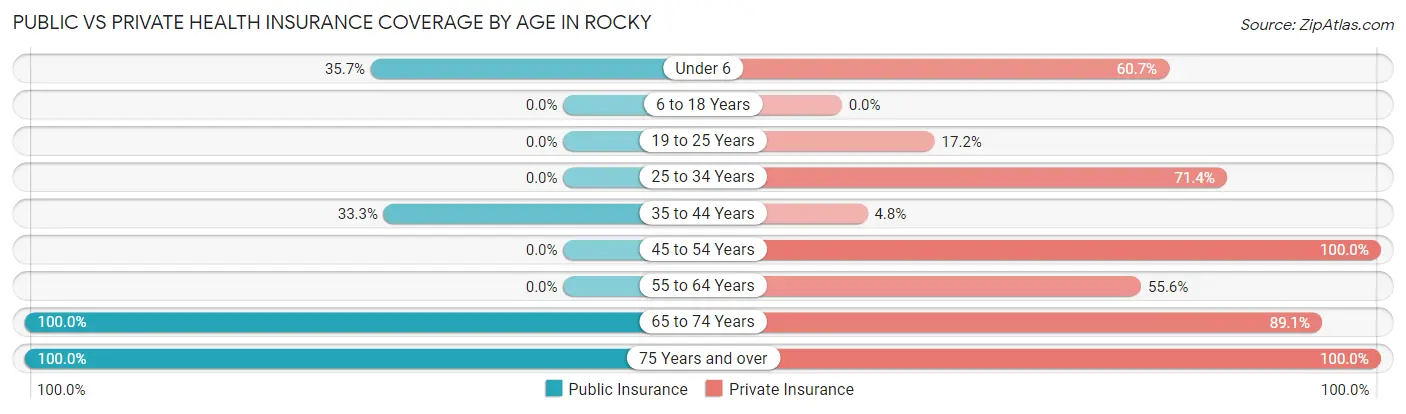
| Age Bracket | Public Insurance | Private Insurance |
| Under 6 | 10 (35.7%) | 17 (60.7%) |
| 6 to 18 Years | 0 (0.0%) | 0 (0.0%) |
| 19 to 25 Years | 0 (0.0%) | 5 (17.2%) |
| 25 to 34 Years | 0 (0.0%) | 25 (71.4%) |
| 35 to 44 Years | 7 (33.3%) | 1 (4.8%) |
| 45 to 54 Years | 0 (0.0%) | 12 (100.0%) |
| 55 to 64 Years | 0 (0.0%) | 15 (55.6%) |
| 65 to 74 Years | 110 (100.0%) | 98 (89.1%) |
| 75 Years and over | 4 (100.0%) | 4 (100.0%) |
| Total | 131 (49.2%) | 177 (66.5%) |
Disability Status by Sex by Age in Rocky
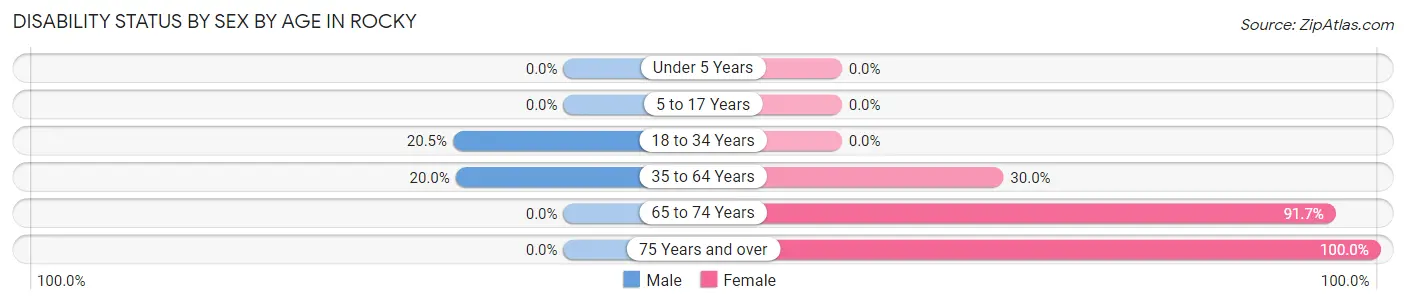
| Age Bracket | Male | Female |
| Under 5 Years | 0 (0.0%) | 0 (0.0%) |
| 5 to 17 Years | 0 (0.0%) | 0 (0.0%) |
| 18 to 34 Years | 8 (20.5%) | 0 (0.0%) |
| 35 to 64 Years | 8 (20.0%) | 6 (30.0%) |
| 65 to 74 Years | 0 (0.0%) | 88 (91.7%) |
| 75 Years and over | 0 (0.0%) | 3 (100.0%) |
Disability Class by Sex by Age in Rocky
Disability Class: Hearing Difficulty
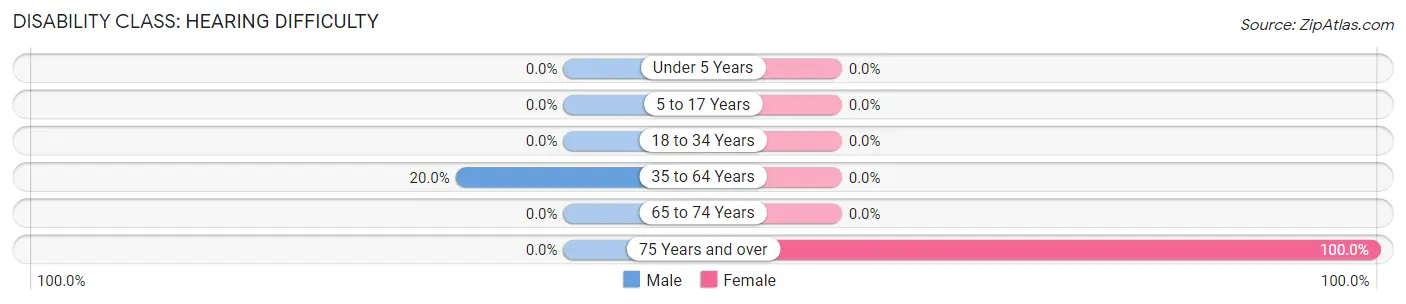
| Age Bracket | Male | Female |
| Under 5 Years | 0 (0.0%) | 0 (0.0%) |
| 5 to 17 Years | 0 (0.0%) | 0 (0.0%) |
| 18 to 34 Years | 0 (0.0%) | 0 (0.0%) |
| 35 to 64 Years | 8 (20.0%) | 0 (0.0%) |
| 65 to 74 Years | 0 (0.0%) | 0 (0.0%) |
| 75 Years and over | 0 (0.0%) | 3 (100.0%) |
Disability Class: Vision Difficulty
| Age Bracket | Male | Female |
| Under 5 Years | 0 (0.0%) | 0 (0.0%) |
| 5 to 17 Years | 0 (0.0%) | 0 (0.0%) |
| 18 to 34 Years | 0 (0.0%) | 0 (0.0%) |
| 35 to 64 Years | 0 (0.0%) | 0 (0.0%) |
| 65 to 74 Years | 0 (0.0%) | 0 (0.0%) |
| 75 Years and over | 0 (0.0%) | 0 (0.0%) |
Disability Class: Cognitive Difficulty
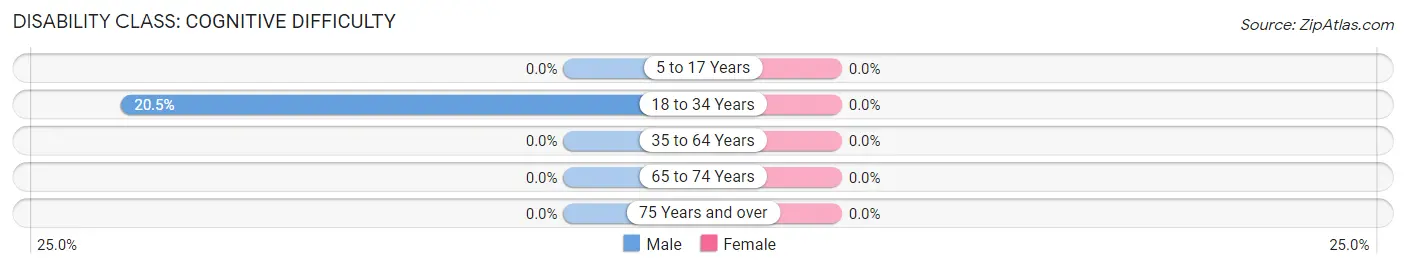
| Age Bracket | Male | Female |
| 5 to 17 Years | 0 (0.0%) | 0 (0.0%) |
| 18 to 34 Years | 8 (20.5%) | 0 (0.0%) |
| 35 to 64 Years | 0 (0.0%) | 0 (0.0%) |
| 65 to 74 Years | 0 (0.0%) | 0 (0.0%) |
| 75 Years and over | 0 (0.0%) | 0 (0.0%) |
Disability Class: Ambulatory Difficulty
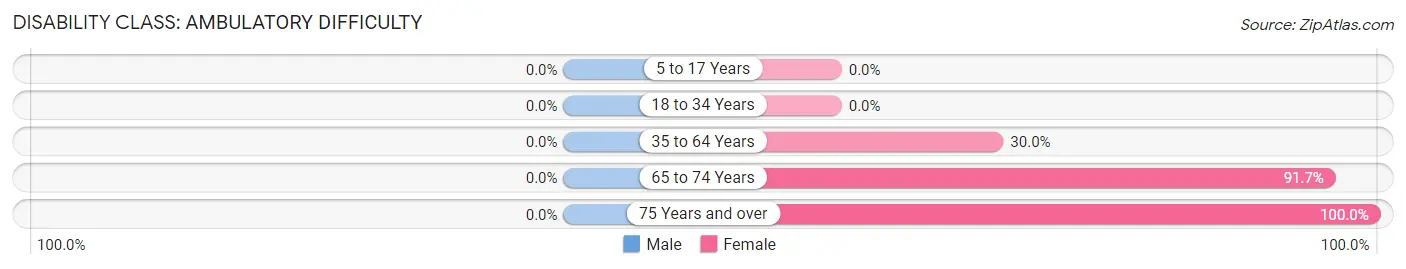
| Age Bracket | Male | Female |
| 5 to 17 Years | 0 (0.0%) | 0 (0.0%) |
| 18 to 34 Years | 0 (0.0%) | 0 (0.0%) |
| 35 to 64 Years | 0 (0.0%) | 6 (30.0%) |
| 65 to 74 Years | 0 (0.0%) | 88 (91.7%) |
| 75 Years and over | 0 (0.0%) | 3 (100.0%) |
Disability Class: Self-Care Difficulty
| Age Bracket | Male | Female |
| 5 to 17 Years | 0 (0.0%) | 0 (0.0%) |
| 18 to 34 Years | 0 (0.0%) | 0 (0.0%) |
| 35 to 64 Years | 0 (0.0%) | 0 (0.0%) |
| 65 to 74 Years | 0 (0.0%) | 0 (0.0%) |
| 75 Years and over | 0 (0.0%) | 0 (0.0%) |
Technology Access in Rocky
Computing Device Access in Rocky
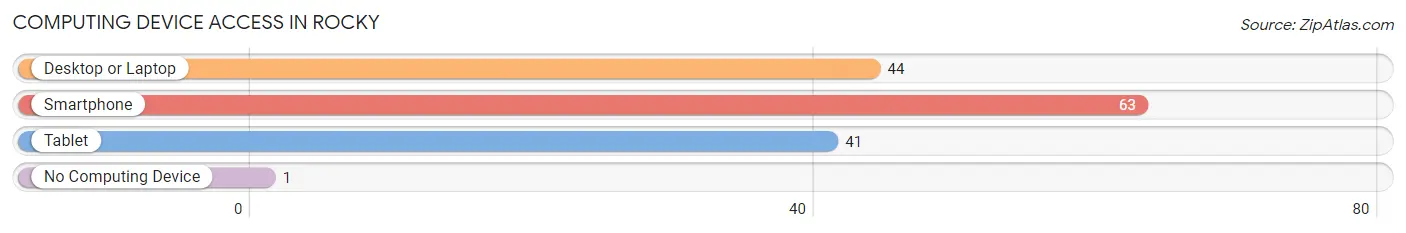
| Device Type | # Households | % Households |
| Desktop or Laptop | 44 | 68.8% |
| Smartphone | 63 | 98.4% |
| Tablet | 41 | 64.1% |
| No Computing Device | 1 | 1.6% |
| Total | 64 | 100.0% |
Internet Access in Rocky
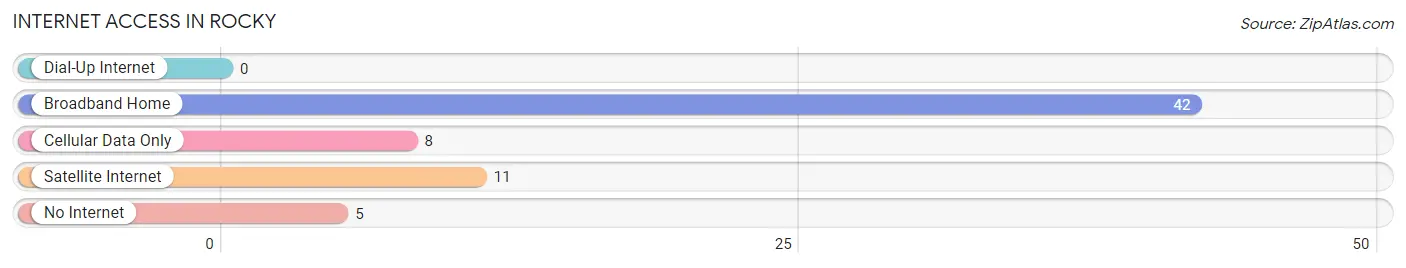
| Internet Type | # Households | % Households |
| Dial-Up Internet | 0 | 0.0% |
| Broadband Home | 42 | 65.6% |
| Cellular Data Only | 8 | 12.5% |
| Satellite Internet | 11 | 17.2% |
| No Internet | 5 | 7.8% |
| Total | 64 | 100.0% |
Rocky Summary
Rocky, Oklahoma is a small town located in the southeastern corner of the state, in the foothills of the Ouachita Mountains. It is situated in LeFlore County, and is part of the Fort Smith, Arkansas-Oklahoma Metropolitan Statistical Area. The town was founded in 1894 and has a population of approximately 1,000 people.
Geography
Rocky is located in the southeastern corner of Oklahoma, in the foothills of the Ouachita Mountains. It is situated in LeFlore County, and is part of the Fort Smith, Arkansas-Oklahoma Metropolitan Statistical Area. The town is located at the intersection of U.S. Highway 59 and State Highway 82. The town is situated on a plateau, with elevations ranging from 1,000 to 1,500 feet above sea level. The town is surrounded by rolling hills and wooded areas, and is located near the Poteau River.
History
Rocky was founded in 1894 by a group of settlers from Arkansas. The town was named after a nearby rocky hill, and was originally known as Rocky Hill. The town was incorporated in 1901, and the first post office was established in 1902. The town grew slowly, and by the 1930s had a population of around 500 people.
Economy
The economy of Rocky is largely based on agriculture and timber. The town is home to several small businesses, including a grocery store, a hardware store, and a lumber yard. The town also has a small manufacturing sector, with several small factories producing furniture, clothing, and other goods.
Demographics
As of the 2010 census, the population of Rocky was 1,000 people. The racial makeup of the town was 95.2% White, 0.7% African American, 0.7% Native American, 0.3% Asian, 0.1% Pacific Islander, and 2.9% from two or more races. The median household income was $30,000, and the median family income was $35,000. The per capita income was $14,000.
Conclusion
Rocky, Oklahoma is a small town located in the southeastern corner of the state, in the foothills of the Ouachita Mountains. It is situated in LeFlore County, and is part of the Fort Smith, Arkansas-Oklahoma Metropolitan Statistical Area. The town was founded in 1894 and has a population of approximately 1,000 people. The economy of Rocky is largely based on agriculture and timber, and the town is home to several small businesses. The racial makeup of the town is predominantly White, with a small percentage of African American, Native American, Asian, and Pacific Islander residents. The median household income is $30,000, and the median family income is $35,000.
Common Questions
What is Per Capita Income in Rocky?
Per Capita income in Rocky is $25,605.
What is the Median Family Income in Rocky?
Median Family Income in Rocky is $57,857.
What is the Median Household income in Rocky?
Median Household Income in Rocky is $45,000.
What is Income or Wage Gap in Rocky?
Income or Wage Gap in Rocky is 65.4%.
Women in Rocky earn 34.6 cents for every dollar earned by a man.
What is Inequality or Gini Index in Rocky?
Inequality or Gini Index in Rocky is 0.31.
What is the Total Population of Rocky?
Total Population of Rocky is 266.
What is the Total Male Population of Rocky?
Total Male Population of Rocky is 122.
What is the Total Female Population of Rocky?
Total Female Population of Rocky is 144.
What is the Ratio of Males per 100 Females in Rocky?
There are 84.72 Males per 100 Females in Rocky.
What is the Ratio of Females per 100 Males in Rocky?
There are 118.03 Females per 100 Males in Rocky.
What is the Median Population Age in Rocky?
Median Population Age in Rocky is 56.9 Years.
What is the Average Family Size in Rocky
Average Family Size in Rocky is 4.9 People.
What is the Average Household Size in Rocky
Average Household Size in Rocky is 4.2 People.
How Large is the Labor Force in Rocky?
There are 105 People in the Labor Forcein in Rocky.
What is the Percentage of People in the Labor Force in Rocky?
44.1% of People are in the Labor Force in Rocky.
What is the Unemployment Rate in Rocky?
Unemployment Rate in Rocky is 16.2%.