Pump Back, OK Map & Demographics
Pump Back Map
Pump Back Overview
$54,757
PER CAPITA INCOME
$113,250
AVG FAMILY INCOME
$105,278
AVG HOUSEHOLD INCOME
0.21
INEQUALITY / GINI INDEX
138
TOTAL POPULATION
88
MALE POPULATION
50
FEMALE POPULATION
176.00
MALES / 100 FEMALES
56.82
FEMALES / 100 MALES
61.4
MEDIAN AGE
2.2
AVG FAMILY SIZE
2.0
AVG HOUSEHOLD SIZE
86
LABOR FORCE [ PEOPLE ]
62.3%
PERCENT IN LABOR FORCE
Income in Pump Back
Income Overview in Pump Back
Per Capita Income in Pump Back is $54,757, while median incomes of families and households are $113,250 and $105,278 respectively.
| Characteristic | Number | Measure |
| Per Capita Income | 138 | $54,757 |
| Median Family Income | 48 | $113,250 |
| Mean Family Income | 48 | $112,196 |
| Median Household Income | 70 | $105,278 |
| Mean Household Income | 70 | $107,136 |
| Income Deficit | 48 | $0 |
| Wage / Income Gap (%) | 138 | 0.00% |
| Wage / Income Gap ($) | 138 | 100.00¢ per $1 |
| Gini / Inequality Index | 138 | 0.21 |
Earnings by Sex in Pump Back
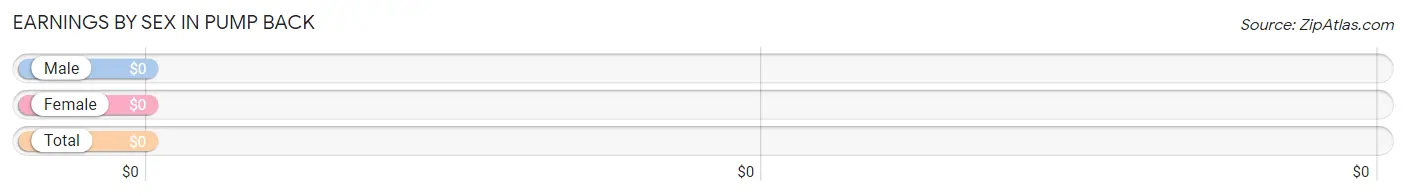
| Sex | Number | Average Earnings |
| Male | 66 (66.7%) | $0 |
| Female | 33 (33.3%) | $0 |
| Total | 99 (100.0%) | $0 |
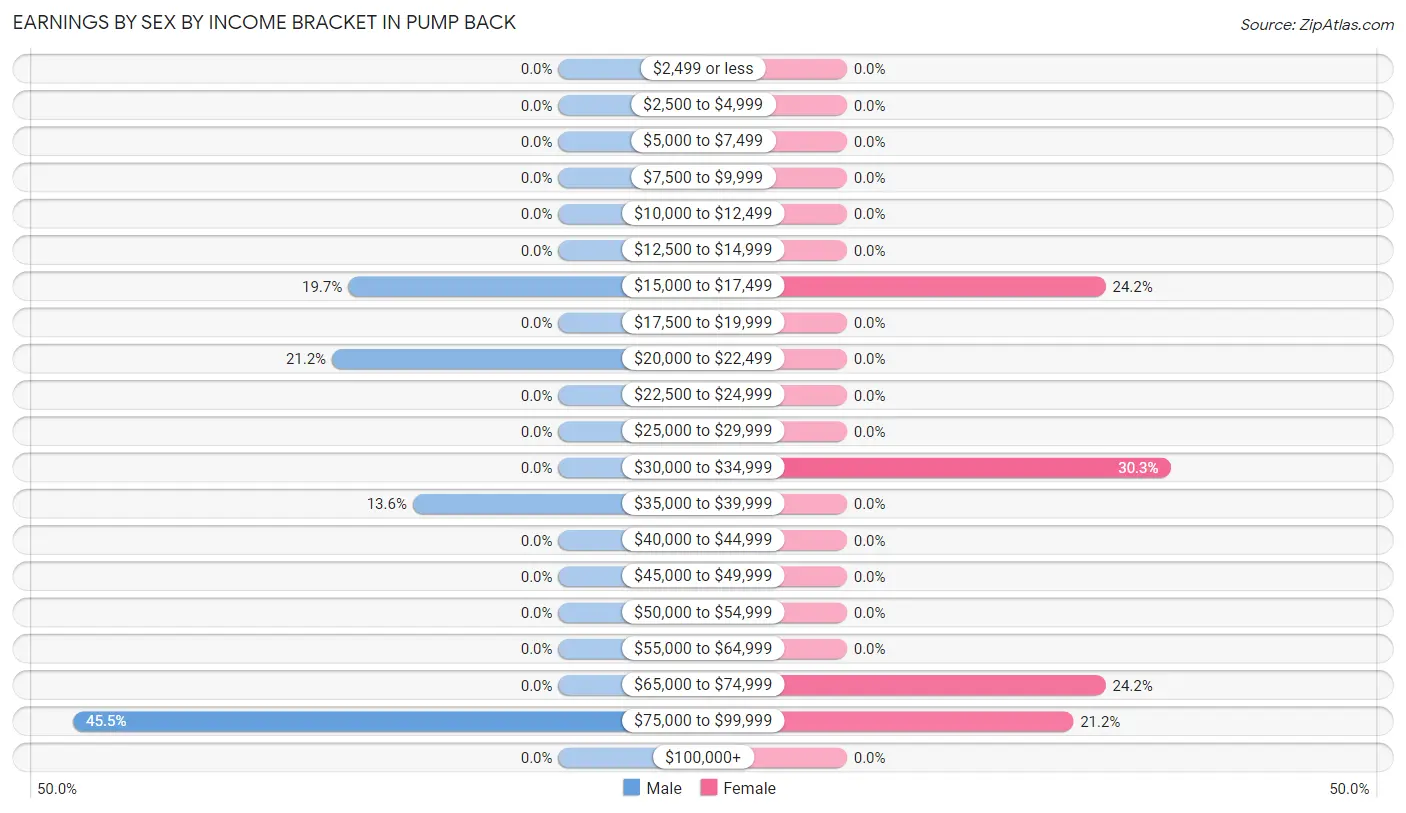
Earnings by Sex by Income Bracket in Pump Back
The most common earnings brackets in Pump Back are $75,000 to $99,999 for men (30 | 45.5%) and $30,000 to $34,999 for women (10 | 30.3%).
| Income | Male | Female |
| $2,499 or less | 0 (0.0%) | 0 (0.0%) |
| $2,500 to $4,999 | 0 (0.0%) | 0 (0.0%) |
| $5,000 to $7,499 | 0 (0.0%) | 0 (0.0%) |
| $7,500 to $9,999 | 0 (0.0%) | 0 (0.0%) |
| $10,000 to $12,499 | 0 (0.0%) | 0 (0.0%) |
| $12,500 to $14,999 | 0 (0.0%) | 0 (0.0%) |
| $15,000 to $17,499 | 13 (19.7%) | 8 (24.2%) |
| $17,500 to $19,999 | 0 (0.0%) | 0 (0.0%) |
| $20,000 to $22,499 | 14 (21.2%) | 0 (0.0%) |
| $22,500 to $24,999 | 0 (0.0%) | 0 (0.0%) |
| $25,000 to $29,999 | 0 (0.0%) | 0 (0.0%) |
| $30,000 to $34,999 | 0 (0.0%) | 10 (30.3%) |
| $35,000 to $39,999 | 9 (13.6%) | 0 (0.0%) |
| $40,000 to $44,999 | 0 (0.0%) | 0 (0.0%) |
| $45,000 to $49,999 | 0 (0.0%) | 0 (0.0%) |
| $50,000 to $54,999 | 0 (0.0%) | 0 (0.0%) |
| $55,000 to $64,999 | 0 (0.0%) | 0 (0.0%) |
| $65,000 to $74,999 | 0 (0.0%) | 8 (24.2%) |
| $75,000 to $99,999 | 30 (45.5%) | 7 (21.2%) |
| $100,000+ | 0 (0.0%) | 0 (0.0%) |
| Total | 66 (100.0%) | 33 (100.0%) |
Earnings by Sex by Educational Attainment in Pump Back
| Educational Attainment | Male Income | Female Income |
| Less than High School | - | - |
| High School Diploma | - | - |
| College or Associate's Degree | - | - |
| Bachelor's Degree | - | - |
| Graduate Degree | - | - |
| Total | - | - |
Family Income in Pump Back
Family Income Brackets in Pump Back
According to the Pump Back family income data, there are 19 families falling into the $100,000 to $149,999 income range, which is the most common income bracket and makes up 39.6% of all families.
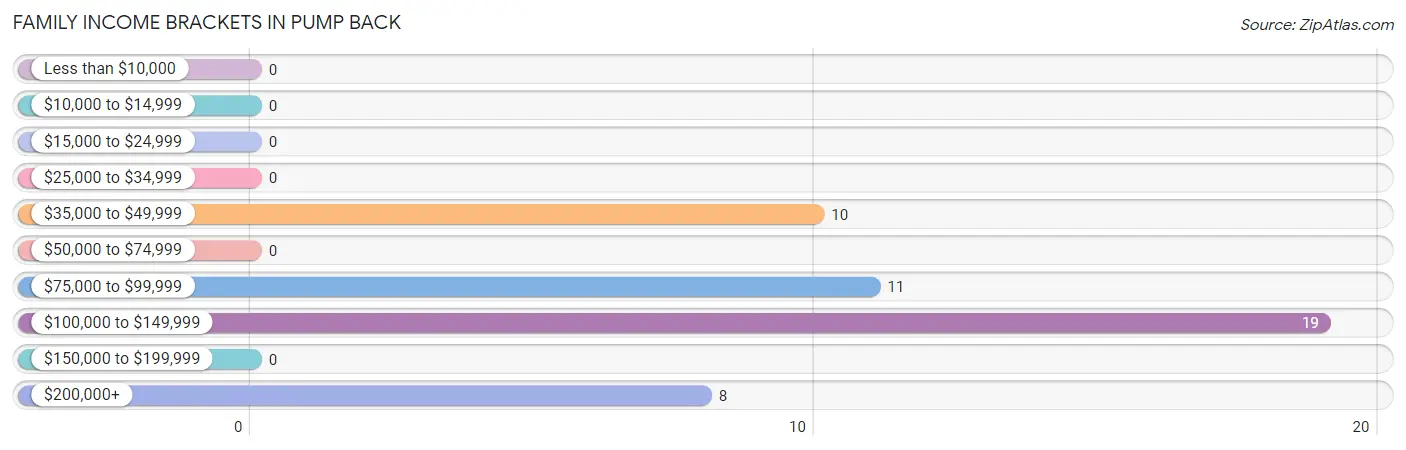
| Income Bracket | # Families | % Families |
| Less than $10,000 | 0 | 0.0% |
| $10,000 to $14,999 | 0 | 0.0% |
| $15,000 to $24,999 | 0 | 0.0% |
| $25,000 to $34,999 | 0 | 0.0% |
| $35,000 to $49,999 | 10 | 20.8% |
| $50,000 to $74,999 | 0 | 0.0% |
| $75,000 to $99,999 | 11 | 22.9% |
| $100,000 to $149,999 | 19 | 39.6% |
| $150,000 to $199,999 | 0 | 0.0% |
| $200,000+ | 8 | 16.7% |
Family Income by Famaliy Size in Pump Back
2-person families (39 | 81.2%) account for the highest median family income in Pump Back with $87,159 per family, while 2-person families (39 | 81.2%) have the highest median income of $43,580 per family member.
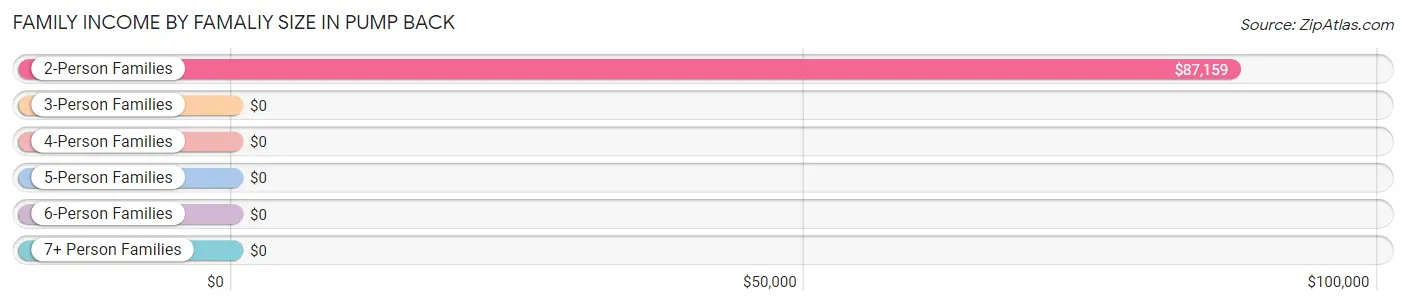
| Income Bracket | # Families | Median Income |
| 2-Person Families | 39 (81.2%) | $87,159 |
| 3-Person Families | 9 (18.8%) | $0 |
| 4-Person Families | 0 (0.0%) | $0 |
| 5-Person Families | 0 (0.0%) | $0 |
| 6-Person Families | 0 (0.0%) | $0 |
| 7+ Person Families | 0 (0.0%) | $0 |
| Total | 48 (100.0%) | $113,250 |
Family Income by Number of Earners in Pump Back
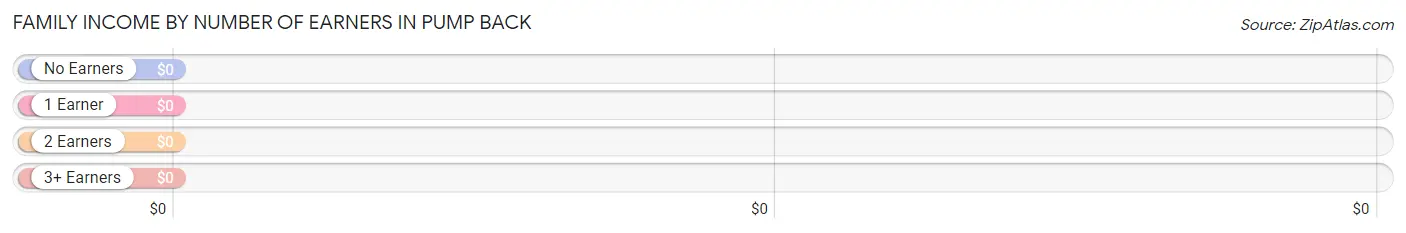
| Number of Earners | # Families | Median Income |
| No Earners | 21 (43.8%) | $0 |
| 1 Earner | 0 (0.0%) | $0 |
| 2 Earners | 18 (37.5%) | $0 |
| 3+ Earners | 9 (18.8%) | $0 |
| Total | 48 (100.0%) | $113,250 |
Household Income in Pump Back
Household Income Brackets in Pump Back
With 28 households falling in the category, the $100,000 to $149,999 income range is the most frequent in Pump Back, accounting for 40.0% of all households.
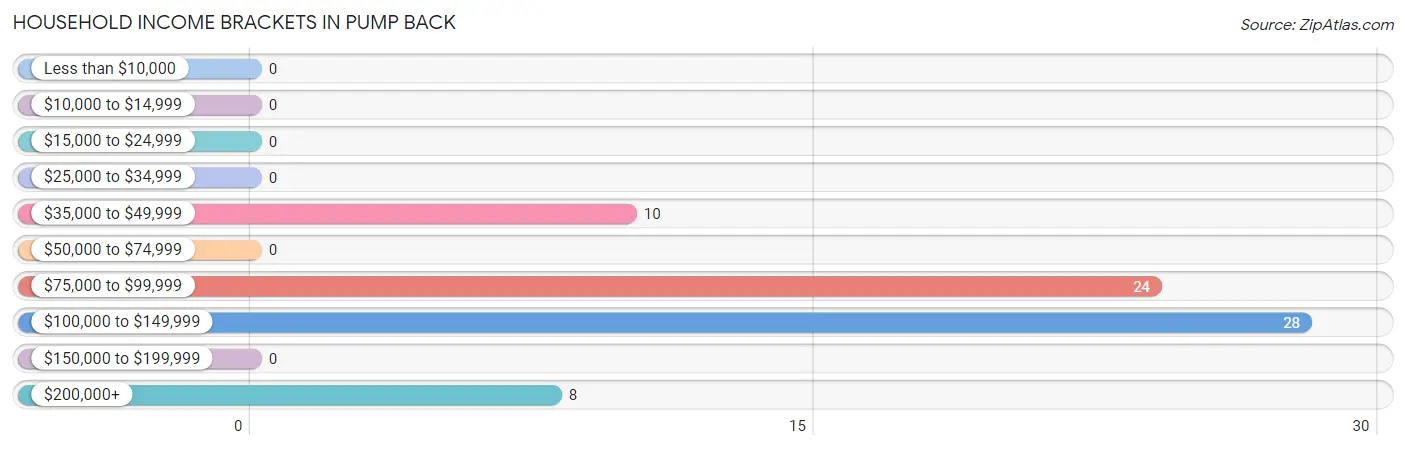
| Income Bracket | # Households | % Households |
| Less than $10,000 | 0 | 0.0% |
| $10,000 to $14,999 | 0 | 0.0% |
| $15,000 to $24,999 | 0 | 0.0% |
| $25,000 to $34,999 | 0 | 0.0% |
| $35,000 to $49,999 | 10 | 14.3% |
| $50,000 to $74,999 | 0 | 0.0% |
| $75,000 to $99,999 | 24 | 34.3% |
| $100,000 to $149,999 | 28 | 40.0% |
| $150,000 to $199,999 | 0 | 0.0% |
| $200,000+ | 8 | 11.4% |
Household Income by Householder Age in Pump Back
The median household income in Pump Back is $105,278, with the highest median household income of $86,250 found in the 65+ years age bracket for the primary householder. A total of 31 households (44.3%) fall into this category.
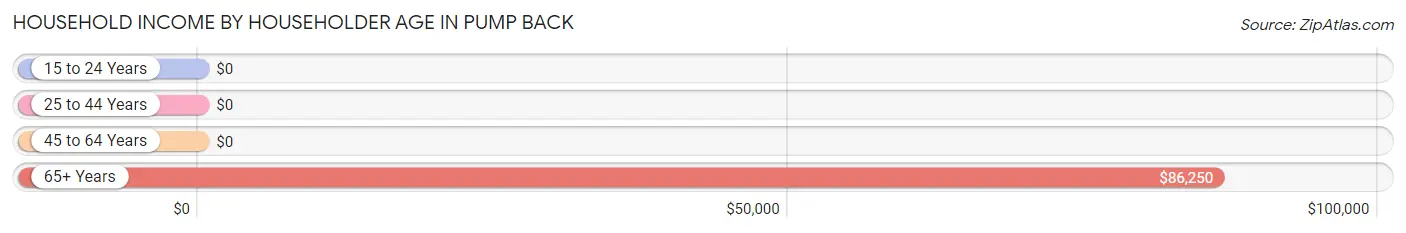
| Income Bracket | # Households | Median Income |
| 15 to 24 Years | 0 (0.0%) | $0 |
| 25 to 44 Years | 22 (31.4%) | $0 |
| 45 to 64 Years | 17 (24.3%) | $0 |
| 65+ Years | 31 (44.3%) | $86,250 |
| Total | 70 (100.0%) | $105,278 |
Poverty in Pump Back
Income Below Poverty by Sex and Age in Pump Back
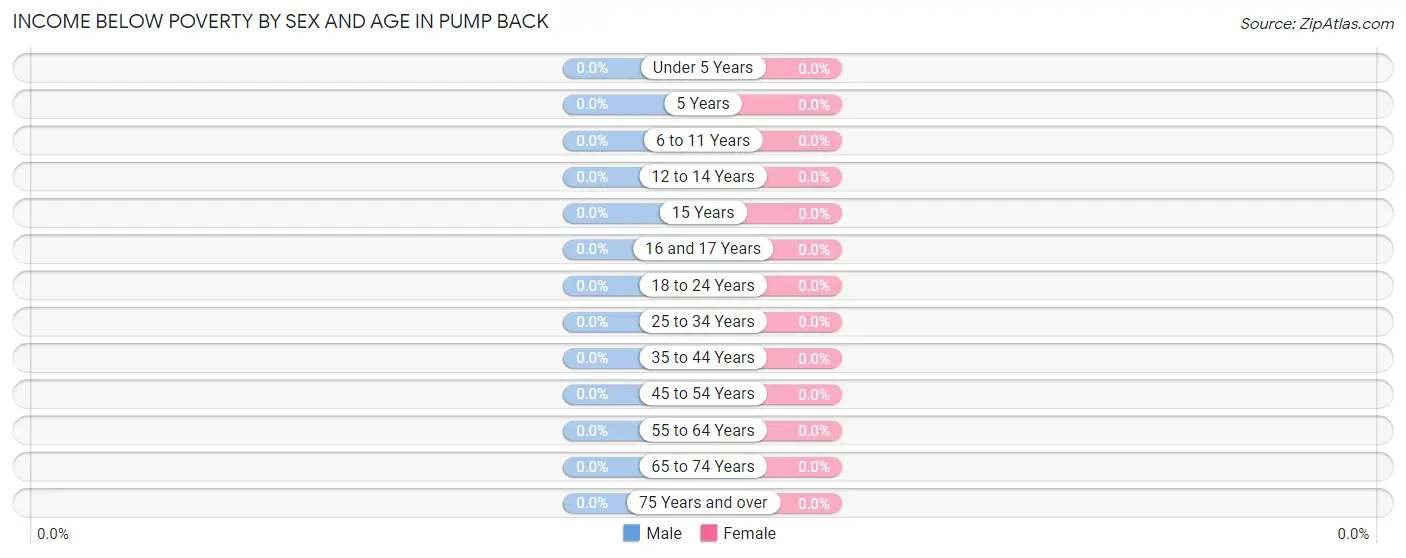
| Age Bracket | Male | Female |
| Under 5 Years | 0 (0.0%) | 0 (0.0%) |
| 5 Years | 0 (0.0%) | 0 (0.0%) |
| 6 to 11 Years | 0 (0.0%) | 0 (0.0%) |
| 12 to 14 Years | 0 (0.0%) | 0 (0.0%) |
| 15 Years | 0 (0.0%) | 0 (0.0%) |
| 16 and 17 Years | 0 (0.0%) | 0 (0.0%) |
| 18 to 24 Years | 0 (0.0%) | 0 (0.0%) |
| 25 to 34 Years | 0 (0.0%) | 0 (0.0%) |
| 35 to 44 Years | 0 (0.0%) | 0 (0.0%) |
| 45 to 54 Years | 0 (0.0%) | 0 (0.0%) |
| 55 to 64 Years | 0 (0.0%) | 0 (0.0%) |
| 65 to 74 Years | 0 (0.0%) | 0 (0.0%) |
| 75 Years and over | 0 (0.0%) | 0 (0.0%) |
| Total | 0 (0.0%) | 0 (0.0%) |
Income Above Poverty by Sex and Age in Pump Back
According to the poverty statistics in Pump Back, males aged 25 to 34 years and females aged 25 to 34 years are the age groups that are most secure financially, with 100.0% of males and 100.0% of females in these age groups living above the poverty line.
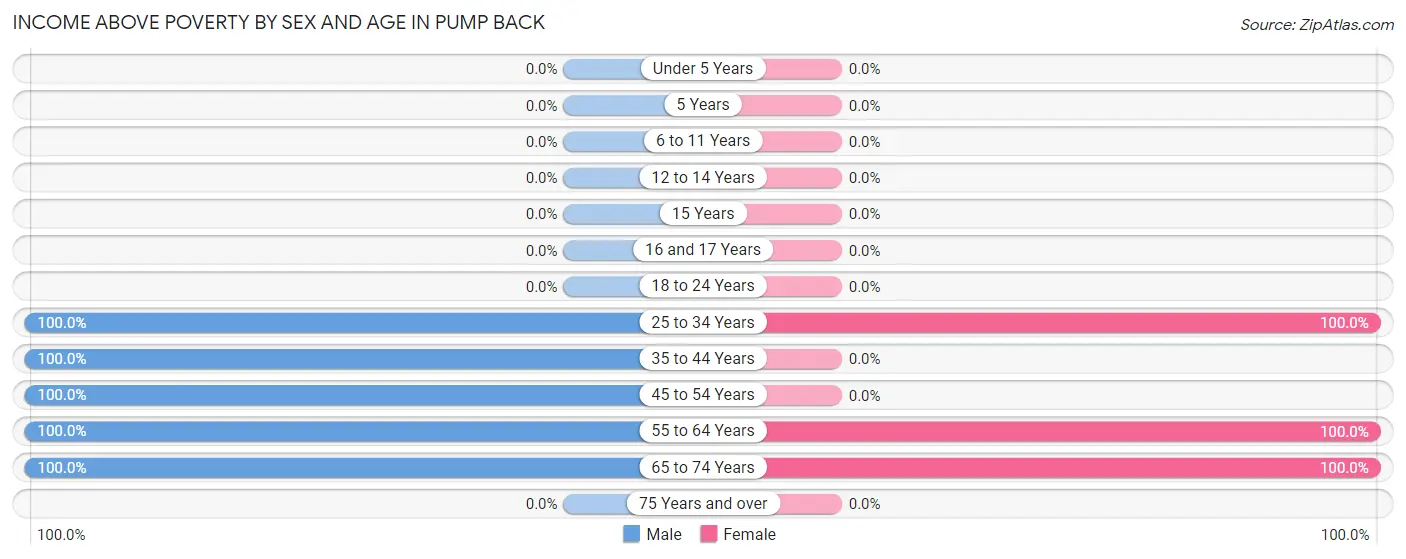
| Age Bracket | Male | Female |
| Under 5 Years | 0 (0.0%) | 0 (0.0%) |
| 5 Years | 0 (0.0%) | 0 (0.0%) |
| 6 to 11 Years | 0 (0.0%) | 0 (0.0%) |
| 12 to 14 Years | 0 (0.0%) | 0 (0.0%) |
| 15 Years | 0 (0.0%) | 0 (0.0%) |
| 16 and 17 Years | 0 (0.0%) | 0 (0.0%) |
| 18 to 24 Years | 0 (0.0%) | 0 (0.0%) |
| 25 to 34 Years | 23 (100.0%) | 8 (100.0%) |
| 35 to 44 Years | 13 (100.0%) | 0 (0.0%) |
| 45 to 54 Years | 11 (100.0%) | 0 (0.0%) |
| 55 to 64 Years | 17 (100.0%) | 22 (100.0%) |
| 65 to 74 Years | 24 (100.0%) | 20 (100.0%) |
| 75 Years and over | 0 (0.0%) | 0 (0.0%) |
| Total | 88 (100.0%) | 50 (100.0%) |
Income Below Poverty Among Married-Couple Families in Pump Back
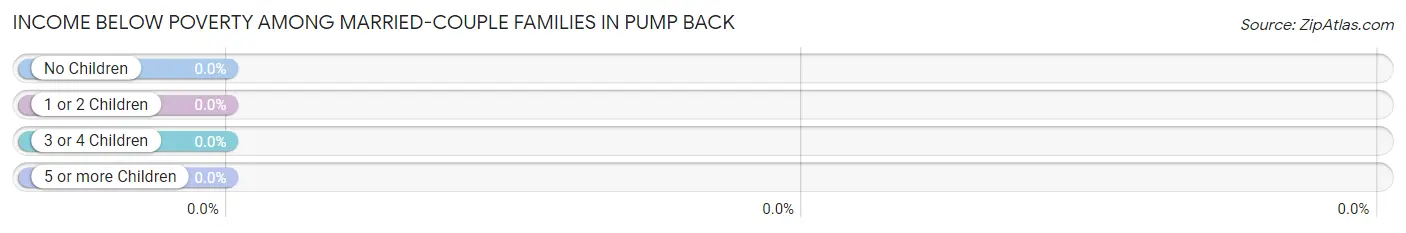
| Children | Above Poverty | Below Poverty |
| No Children | 38 (100.0%) | 0 (0.0%) |
| 1 or 2 Children | 0 (0.0%) | 0 (0.0%) |
| 3 or 4 Children | 0 (0.0%) | 0 (0.0%) |
| 5 or more Children | 0 (0.0%) | 0 (0.0%) |
| Total | 38 (100.0%) | 0 (0.0%) |
Income Below Poverty Among Single-Parent Households in Pump Back
| Children | Single Father | Single Mother |
| No Children | 0 (0.0%) | 0 (0.0%) |
| 1 or 2 Children | 0 (0.0%) | 0 (0.0%) |
| 3 or 4 Children | 0 (0.0%) | 0 (0.0%) |
| 5 or more Children | 0 (0.0%) | 0 (0.0%) |
| Total | 0 (0.0%) | 0 (0.0%) |
Income Below Poverty Among Married-Couple vs Single-Parent Households in Pump Back
| Children | Married-Couple Families | Single-Parent Households |
| No Children | 0 (0.0%) | 0 (0.0%) |
| 1 or 2 Children | 0 (0.0%) | 0 (0.0%) |
| 3 or 4 Children | 0 (0.0%) | 0 (0.0%) |
| 5 or more Children | 0 (0.0%) | 0 (0.0%) |
| Total | 0 (0.0%) | 0 (0.0%) |
Race in Pump Back
The most populous races in Pump Back are White / Caucasian (109 | 79.0%), and Native / Alaskan (29 | 21.0%).
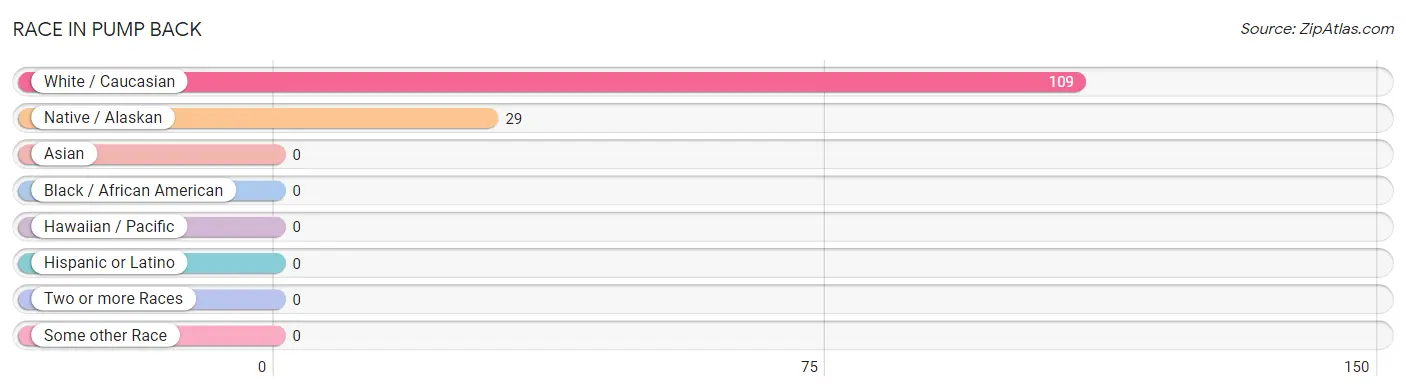
| Race | # Population | % Population |
| Asian | 0 | 0.0% |
| Black / African American | 0 | 0.0% |
| Hawaiian / Pacific | 0 | 0.0% |
| Hispanic or Latino | 0 | 0.0% |
| Native / Alaskan | 29 | 21.0% |
| White / Caucasian | 109 | 79.0% |
| Two or more Races | 0 | 0.0% |
| Some other Race | 0 | 0.0% |
| Total | 138 | 100.0% |
Ancestry in Pump Back
The most populous ancestries reported in Pump Back are German (30 | 21.7%), Cherokee (29 | 21.0%), European (13 | 9.4%), Scandinavian (9 | 6.5%), and English (8 | 5.8%), together accounting for 64.5% of all Pump Back residents.
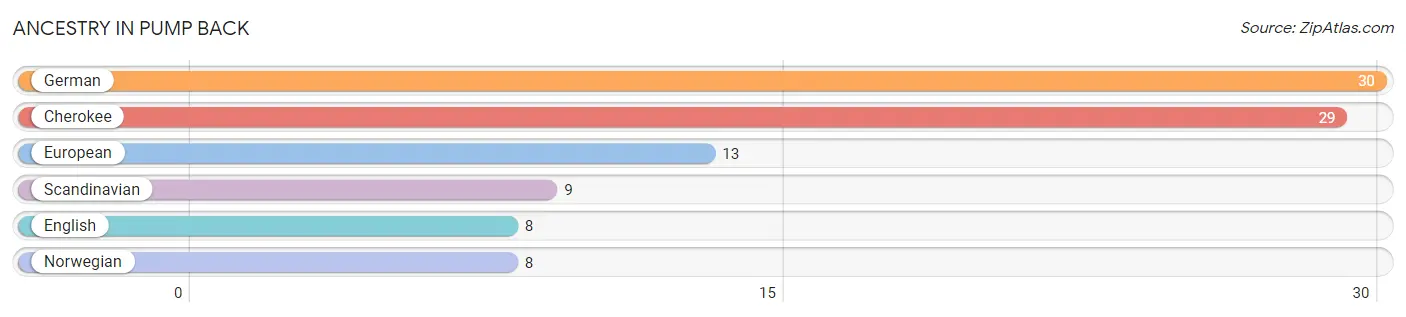
| Ancestry | # Population | % Population |
| Cherokee | 29 | 21.0% |
| English | 8 | 5.8% |
| European | 13 | 9.4% |
| German | 30 | 21.7% |
| Norwegian | 8 | 5.8% |
| Scandinavian | 9 | 6.5% | View All 6 Rows |
Immigrants in Pump Back

| Immigration Origin | # Population | % Population | View All 0 Rows |
Sex and Age in Pump Back
Sex and Age in Pump Back
The most populous age groups in Pump Back are 25 to 29 Years (23 | 26.1%) for men and 60 to 64 Years (15 | 30.0%) for women.
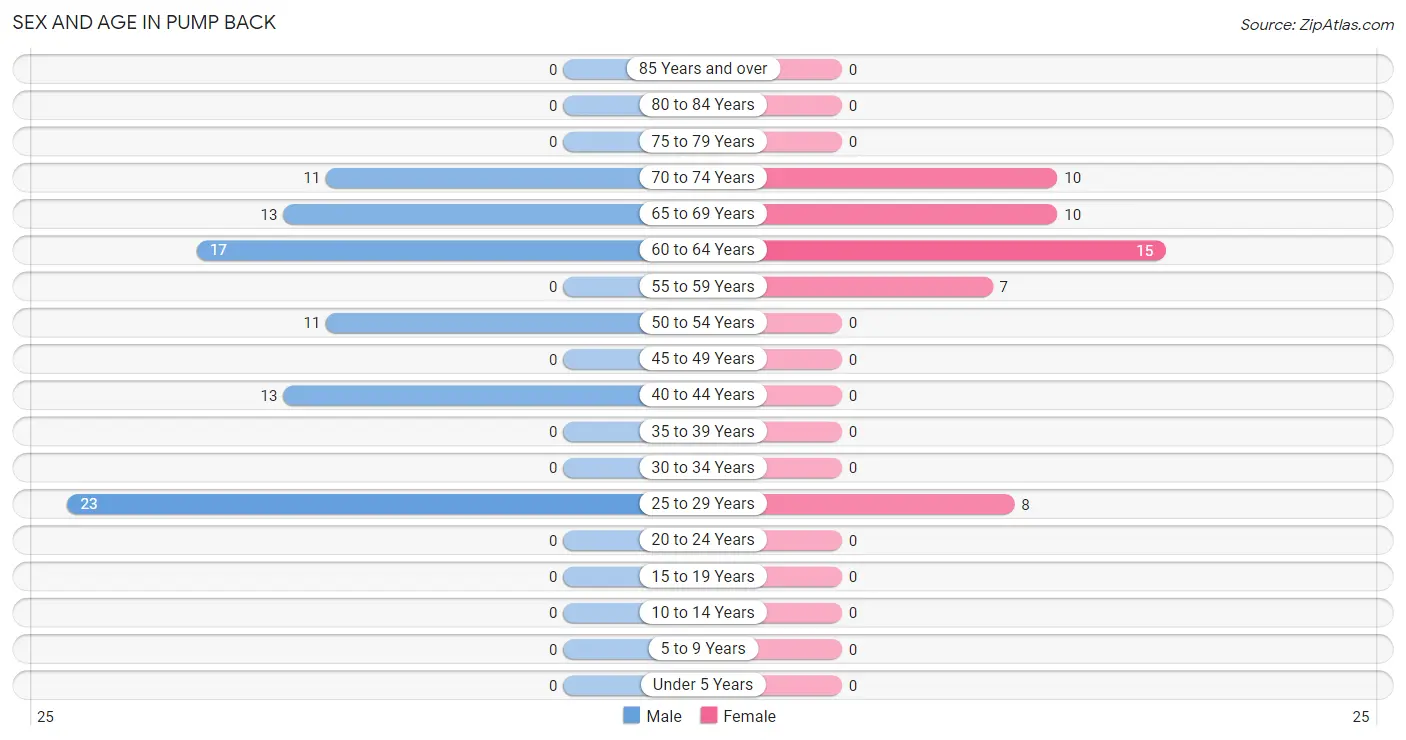
| Age Bracket | Male | Female |
| Under 5 Years | 0 (0.0%) | 0 (0.0%) |
| 5 to 9 Years | 0 (0.0%) | 0 (0.0%) |
| 10 to 14 Years | 0 (0.0%) | 0 (0.0%) |
| 15 to 19 Years | 0 (0.0%) | 0 (0.0%) |
| 20 to 24 Years | 0 (0.0%) | 0 (0.0%) |
| 25 to 29 Years | 23 (26.1%) | 8 (16.0%) |
| 30 to 34 Years | 0 (0.0%) | 0 (0.0%) |
| 35 to 39 Years | 0 (0.0%) | 0 (0.0%) |
| 40 to 44 Years | 13 (14.8%) | 0 (0.0%) |
| 45 to 49 Years | 0 (0.0%) | 0 (0.0%) |
| 50 to 54 Years | 11 (12.5%) | 0 (0.0%) |
| 55 to 59 Years | 0 (0.0%) | 7 (14.0%) |
| 60 to 64 Years | 17 (19.3%) | 15 (30.0%) |
| 65 to 69 Years | 13 (14.8%) | 10 (20.0%) |
| 70 to 74 Years | 11 (12.5%) | 10 (20.0%) |
| 75 to 79 Years | 0 (0.0%) | 0 (0.0%) |
| 80 to 84 Years | 0 (0.0%) | 0 (0.0%) |
| 85 Years and over | 0 (0.0%) | 0 (0.0%) |
| Total | 88 (100.0%) | 50 (100.0%) |
Families and Households in Pump Back
Median Family Size in Pump Back
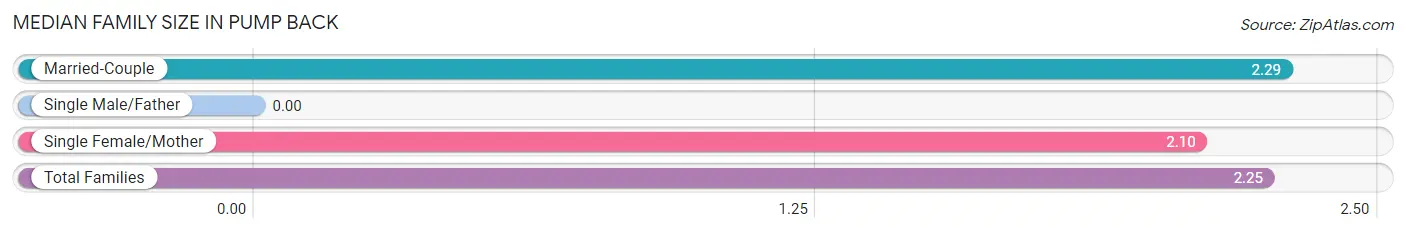
| Family Type | # Families | Family Size |
| Married-Couple | 38 (79.2%) | 2.29 |
| Single Male/Father | 0 (0.0%) | - |
| Single Female/Mother | 10 (20.8%) | 2.10 |
| Total Families | 48 (100.0%) | 2.25 |
Median Household Size in Pump Back
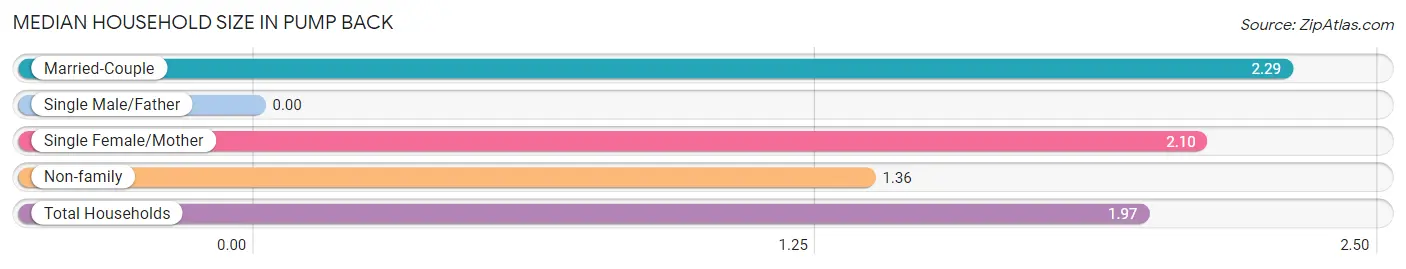
| Household Type | # Households | Household Size |
| Married-Couple | 38 (54.3%) | 2.29 |
| Single Male/Father | 0 (0.0%) | - |
| Single Female/Mother | 10 (14.3%) | 2.10 |
| Non-family | 22 (31.4%) | 1.36 |
| Total Households | 70 (100.0%) | 1.97 |
Household Size by Marriage Status in Pump Back
Out of a total of 70 households in Pump Back, 48 (68.6%) are family households, while 22 (31.4%) are nonfamily households. The most numerous type of family households are 2-person households, comprising 39, and the most common type of nonfamily households are 1-person households, comprising 13.
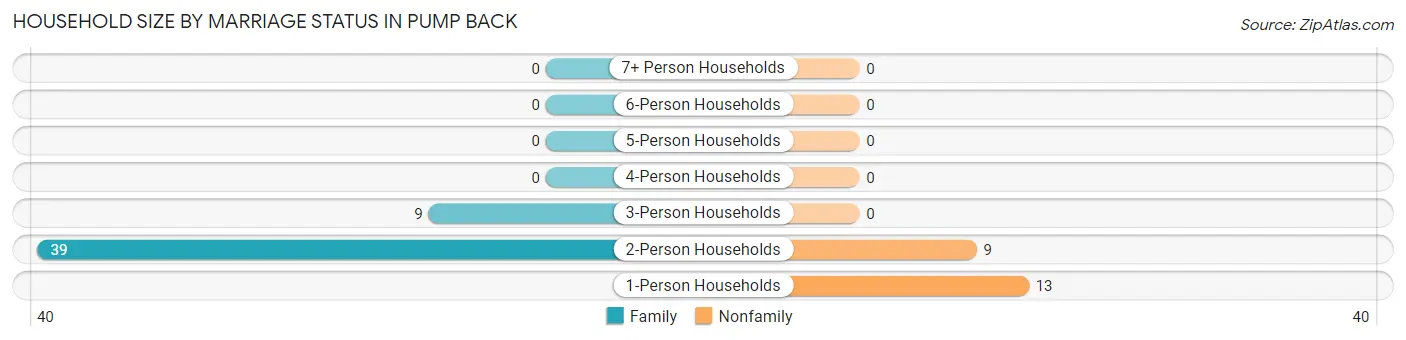
| Household Size | Family Households | Nonfamily Households |
| 1-Person Households | - | 13 (18.6%) |
| 2-Person Households | 39 (55.7%) | 9 (12.9%) |
| 3-Person Households | 9 (12.9%) | 0 (0.0%) |
| 4-Person Households | 0 (0.0%) | 0 (0.0%) |
| 5-Person Households | 0 (0.0%) | 0 (0.0%) |
| 6-Person Households | 0 (0.0%) | 0 (0.0%) |
| 7+ Person Households | 0 (0.0%) | 0 (0.0%) |
| Total | 48 (68.6%) | 22 (31.4%) |
Female Fertility in Pump Back
Fertility by Age in Pump Back
| Age Bracket | Women with Births | Births / 1,000 Women |
| 15 to 19 years | 0 (0.0%) | 0.0 |
| 20 to 34 years | 0 (0.0%) | 0.0 |
| 35 to 50 years | 0 (0.0%) | 0.0 |
| Total | 0 (0.0%) | 0.0 |
Fertility by Age by Marriage Status in Pump Back
| Age Bracket | Married | Unmarried |
| 15 to 19 years | 0 (0.0%) | 0 (0.0%) |
| 20 to 34 years | 0 (0.0%) | 0 (0.0%) |
| 35 to 50 years | 0 (0.0%) | 0 (0.0%) |
| Total | 0 (0.0%) | 0 (0.0%) |
Fertility by Education in Pump Back
| Educational Attainment | Women with Births | Births / 1,000 Women |
| Less than High School | 0 (0.0%) | 0.0 |
| High School Diploma | 0 (0.0%) | 0.0 |
| College or Associate's Degree | 0 (0.0%) | 0.0 |
| Bachelor's Degree | 0 (0.0%) | 0.0 |
| Graduate Degree | 0 (0.0%) | 0.0 |
| Total | 0 (0.0%) | 0.0 |
Fertility by Education by Marriage Status in Pump Back
| Educational Attainment | Married | Unmarried |
| Less than High School | 0 (0.0%) | 0 (0.0%) |
| High School Diploma | 0 (0.0%) | 0 (0.0%) |
| College or Associate's Degree | 0 (0.0%) | 0 (0.0%) |
| Bachelor's Degree | 0 (0.0%) | 0 (0.0%) |
| Graduate Degree | 0 (0.0%) | 0 (0.0%) |
| Total | 0 (0.0%) | 0 (0.0%) |
Employment Characteristics in Pump Back
Employment by Class of Employer in Pump Back
Among the 86 employed individuals in Pump Back, private company employees (54 | 62.8%), not-for-profit organizations (17 | 19.8%), and self-employed (incorporated) (15 | 17.4%) make up the most common classes of employment.
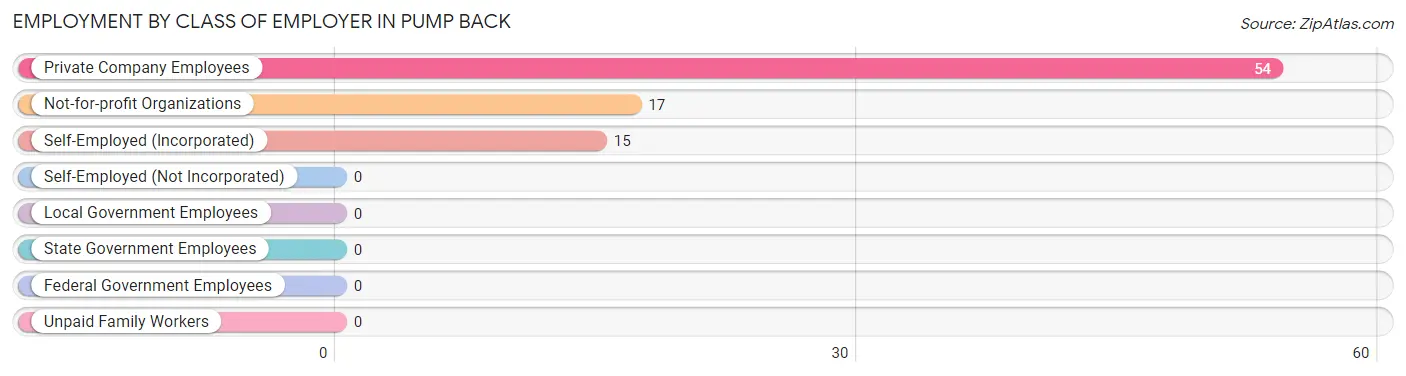
| Employer Class | # Employees | % Employees |
| Private Company Employees | 54 | 62.8% |
| Self-Employed (Incorporated) | 15 | 17.4% |
| Self-Employed (Not Incorporated) | 0 | 0.0% |
| Not-for-profit Organizations | 17 | 19.8% |
| Local Government Employees | 0 | 0.0% |
| State Government Employees | 0 | 0.0% |
| Federal Government Employees | 0 | 0.0% |
| Unpaid Family Workers | 0 | 0.0% |
| Total | 86 | 100.0% |
Employment Status by Age in Pump Back
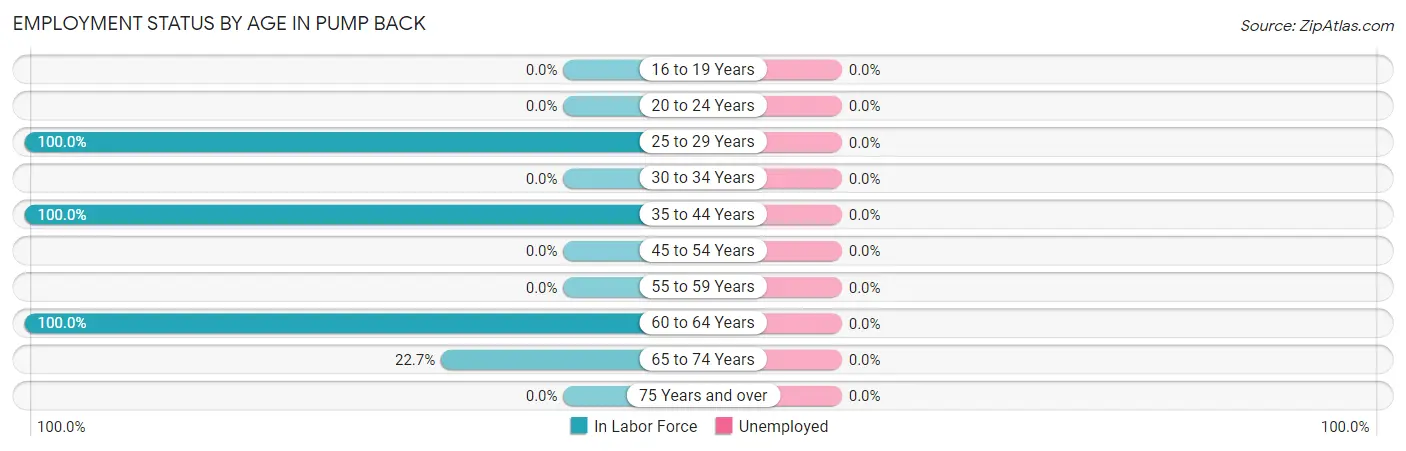
| Age Bracket | In Labor Force | Unemployed |
| 16 to 19 Years | 0 (0.0%) | 0 (0.0%) |
| 20 to 24 Years | 0 (0.0%) | 0 (0.0%) |
| 25 to 29 Years | 31 (100.0%) | 0 (0.0%) |
| 30 to 34 Years | 0 (0.0%) | 0 (0.0%) |
| 35 to 44 Years | 13 (100.0%) | 0 (0.0%) |
| 45 to 54 Years | 0 (0.0%) | 0 (0.0%) |
| 55 to 59 Years | 0 (0.0%) | 0 (0.0%) |
| 60 to 64 Years | 32 (100.0%) | 0 (0.0%) |
| 65 to 74 Years | 10 (22.7%) | 0 (0.0%) |
| 75 Years and over | 0 (0.0%) | 0 (0.0%) |
| Total | 86 (62.3%) | 0 (0.0%) |
Employment Status by Educational Attainment in Pump Back
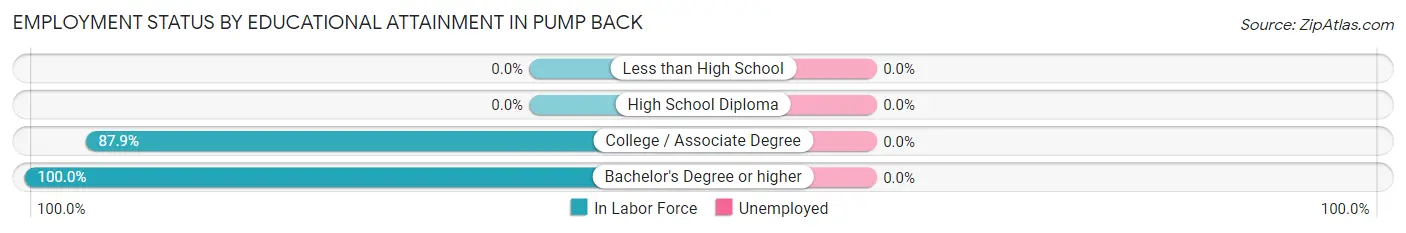
| Educational Attainment | In Labor Force | Unemployed |
| Less than High School | 0 (0.0%) | 0 (0.0%) |
| High School Diploma | 0 (0.0%) | 0 (0.0%) |
| College / Associate Degree | 51 (87.9%) | 0 (0.0%) |
| Bachelor's Degree or higher | 25 (100.0%) | 0 (0.0%) |
| Total | 76 (80.9%) | 0 (0.0%) |
Employment Occupations by Sex in Pump Back
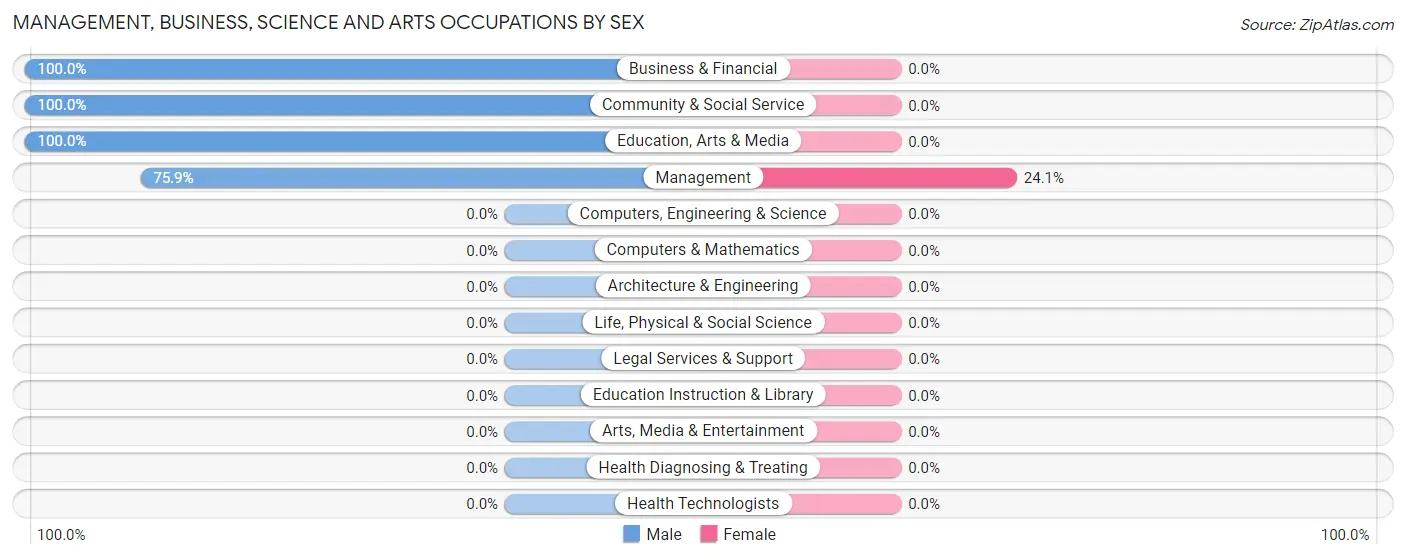
Management, Business, Science and Arts Occupations
The most common Management, Business, Science and Arts occupations in Pump Back are Management (29 | 33.7%), Community & Social Service (9 | 10.5%), Education, Arts & Media (9 | 10.5%), and Business & Financial (8 | 9.3%).
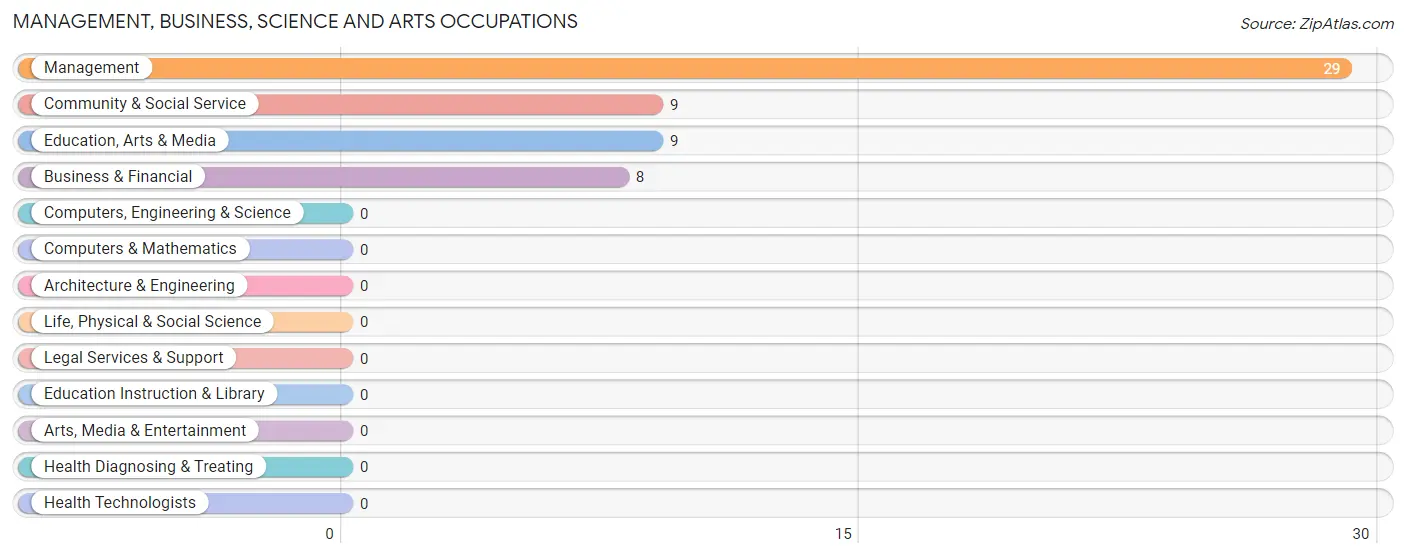
Management, Business, Science and Arts Occupations by Sex
| Occupation | Male | Female |
| Management | 22 (75.9%) | 7 (24.1%) |
| Business & Financial | 8 (100.0%) | 0 (0.0%) |
| Computers, Engineering & Science | 0 (0.0%) | 0 (0.0%) |
| Computers & Mathematics | 0 (0.0%) | 0 (0.0%) |
| Architecture & Engineering | 0 (0.0%) | 0 (0.0%) |
| Life, Physical & Social Science | 0 (0.0%) | 0 (0.0%) |
| Community & Social Service | 9 (100.0%) | 0 (0.0%) |
| Education, Arts & Media | 9 (100.0%) | 0 (0.0%) |
| Legal Services & Support | 0 (0.0%) | 0 (0.0%) |
| Education Instruction & Library | 0 (0.0%) | 0 (0.0%) |
| Arts, Media & Entertainment | 0 (0.0%) | 0 (0.0%) |
| Health Diagnosing & Treating | 0 (0.0%) | 0 (0.0%) |
| Health Technologists | 0 (0.0%) | 0 (0.0%) |
| Total (Category) | 39 (84.8%) | 7 (15.2%) |
| Total (Overall) | 53 (61.6%) | 33 (38.4%) |
Services Occupations
Services Occupations by Sex
| Occupation | Male | Female |
| Healthcare Support | 0 (0.0%) | 0 (0.0%) |
| Security & Protection | 0 (0.0%) | 0 (0.0%) |
| Firefighting & Prevention | 0 (0.0%) | 0 (0.0%) |
| Law Enforcement | 0 (0.0%) | 0 (0.0%) |
| Food Preparation & Serving | 0 (0.0%) | 0 (0.0%) |
| Cleaning & Maintenance | 0 (0.0%) | 0 (0.0%) |
| Personal Care & Service | 0 (0.0%) | 0 (0.0%) |
| Total (Category) | 0 (0.0%) | 0 (0.0%) |
| Total (Overall) | 53 (61.6%) | 33 (38.4%) |
Sales and Office Occupations
The most common Sales and Office occupations in Pump Back are , and Office & Administration (26 | 30.2%).
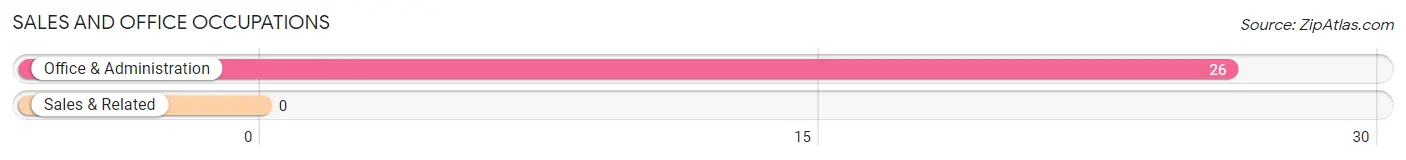
Sales and Office Occupations by Sex
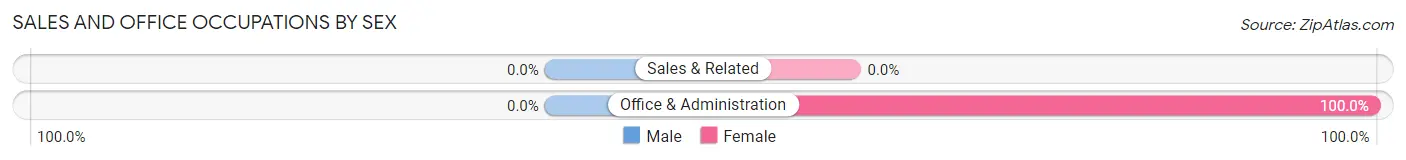
| Occupation | Male | Female |
| Sales & Related | 0 (0.0%) | 0 (0.0%) |
| Office & Administration | 0 (0.0%) | 26 (100.0%) |
| Total (Category) | 0 (0.0%) | 26 (100.0%) |
| Total (Overall) | 53 (61.6%) | 33 (38.4%) |
Natural Resources, Construction and Maintenance Occupations
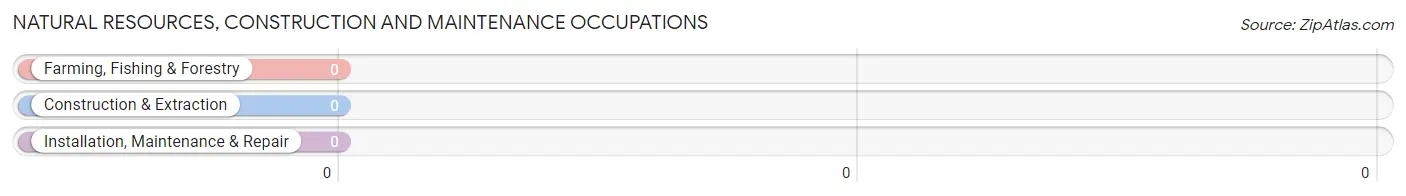
Natural Resources, Construction and Maintenance Occupations by Sex
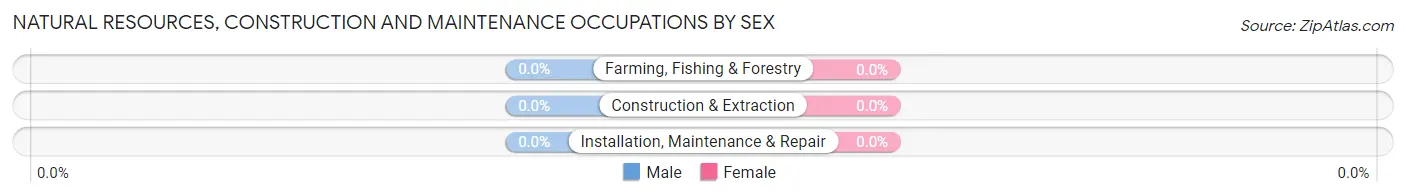
| Occupation | Male | Female |
| Farming, Fishing & Forestry | 0 (0.0%) | 0 (0.0%) |
| Construction & Extraction | 0 (0.0%) | 0 (0.0%) |
| Installation, Maintenance & Repair | 0 (0.0%) | 0 (0.0%) |
| Total (Category) | 0 (0.0%) | 0 (0.0%) |
| Total (Overall) | 53 (61.6%) | 33 (38.4%) |
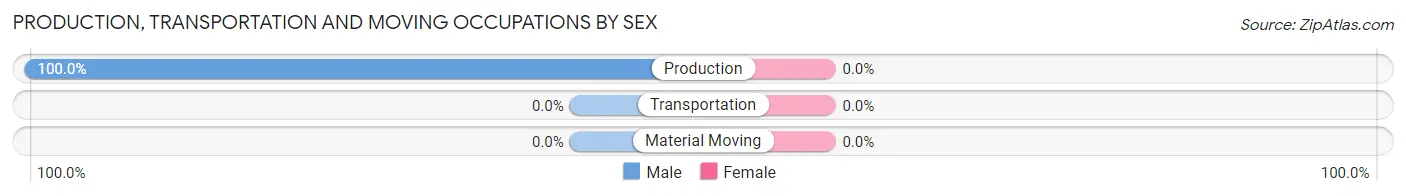
Production, Transportation and Moving Occupations
The most common Production, Transportation and Moving occupations in Pump Back are , and Production (14 | 16.3%).
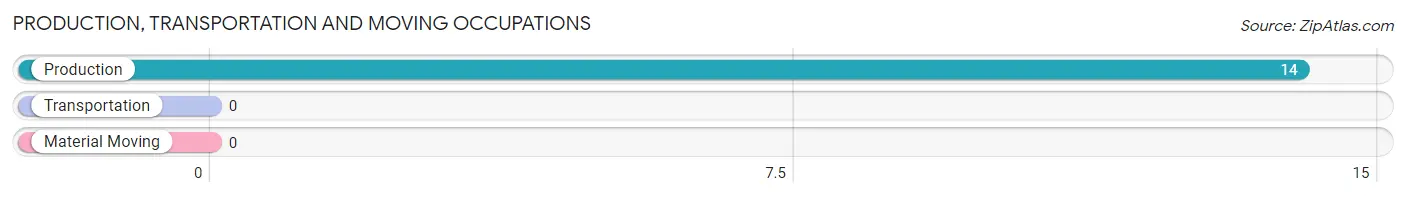
Production, Transportation and Moving Occupations by Sex
| Occupation | Male | Female |
| Production | 14 (100.0%) | 0 (0.0%) |
| Transportation | 0 (0.0%) | 0 (0.0%) |
| Material Moving | 0 (0.0%) | 0 (0.0%) |
| Total (Category) | 14 (100.0%) | 0 (0.0%) |
| Total (Overall) | 53 (61.6%) | 33 (38.4%) |
Employment Industries by Sex in Pump Back
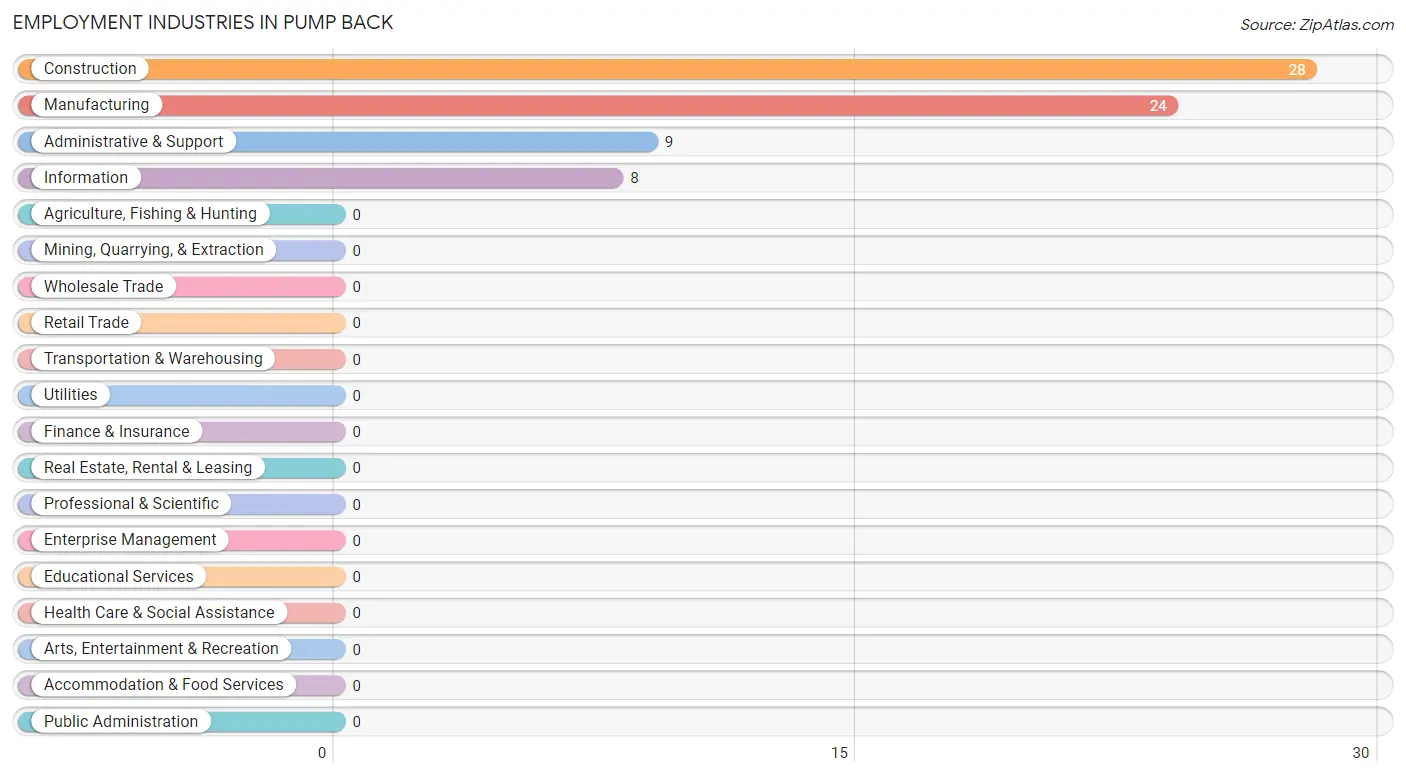
Employment Industries in Pump Back
The major employment industries in Pump Back include Construction (28 | 32.6%), Manufacturing (24 | 27.9%), Administrative & Support (9 | 10.5%), and Information (8 | 9.3%).
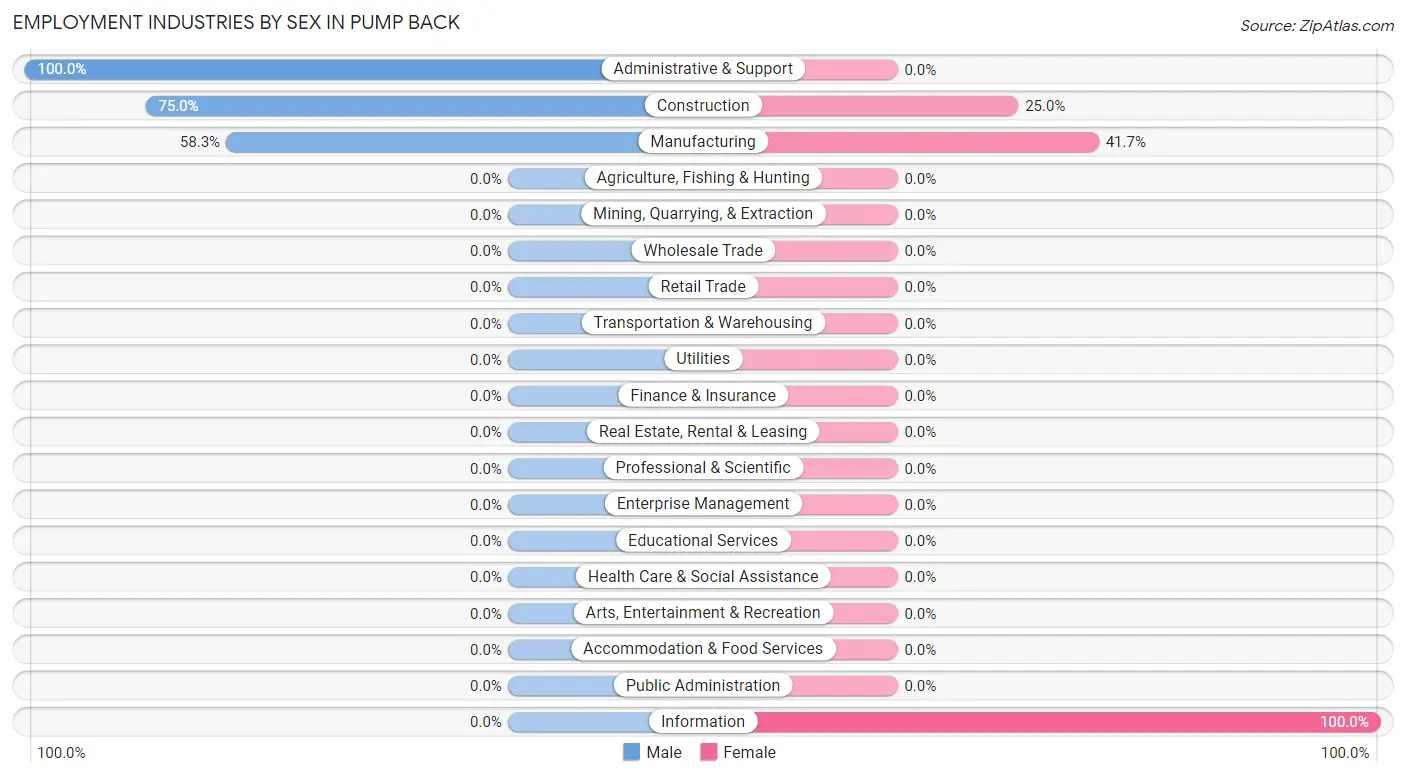
Employment Industries by Sex in Pump Back
The Pump Back industries that see more men than women are Administrative & Support (100.0%), Construction (75.0%), and Manufacturing (58.3%), whereas the industries that tend to have a higher number of women are Information (100.0%), Manufacturing (41.7%), and Construction (25.0%).
| Industry | Male | Female |
| Agriculture, Fishing & Hunting | 0 (0.0%) | 0 (0.0%) |
| Mining, Quarrying, & Extraction | 0 (0.0%) | 0 (0.0%) |
| Construction | 21 (75.0%) | 7 (25.0%) |
| Manufacturing | 14 (58.3%) | 10 (41.7%) |
| Wholesale Trade | 0 (0.0%) | 0 (0.0%) |
| Retail Trade | 0 (0.0%) | 0 (0.0%) |
| Transportation & Warehousing | 0 (0.0%) | 0 (0.0%) |
| Utilities | 0 (0.0%) | 0 (0.0%) |
| Information | 0 (0.0%) | 8 (100.0%) |
| Finance & Insurance | 0 (0.0%) | 0 (0.0%) |
| Real Estate, Rental & Leasing | 0 (0.0%) | 0 (0.0%) |
| Professional & Scientific | 0 (0.0%) | 0 (0.0%) |
| Enterprise Management | 0 (0.0%) | 0 (0.0%) |
| Administrative & Support | 9 (100.0%) | 0 (0.0%) |
| Educational Services | 0 (0.0%) | 0 (0.0%) |
| Health Care & Social Assistance | 0 (0.0%) | 0 (0.0%) |
| Arts, Entertainment & Recreation | 0 (0.0%) | 0 (0.0%) |
| Accommodation & Food Services | 0 (0.0%) | 0 (0.0%) |
| Public Administration | 0 (0.0%) | 0 (0.0%) |
| Total | 53 (61.6%) | 33 (38.4%) |
Education in Pump Back
School Enrollment in Pump Back
| School Level | # Students | % Students |
| Nursery / Preschool | 0 | 0.0% |
| Kindergarten | 0 | 0.0% |
| Elementary School | 0 | 0.0% |
| Middle School | 0 | 0.0% |
| High School | 0 | 0.0% |
| College / Undergraduate | 0 | 0.0% |
| Graduate / Professional | 0 | 0.0% |
| Total | 0 | 0.0% |
School Enrollment by Age by Funding Source in Pump Back
| Age Bracket | Public School | Private School |
| 3 to 4 Year Olds | 0 (0.0%) | 0 (0.0%) |
| 5 to 9 Year Old | 0 (0.0%) | 0 (0.0%) |
| 10 to 14 Year Olds | 0 (0.0%) | 0 (0.0%) |
| 15 to 17 Year Olds | 0 (0.0%) | 0 (0.0%) |
| 18 to 19 Year Olds | 0 (0.0%) | 0 (0.0%) |
| 20 to 24 Year Olds | 0 (0.0%) | 0 (0.0%) |
| 25 to 34 Year Olds | 0 (0.0%) | 0 (0.0%) |
| 35 Years and over | 0 (0.0%) | 0 (0.0%) |
| Total | 0 (0.0%) | 0 (0.0%) |
Educational Attainment by Field of Study in Pump Back
Education (19 | 38.8%), science & technology (13 | 26.5%), psychology (9 | 18.4%), and communications (8 | 16.3%) are the most common fields of study among 49 individuals in Pump Back who have obtained a bachelor's degree or higher.
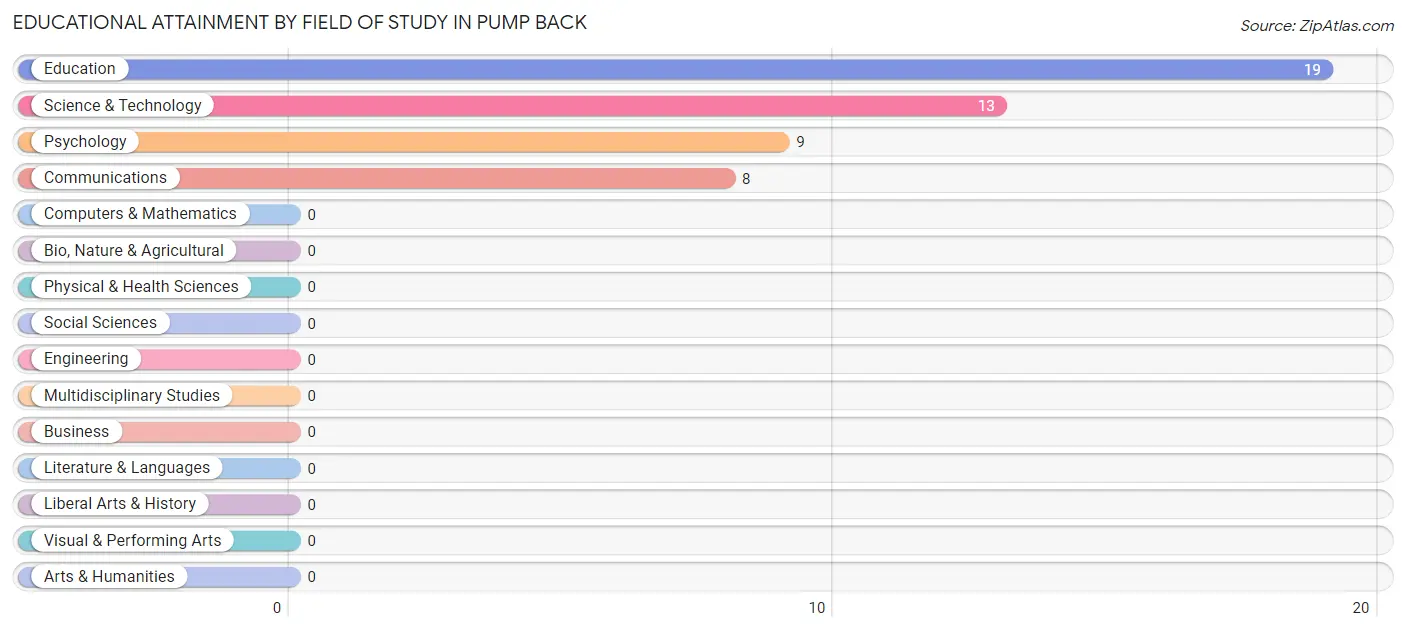
| Field of Study | # Graduates | % Graduates |
| Computers & Mathematics | 0 | 0.0% |
| Bio, Nature & Agricultural | 0 | 0.0% |
| Physical & Health Sciences | 0 | 0.0% |
| Psychology | 9 | 18.4% |
| Social Sciences | 0 | 0.0% |
| Engineering | 0 | 0.0% |
| Multidisciplinary Studies | 0 | 0.0% |
| Science & Technology | 13 | 26.5% |
| Business | 0 | 0.0% |
| Education | 19 | 38.8% |
| Literature & Languages | 0 | 0.0% |
| Liberal Arts & History | 0 | 0.0% |
| Visual & Performing Arts | 0 | 0.0% |
| Communications | 8 | 16.3% |
| Arts & Humanities | 0 | 0.0% |
| Total | 49 | 100.0% |
Transportation & Commute in Pump Back
Vehicle Availability by Sex in Pump Back
The most prevalent vehicle ownership categories in Pump Back are males with 4 vehicles (23, accounting for 43.4%) and females with 4 vehicles (8, making up 69.7%).
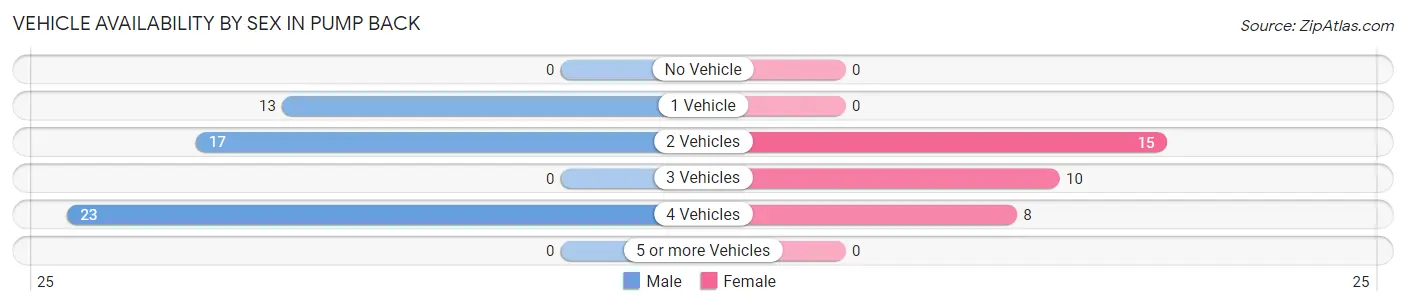
| Vehicles Available | Male | Female |
| No Vehicle | 0 (0.0%) | 0 (0.0%) |
| 1 Vehicle | 13 (24.5%) | 0 (0.0%) |
| 2 Vehicles | 17 (32.1%) | 15 (45.5%) |
| 3 Vehicles | 0 (0.0%) | 10 (30.3%) |
| 4 Vehicles | 23 (43.4%) | 8 (24.2%) |
| 5 or more Vehicles | 0 (0.0%) | 0 (0.0%) |
| Total | 53 (100.0%) | 33 (100.0%) |
Commute Time in Pump Back
The most frequently occuring commute durations in Pump Back are 20 to 24 minutes (23 commuters, 26.7%), 10 to 14 minutes (17 commuters, 19.8%), and 35 to 39 minutes (15 commuters, 17.4%).
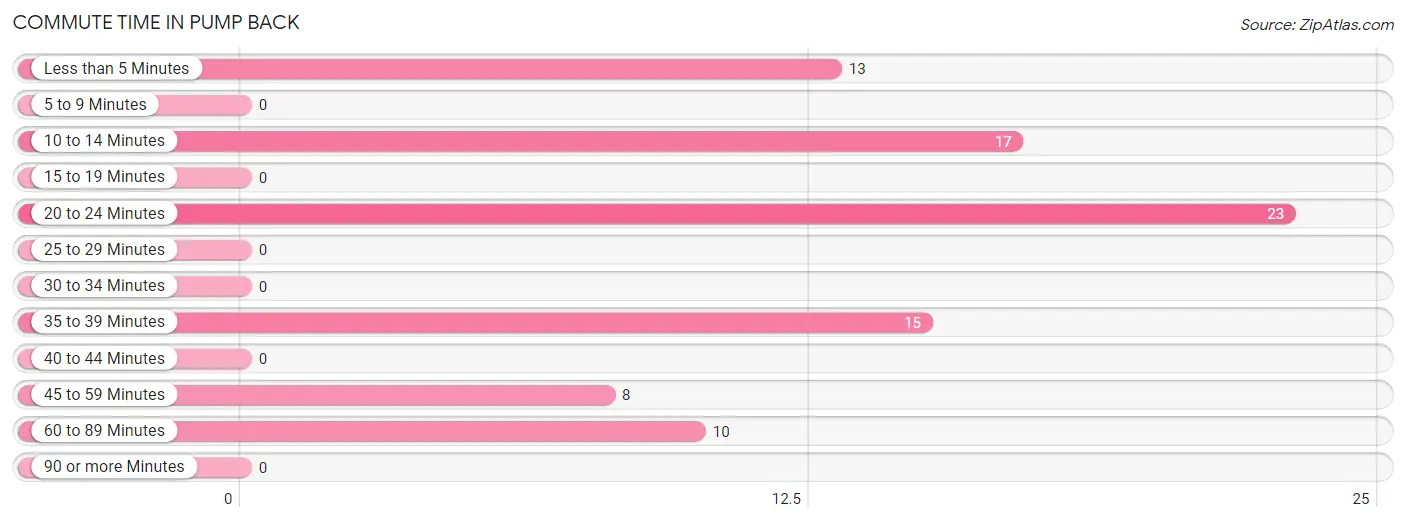
| Commute Time | # Commuters | % Commuters |
| Less than 5 Minutes | 13 | 15.1% |
| 5 to 9 Minutes | 0 | 0.0% |
| 10 to 14 Minutes | 17 | 19.8% |
| 15 to 19 Minutes | 0 | 0.0% |
| 20 to 24 Minutes | 23 | 26.7% |
| 25 to 29 Minutes | 0 | 0.0% |
| 30 to 34 Minutes | 0 | 0.0% |
| 35 to 39 Minutes | 15 | 17.4% |
| 40 to 44 Minutes | 0 | 0.0% |
| 45 to 59 Minutes | 8 | 9.3% |
| 60 to 89 Minutes | 10 | 11.6% |
| 90 or more Minutes | 0 | 0.0% |
Commute Time by Sex in Pump Back
The most common commute times in Pump Back are 20 to 24 minutes (23 commuters, 43.4%) for males and 60 to 89 minutes (10 commuters, 30.3%) for females.
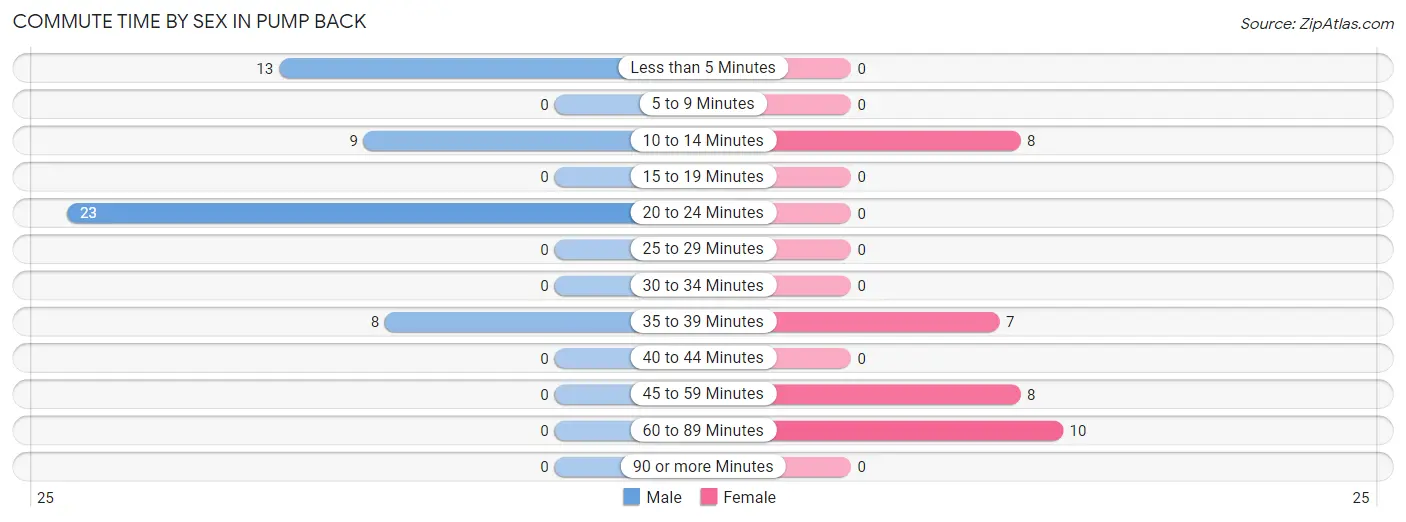
| Commute Time | Male | Female |
| Less than 5 Minutes | 13 (24.5%) | 0 (0.0%) |
| 5 to 9 Minutes | 0 (0.0%) | 0 (0.0%) |
| 10 to 14 Minutes | 9 (17.0%) | 8 (24.2%) |
| 15 to 19 Minutes | 0 (0.0%) | 0 (0.0%) |
| 20 to 24 Minutes | 23 (43.4%) | 0 (0.0%) |
| 25 to 29 Minutes | 0 (0.0%) | 0 (0.0%) |
| 30 to 34 Minutes | 0 (0.0%) | 0 (0.0%) |
| 35 to 39 Minutes | 8 (15.1%) | 7 (21.2%) |
| 40 to 44 Minutes | 0 (0.0%) | 0 (0.0%) |
| 45 to 59 Minutes | 0 (0.0%) | 8 (24.2%) |
| 60 to 89 Minutes | 0 (0.0%) | 10 (30.3%) |
| 90 or more Minutes | 0 (0.0%) | 0 (0.0%) |
Time of Departure to Work by Sex in Pump Back
The most frequent times of departure to work in Pump Back are 7:30 AM to 7:59 AM (27, 50.9%) for males and 5:30 AM to 5:59 AM (10, 30.3%) for females.
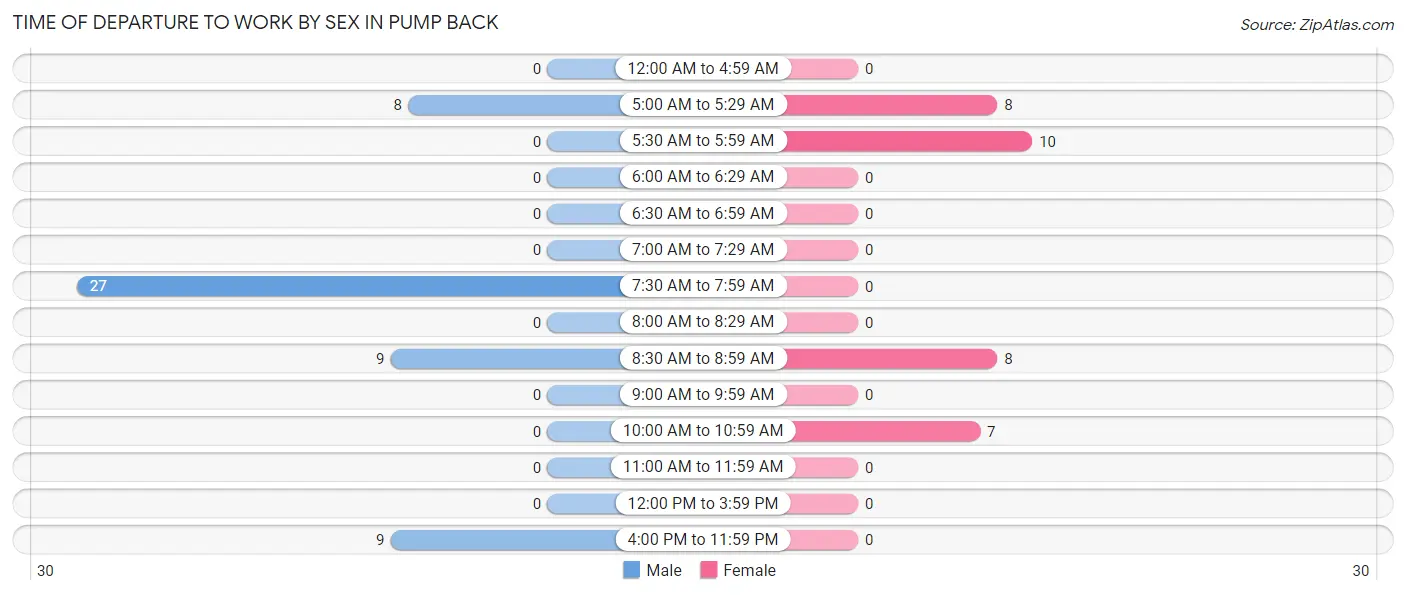
| Time of Departure | Male | Female |
| 12:00 AM to 4:59 AM | 0 (0.0%) | 0 (0.0%) |
| 5:00 AM to 5:29 AM | 8 (15.1%) | 8 (24.2%) |
| 5:30 AM to 5:59 AM | 0 (0.0%) | 10 (30.3%) |
| 6:00 AM to 6:29 AM | 0 (0.0%) | 0 (0.0%) |
| 6:30 AM to 6:59 AM | 0 (0.0%) | 0 (0.0%) |
| 7:00 AM to 7:29 AM | 0 (0.0%) | 0 (0.0%) |
| 7:30 AM to 7:59 AM | 27 (50.9%) | 0 (0.0%) |
| 8:00 AM to 8:29 AM | 0 (0.0%) | 0 (0.0%) |
| 8:30 AM to 8:59 AM | 9 (17.0%) | 8 (24.2%) |
| 9:00 AM to 9:59 AM | 0 (0.0%) | 0 (0.0%) |
| 10:00 AM to 10:59 AM | 0 (0.0%) | 7 (21.2%) |
| 11:00 AM to 11:59 AM | 0 (0.0%) | 0 (0.0%) |
| 12:00 PM to 3:59 PM | 0 (0.0%) | 0 (0.0%) |
| 4:00 PM to 11:59 PM | 9 (17.0%) | 0 (0.0%) |
| Total | 53 (100.0%) | 33 (100.0%) |
Housing Occupancy in Pump Back
Occupancy by Ownership in Pump Back
Of the total 70 dwellings in Pump Back, owner-occupied units account for 52 (74.3%), while renter-occupied units make up 18 (25.7%).
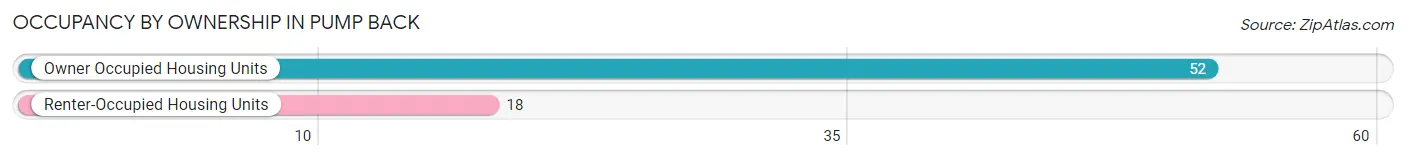
| Occupancy | # Housing Units | % Housing Units |
| Owner Occupied Housing Units | 52 | 74.3% |
| Renter-Occupied Housing Units | 18 | 25.7% |
| Total Occupied Housing Units | 70 | 100.0% |
Occupancy by Household Size in Pump Back
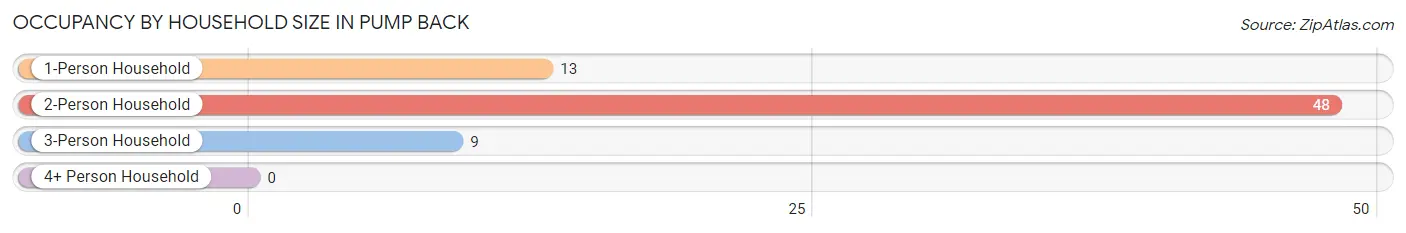
| Household Size | # Housing Units | % Housing Units |
| 1-Person Household | 13 | 18.6% |
| 2-Person Household | 48 | 68.6% |
| 3-Person Household | 9 | 12.9% |
| 4+ Person Household | 0 | 0.0% |
| Total Housing Units | 70 | 100.0% |
Occupancy by Ownership by Household Size in Pump Back
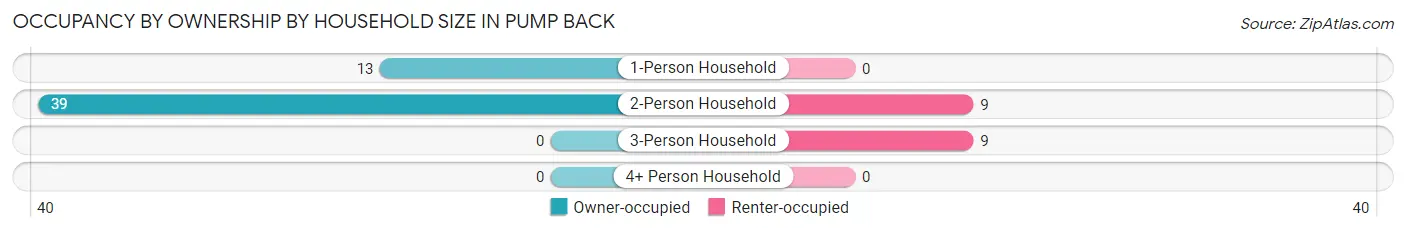
| Household Size | Owner-occupied | Renter-occupied |
| 1-Person Household | 13 (100.0%) | 0 (0.0%) |
| 2-Person Household | 39 (81.2%) | 9 (18.8%) |
| 3-Person Household | 0 (0.0%) | 9 (100.0%) |
| 4+ Person Household | 0 (0.0%) | 0 (0.0%) |
| Total Housing Units | 52 (74.3%) | 18 (25.7%) |
Occupancy by Educational Attainment in Pump Back
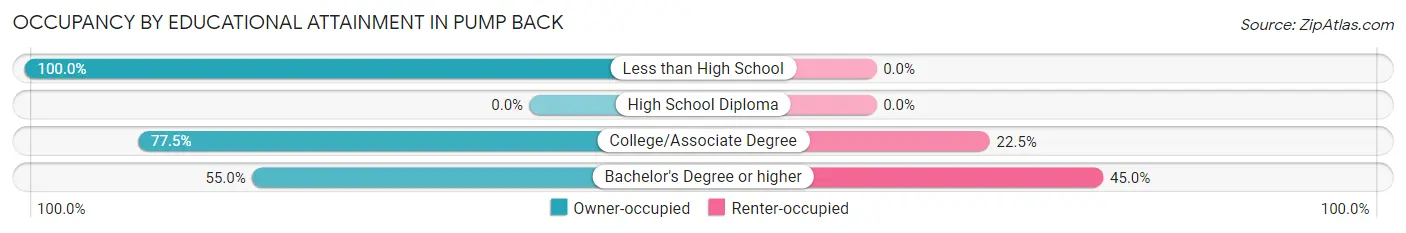
| Household Size | Owner-occupied | Renter-occupied |
| Less than High School | 10 (100.0%) | 0 (0.0%) |
| High School Diploma | 0 (0.0%) | 0 (0.0%) |
| College/Associate Degree | 31 (77.5%) | 9 (22.5%) |
| Bachelor's Degree or higher | 11 (55.0%) | 9 (45.0%) |
Occupancy by Age of Householder in Pump Back
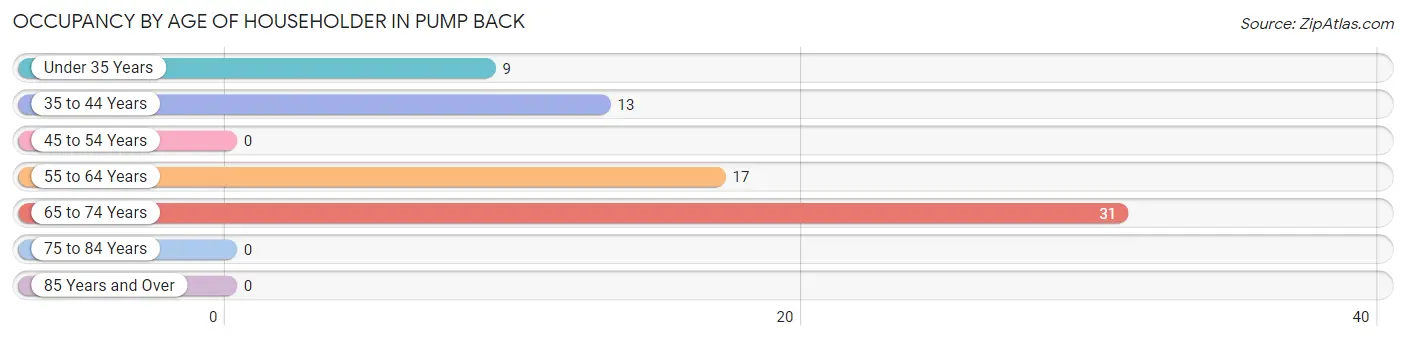
| Age Bracket | # Households | % Households |
| Under 35 Years | 9 | 12.9% |
| 35 to 44 Years | 13 | 18.6% |
| 45 to 54 Years | 0 | 0.0% |
| 55 to 64 Years | 17 | 24.3% |
| 65 to 74 Years | 31 | 44.3% |
| 75 to 84 Years | 0 | 0.0% |
| 85 Years and Over | 0 | 0.0% |
| Total | 70 | 100.0% |
Housing Finances in Pump Back
Median Income by Occupancy in Pump Back
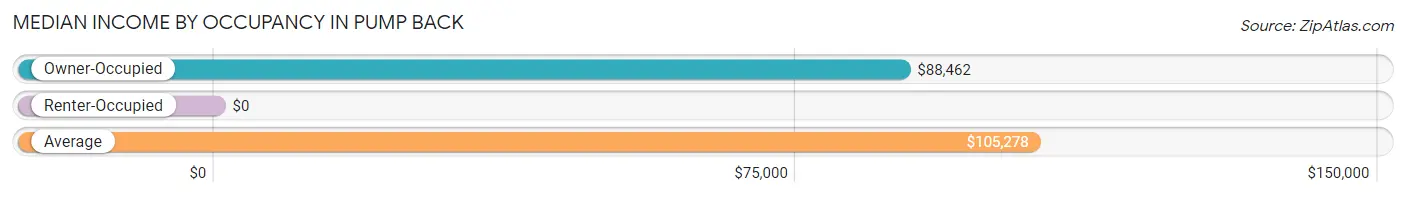
| Occupancy Type | # Households | Median Income |
| Owner-Occupied | 52 (74.3%) | $88,462 |
| Renter-Occupied | 18 (25.7%) | $0 |
| Average | 70 (100.0%) | $105,278 |
Occupancy by Householder Income Bracket in Pump Back
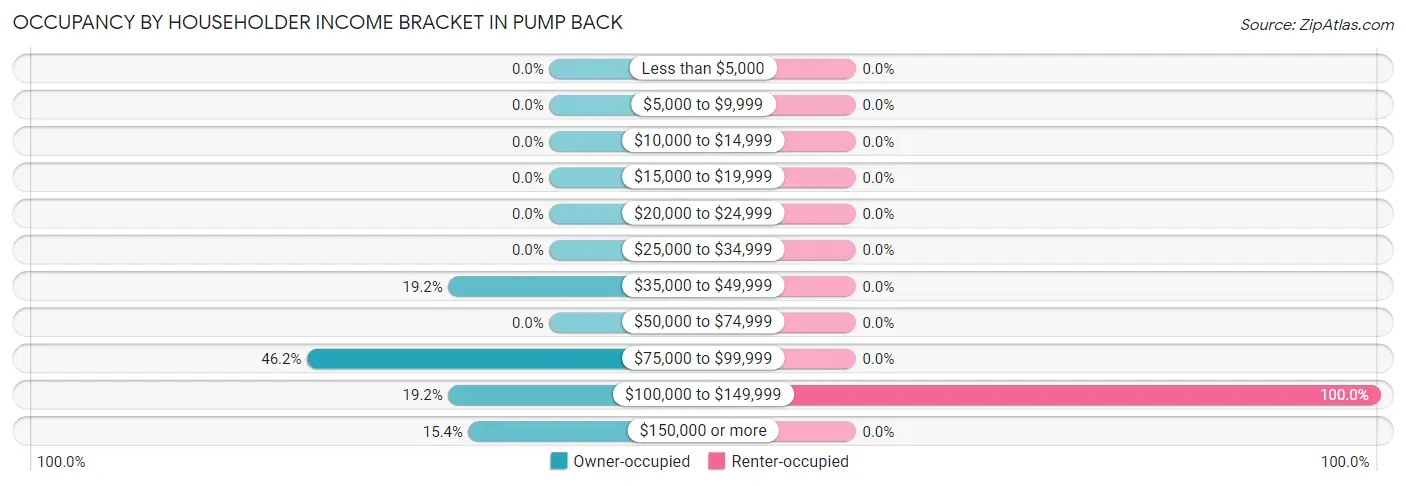
| Income Bracket | Owner-occupied | Renter-occupied |
| Less than $5,000 | 0 (0.0%) | 0 (0.0%) |
| $5,000 to $9,999 | 0 (0.0%) | 0 (0.0%) |
| $10,000 to $14,999 | 0 (0.0%) | 0 (0.0%) |
| $15,000 to $19,999 | 0 (0.0%) | 0 (0.0%) |
| $20,000 to $24,999 | 0 (0.0%) | 0 (0.0%) |
| $25,000 to $34,999 | 0 (0.0%) | 0 (0.0%) |
| $35,000 to $49,999 | 10 (19.2%) | 0 (0.0%) |
| $50,000 to $74,999 | 0 (0.0%) | 0 (0.0%) |
| $75,000 to $99,999 | 24 (46.2%) | 0 (0.0%) |
| $100,000 to $149,999 | 10 (19.2%) | 18 (100.0%) |
| $150,000 or more | 8 (15.4%) | 0 (0.0%) |
| Total | 52 (100.0%) | 18 (100.0%) |
Monthly Housing Cost Tiers in Pump Back
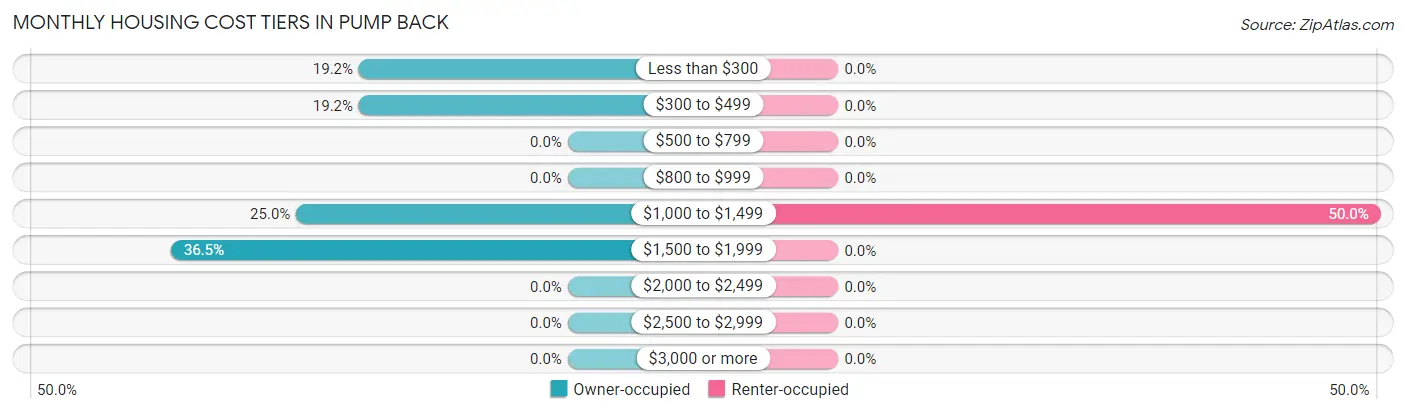
| Monthly Cost | Owner-occupied | Renter-occupied |
| Less than $300 | 10 (19.2%) | 0 (0.0%) |
| $300 to $499 | 10 (19.2%) | 0 (0.0%) |
| $500 to $799 | 0 (0.0%) | 0 (0.0%) |
| $800 to $999 | 0 (0.0%) | 0 (0.0%) |
| $1,000 to $1,499 | 13 (25.0%) | 9 (50.0%) |
| $1,500 to $1,999 | 19 (36.5%) | 0 (0.0%) |
| $2,000 to $2,499 | 0 (0.0%) | 0 (0.0%) |
| $2,500 to $2,999 | 0 (0.0%) | 0 (0.0%) |
| $3,000 or more | 0 (0.0%) | 0 (0.0%) |
| Total | 52 (100.0%) | 18 (100.0%) |
Physical Housing Characteristics in Pump Back
Housing Structures in Pump Back
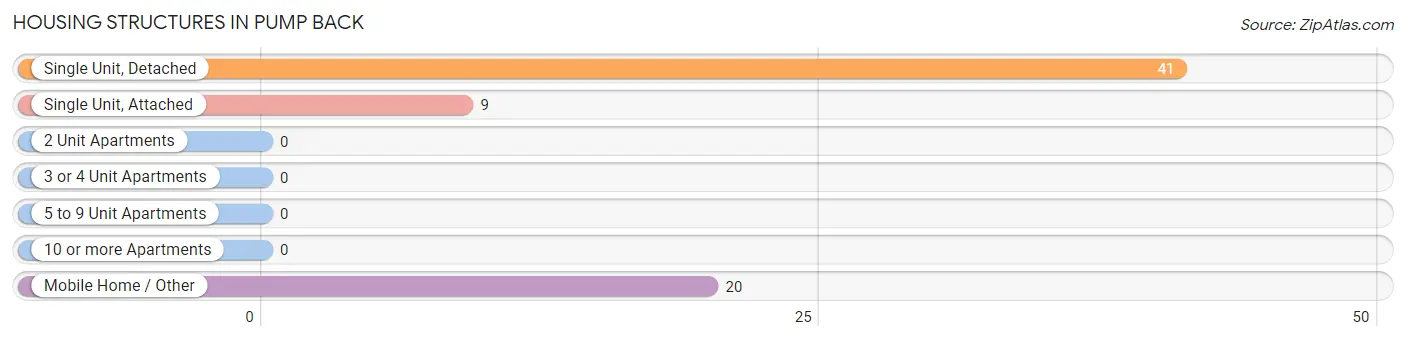
| Structure Type | # Housing Units | % Housing Units |
| Single Unit, Detached | 41 | 58.6% |
| Single Unit, Attached | 9 | 12.9% |
| 2 Unit Apartments | 0 | 0.0% |
| 3 or 4 Unit Apartments | 0 | 0.0% |
| 5 to 9 Unit Apartments | 0 | 0.0% |
| 10 or more Apartments | 0 | 0.0% |
| Mobile Home / Other | 20 | 28.6% |
| Total | 70 | 100.0% |
Housing Structures by Occupancy in Pump Back
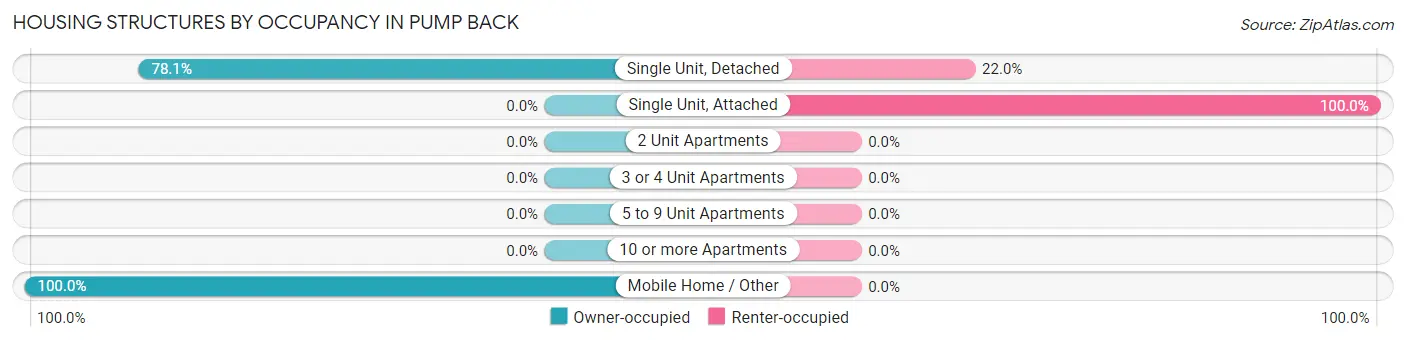
| Structure Type | Owner-occupied | Renter-occupied |
| Single Unit, Detached | 32 (78.0%) | 9 (22.0%) |
| Single Unit, Attached | 0 (0.0%) | 9 (100.0%) |
| 2 Unit Apartments | 0 (0.0%) | 0 (0.0%) |
| 3 or 4 Unit Apartments | 0 (0.0%) | 0 (0.0%) |
| 5 to 9 Unit Apartments | 0 (0.0%) | 0 (0.0%) |
| 10 or more Apartments | 0 (0.0%) | 0 (0.0%) |
| Mobile Home / Other | 20 (100.0%) | 0 (0.0%) |
| Total | 52 (74.3%) | 18 (25.7%) |
Housing Structures by Number of Rooms in Pump Back
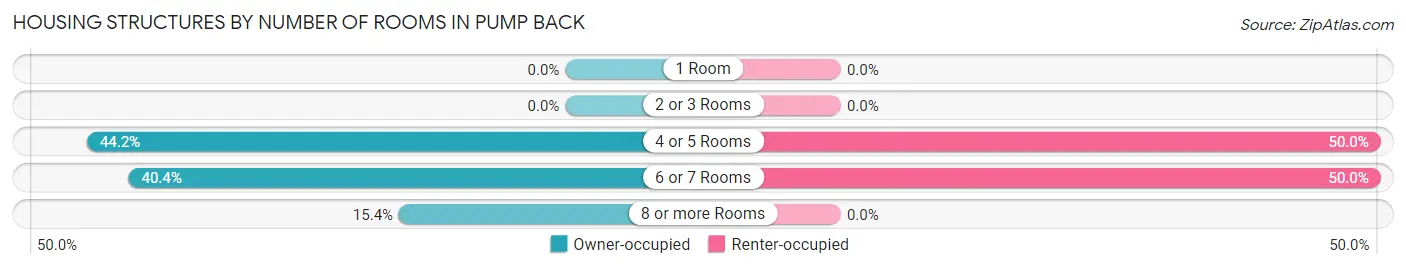
| Number of Rooms | Owner-occupied | Renter-occupied |
| 1 Room | 0 (0.0%) | 0 (0.0%) |
| 2 or 3 Rooms | 0 (0.0%) | 0 (0.0%) |
| 4 or 5 Rooms | 23 (44.2%) | 9 (50.0%) |
| 6 or 7 Rooms | 21 (40.4%) | 9 (50.0%) |
| 8 or more Rooms | 8 (15.4%) | 0 (0.0%) |
| Total | 52 (100.0%) | 18 (100.0%) |
Housing Structure by Heating Type in Pump Back
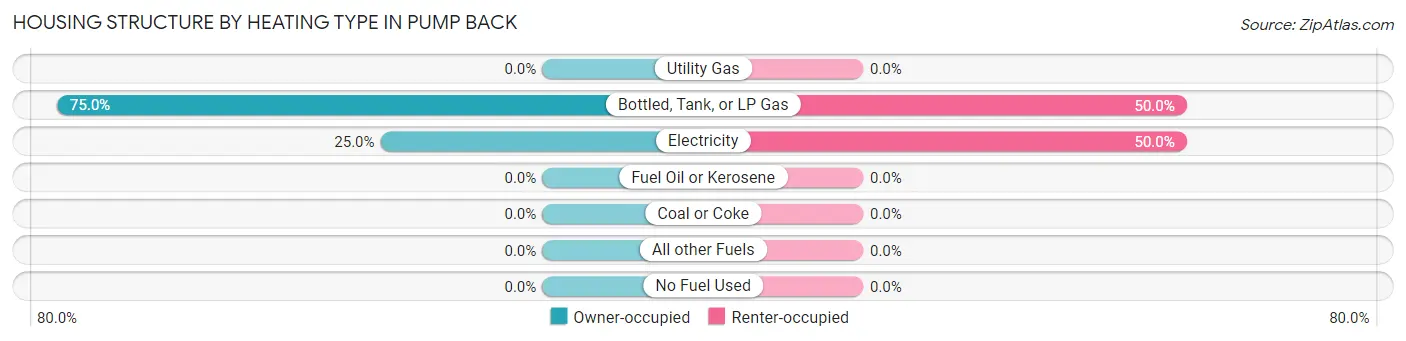
| Heating Type | Owner-occupied | Renter-occupied |
| Utility Gas | 0 (0.0%) | 0 (0.0%) |
| Bottled, Tank, or LP Gas | 39 (75.0%) | 9 (50.0%) |
| Electricity | 13 (25.0%) | 9 (50.0%) |
| Fuel Oil or Kerosene | 0 (0.0%) | 0 (0.0%) |
| Coal or Coke | 0 (0.0%) | 0 (0.0%) |
| All other Fuels | 0 (0.0%) | 0 (0.0%) |
| No Fuel Used | 0 (0.0%) | 0 (0.0%) |
| Total | 52 (100.0%) | 18 (100.0%) |
Household Vehicle Usage in Pump Back
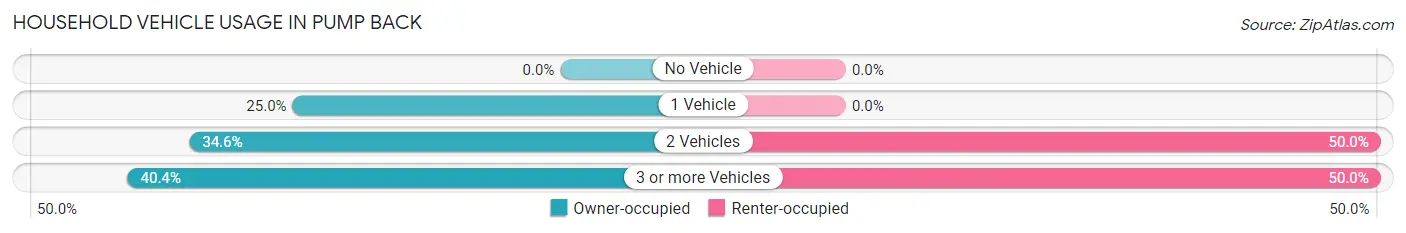
| Vehicles per Household | Owner-occupied | Renter-occupied |
| No Vehicle | 0 (0.0%) | 0 (0.0%) |
| 1 Vehicle | 13 (25.0%) | 0 (0.0%) |
| 2 Vehicles | 18 (34.6%) | 9 (50.0%) |
| 3 or more Vehicles | 21 (40.4%) | 9 (50.0%) |
| Total | 52 (100.0%) | 18 (100.0%) |
Real Estate & Mortgages in Pump Back
Real Estate and Mortgage Overview in Pump Back
| Characteristic | Without Mortgage | With Mortgage |
| Housing Units | 20 | 32 |
| Median Property Value | - | - |
| Median Household Income | - | - |
| Monthly Housing Costs | - | - |
| Real Estate Taxes | - | - |
Property Value by Mortgage Status in Pump Back
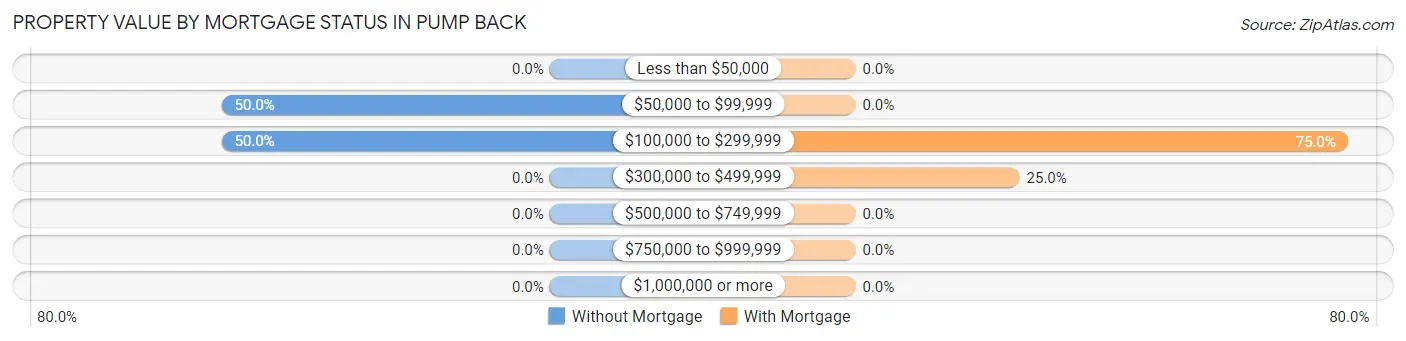
| Property Value | Without Mortgage | With Mortgage |
| Less than $50,000 | 0 (0.0%) | 0 (0.0%) |
| $50,000 to $99,999 | 10 (50.0%) | 0 (0.0%) |
| $100,000 to $299,999 | 10 (50.0%) | 24 (75.0%) |
| $300,000 to $499,999 | 0 (0.0%) | 8 (25.0%) |
| $500,000 to $749,999 | 0 (0.0%) | 0 (0.0%) |
| $750,000 to $999,999 | 0 (0.0%) | 0 (0.0%) |
| $1,000,000 or more | 0 (0.0%) | 0 (0.0%) |
| Total | 20 (100.0%) | 32 (100.0%) |
Household Income by Mortgage Status in Pump Back
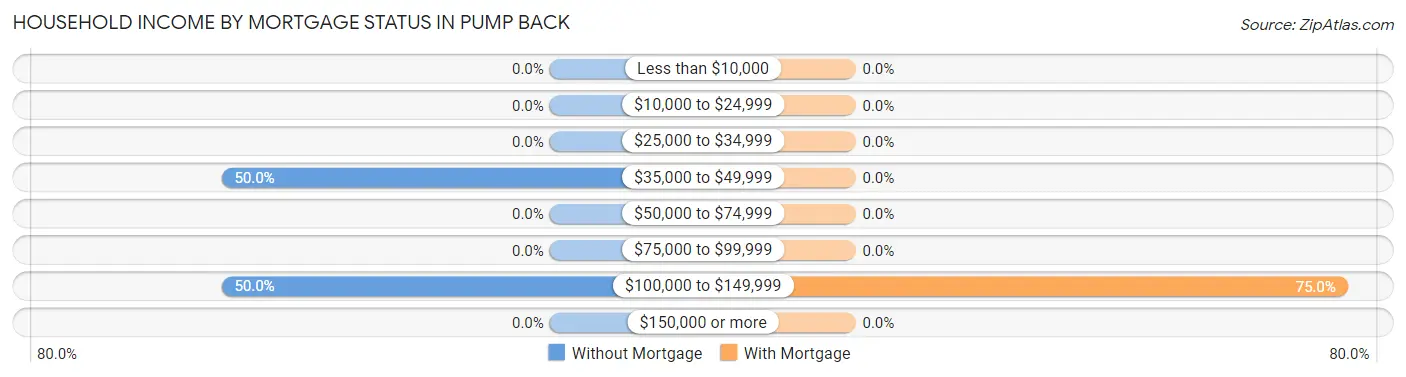
| Household Income | Without Mortgage | With Mortgage |
| Less than $10,000 | 0 (0.0%) | 0 (0.0%) |
| $10,000 to $24,999 | 0 (0.0%) | 0 (0.0%) |
| $25,000 to $34,999 | 0 (0.0%) | 0 (0.0%) |
| $35,000 to $49,999 | 10 (50.0%) | 0 (0.0%) |
| $50,000 to $74,999 | 0 (0.0%) | 0 (0.0%) |
| $75,000 to $99,999 | 0 (0.0%) | 0 (0.0%) |
| $100,000 to $149,999 | 10 (50.0%) | 24 (75.0%) |
| $150,000 or more | 0 (0.0%) | 0 (0.0%) |
| Total | 20 (100.0%) | 32 (100.0%) |
Property Value to Household Income Ratio in Pump Back
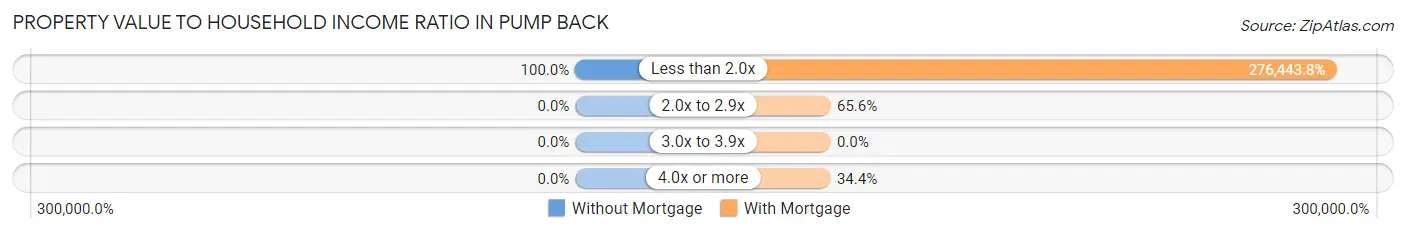
| Value-to-Income Ratio | Without Mortgage | With Mortgage |
| Less than 2.0x | 20 (100.0%) | 88,462 (276,443.8%) |
| 2.0x to 2.9x | 0 (0.0%) | 21 (65.6%) |
| 3.0x to 3.9x | 0 (0.0%) | 0 (0.0%) |
| 4.0x or more | 0 (0.0%) | 11 (34.4%) |
| Total | 20 (100.0%) | 32 (100.0%) |
Real Estate Taxes by Mortgage Status in Pump Back
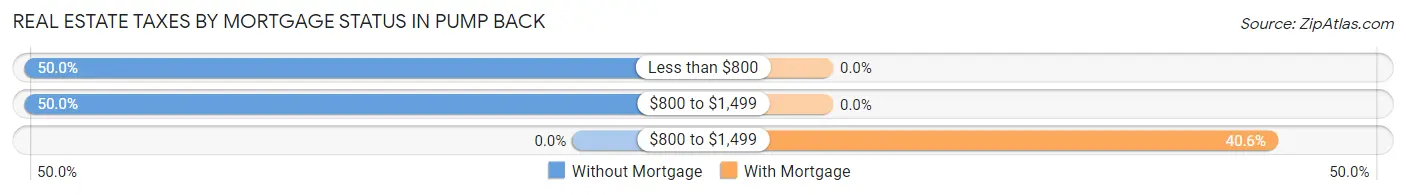
| Property Taxes | Without Mortgage | With Mortgage |
| Less than $800 | 10 (50.0%) | 0 (0.0%) |
| $800 to $1,499 | 10 (50.0%) | 0 (0.0%) |
| $800 to $1,499 | 0 (0.0%) | 13 (40.6%) |
| Total | 20 (100.0%) | 32 (100.0%) |
Health & Disability in Pump Back
Health Insurance Coverage by Age in Pump Back
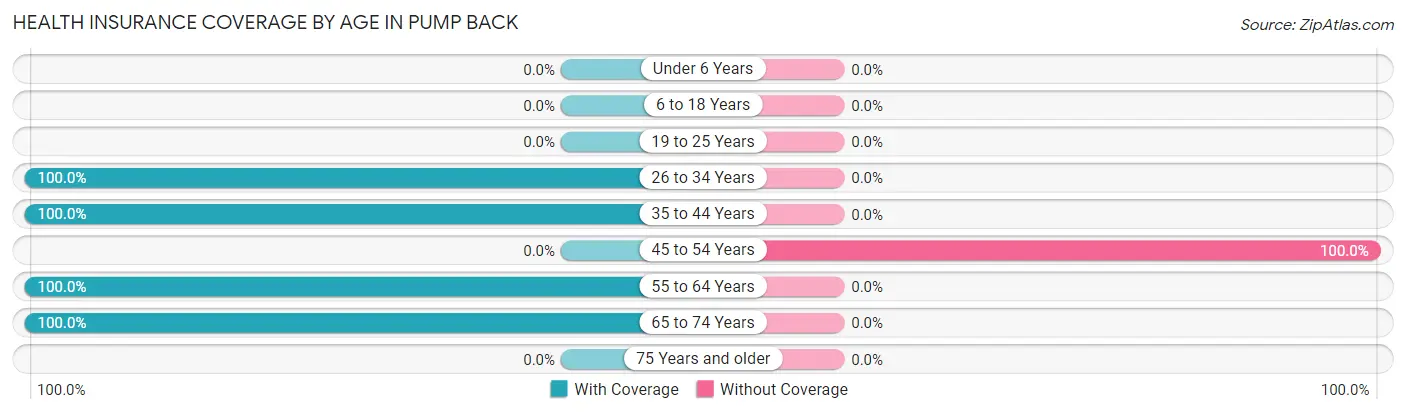
| Age Bracket | With Coverage | Without Coverage |
| Under 6 Years | 0 (0.0%) | 0 (0.0%) |
| 6 to 18 Years | 0 (0.0%) | 0 (0.0%) |
| 19 to 25 Years | 0 (0.0%) | 0 (0.0%) |
| 26 to 34 Years | 31 (100.0%) | 0 (0.0%) |
| 35 to 44 Years | 13 (100.0%) | 0 (0.0%) |
| 45 to 54 Years | 0 (0.0%) | 11 (100.0%) |
| 55 to 64 Years | 39 (100.0%) | 0 (0.0%) |
| 65 to 74 Years | 44 (100.0%) | 0 (0.0%) |
| 75 Years and older | 0 (0.0%) | 0 (0.0%) |
| Total | 127 (92.0%) | 11 (8.0%) |
Health Insurance Coverage by Citizenship Status in Pump Back
| Citizenship Status | With Coverage | Without Coverage |
| Native Born | 0 (0.0%) | 0 (0.0%) |
| Foreign Born, Citizen | 0 (0.0%) | 0 (0.0%) |
| Foreign Born, not a Citizen | 0 (0.0%) | 0 (0.0%) |
Health Insurance Coverage by Household Income in Pump Back
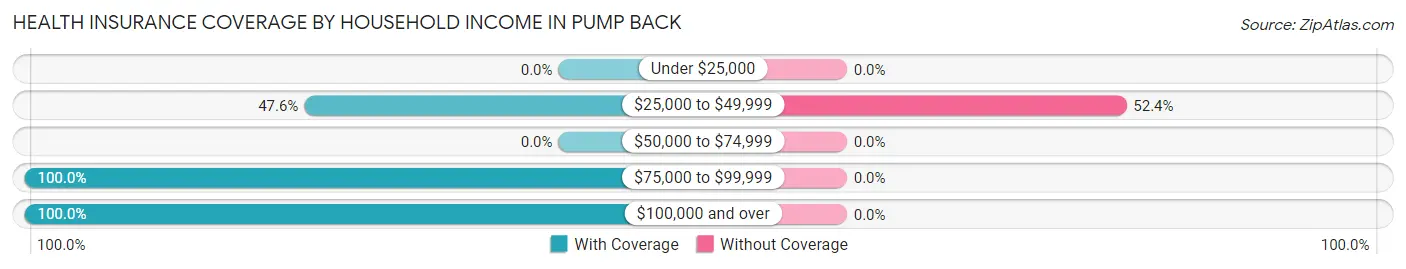
| Household Income | With Coverage | Without Coverage |
| Under $25,000 | 0 (0.0%) | 0 (0.0%) |
| $25,000 to $49,999 | 10 (47.6%) | 11 (52.4%) |
| $50,000 to $74,999 | 0 (0.0%) | 0 (0.0%) |
| $75,000 to $99,999 | 31 (100.0%) | 0 (0.0%) |
| $100,000 and over | 86 (100.0%) | 0 (0.0%) |
Public vs Private Health Insurance Coverage by Age in Pump Back
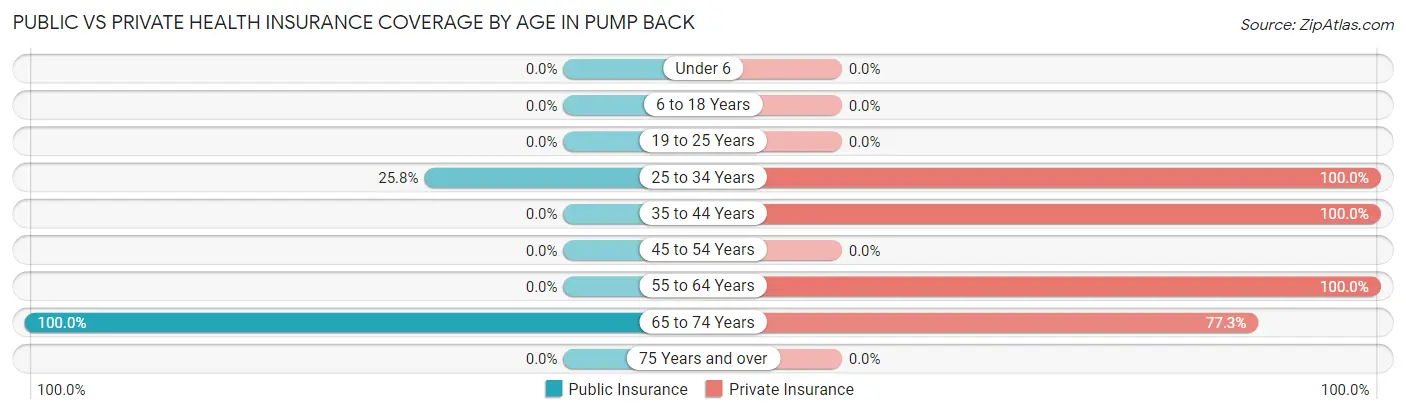
| Age Bracket | Public Insurance | Private Insurance |
| Under 6 | 0 (0.0%) | 0 (0.0%) |
| 6 to 18 Years | 0 (0.0%) | 0 (0.0%) |
| 19 to 25 Years | 0 (0.0%) | 0 (0.0%) |
| 25 to 34 Years | 8 (25.8%) | 31 (100.0%) |
| 35 to 44 Years | 0 (0.0%) | 13 (100.0%) |
| 45 to 54 Years | 0 (0.0%) | 0 (0.0%) |
| 55 to 64 Years | 0 (0.0%) | 39 (100.0%) |
| 65 to 74 Years | 44 (100.0%) | 34 (77.3%) |
| 75 Years and over | 0 (0.0%) | 0 (0.0%) |
| Total | 52 (37.7%) | 117 (84.8%) |
Disability Status by Sex by Age in Pump Back
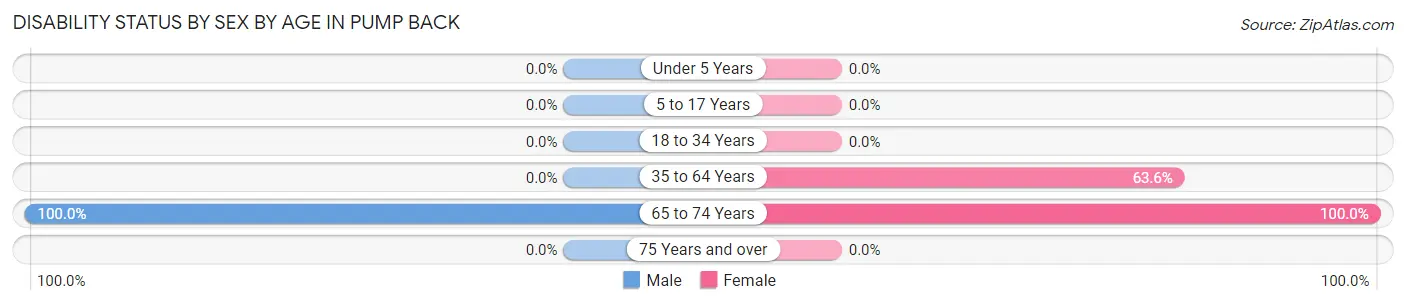
| Age Bracket | Male | Female |
| Under 5 Years | 0 (0.0%) | 0 (0.0%) |
| 5 to 17 Years | 0 (0.0%) | 0 (0.0%) |
| 18 to 34 Years | 0 (0.0%) | 0 (0.0%) |
| 35 to 64 Years | 0 (0.0%) | 14 (63.6%) |
| 65 to 74 Years | 24 (100.0%) | 20 (100.0%) |
| 75 Years and over | 0 (0.0%) | 0 (0.0%) |
Disability Class by Sex by Age in Pump Back
Disability Class: Hearing Difficulty
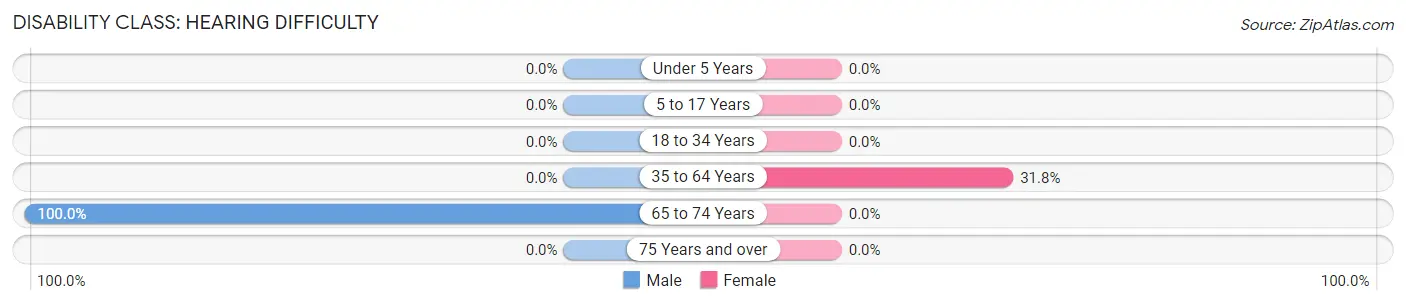
| Age Bracket | Male | Female |
| Under 5 Years | 0 (0.0%) | 0 (0.0%) |
| 5 to 17 Years | 0 (0.0%) | 0 (0.0%) |
| 18 to 34 Years | 0 (0.0%) | 0 (0.0%) |
| 35 to 64 Years | 0 (0.0%) | 7 (31.8%) |
| 65 to 74 Years | 24 (100.0%) | 0 (0.0%) |
| 75 Years and over | 0 (0.0%) | 0 (0.0%) |
Disability Class: Vision Difficulty
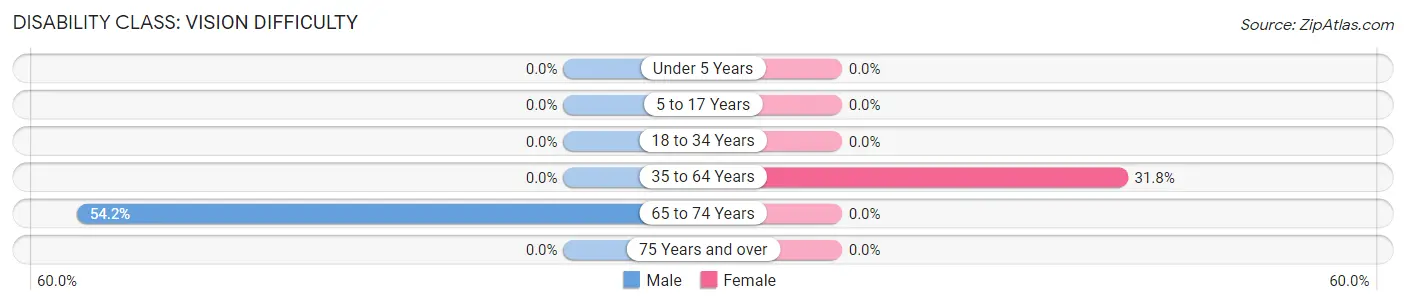
| Age Bracket | Male | Female |
| Under 5 Years | 0 (0.0%) | 0 (0.0%) |
| 5 to 17 Years | 0 (0.0%) | 0 (0.0%) |
| 18 to 34 Years | 0 (0.0%) | 0 (0.0%) |
| 35 to 64 Years | 0 (0.0%) | 7 (31.8%) |
| 65 to 74 Years | 13 (54.2%) | 0 (0.0%) |
| 75 Years and over | 0 (0.0%) | 0 (0.0%) |
Disability Class: Cognitive Difficulty
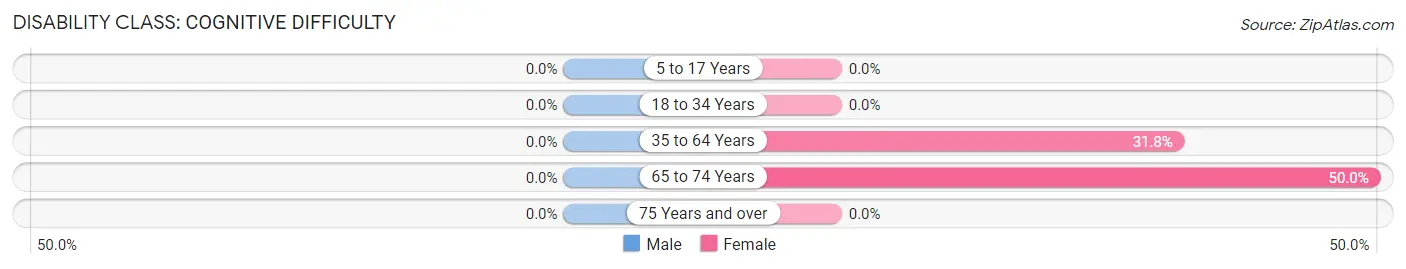
| Age Bracket | Male | Female |
| 5 to 17 Years | 0 (0.0%) | 0 (0.0%) |
| 18 to 34 Years | 0 (0.0%) | 0 (0.0%) |
| 35 to 64 Years | 0 (0.0%) | 7 (31.8%) |
| 65 to 74 Years | 0 (0.0%) | 10 (50.0%) |
| 75 Years and over | 0 (0.0%) | 0 (0.0%) |
Disability Class: Ambulatory Difficulty
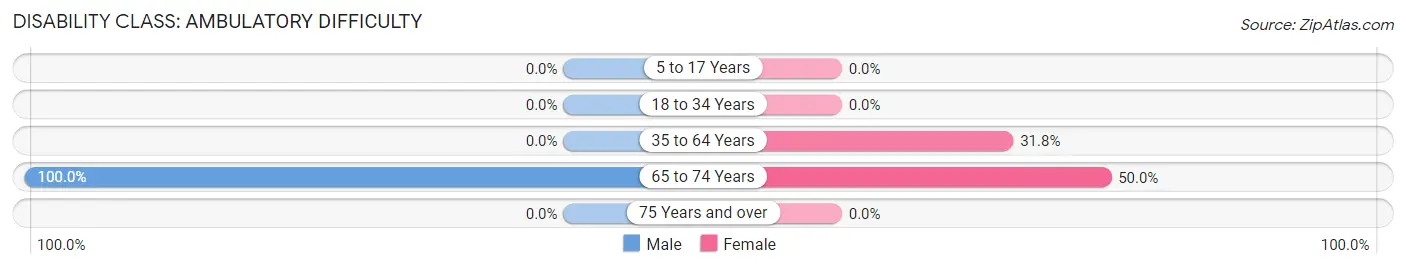
| Age Bracket | Male | Female |
| 5 to 17 Years | 0 (0.0%) | 0 (0.0%) |
| 18 to 34 Years | 0 (0.0%) | 0 (0.0%) |
| 35 to 64 Years | 0 (0.0%) | 7 (31.8%) |
| 65 to 74 Years | 24 (100.0%) | 10 (50.0%) |
| 75 Years and over | 0 (0.0%) | 0 (0.0%) |
Disability Class: Self-Care Difficulty
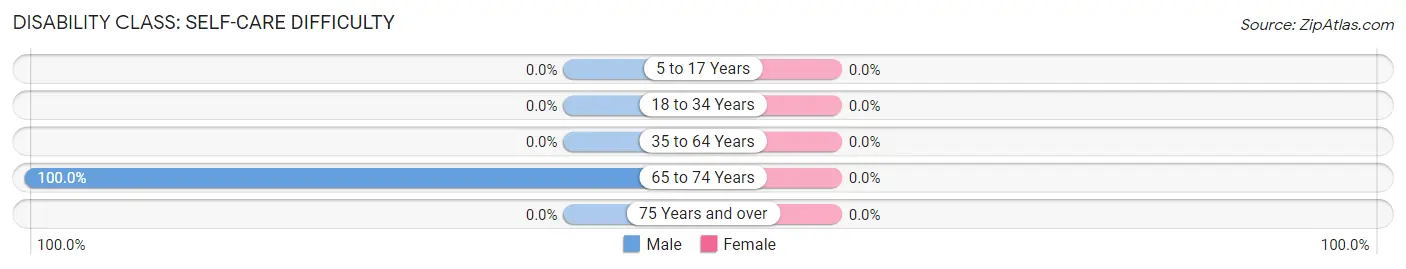
| Age Bracket | Male | Female |
| 5 to 17 Years | 0 (0.0%) | 0 (0.0%) |
| 18 to 34 Years | 0 (0.0%) | 0 (0.0%) |
| 35 to 64 Years | 0 (0.0%) | 0 (0.0%) |
| 65 to 74 Years | 24 (100.0%) | 0 (0.0%) |
| 75 Years and over | 0 (0.0%) | 0 (0.0%) |
Technology Access in Pump Back
Computing Device Access in Pump Back
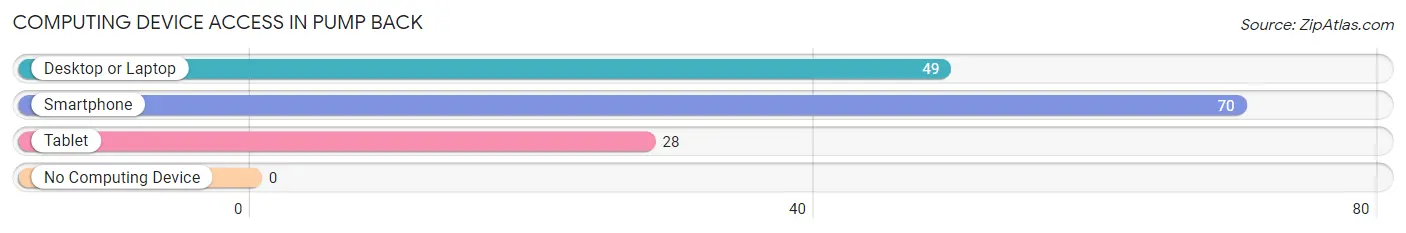
| Device Type | # Households | % Households |
| Desktop or Laptop | 49 | 70.0% |
| Smartphone | 70 | 100.0% |
| Tablet | 28 | 40.0% |
| No Computing Device | 0 | 0.0% |
| Total | 70 | 100.0% |
Internet Access in Pump Back
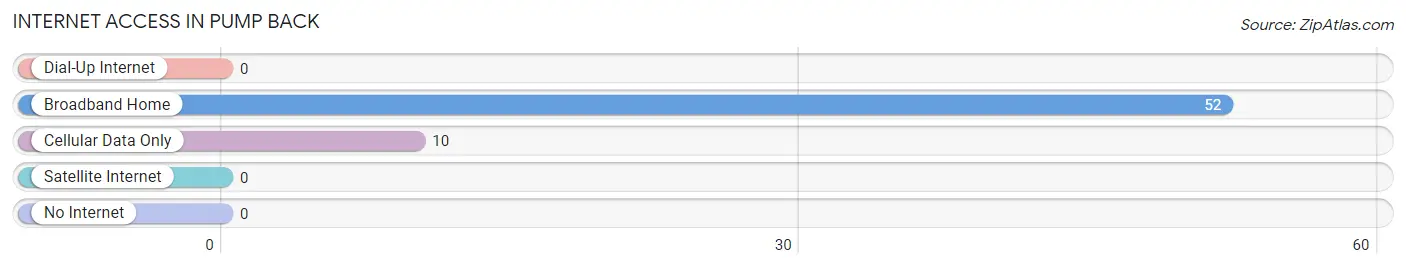
| Internet Type | # Households | % Households |
| Dial-Up Internet | 0 | 0.0% |
| Broadband Home | 52 | 74.3% |
| Cellular Data Only | 10 | 14.3% |
| Satellite Internet | 0 | 0.0% |
| No Internet | 0 | 0.0% |
| Total | 70 | 100.0% |
Pump Back Summary
Back, Oklahoma is a small town located in the southeastern corner of Oklahoma, in the Choctaw Nation. It is situated in the foothills of the Ouachita Mountains, and is part of the larger Pushmataha County. The town has a population of just over 500 people, and is known for its rural charm and friendly atmosphere.
History
Back, Oklahoma was founded in the late 1800s by a group of settlers from the Choctaw Nation. The town was originally known as “Back’s Settlement”, named after the first settler, William Back. The town was officially incorporated in 1902, and the name was changed to Back, Oklahoma.
The town was a small farming community for many years, and the main crops grown were cotton, corn, and hay. In the early 1900s, the town began to grow and develop, and a post office was established in 1906. The town also had a school, a church, and a general store.
In the 1920s, the town began to experience a period of growth and prosperity. The population increased, and new businesses began to open. The town also had a movie theater, a bank, and a hotel.
Geography
Back, Oklahoma is located in the southeastern corner of Oklahoma, in the Choctaw Nation. It is situated in the foothills of the Ouachita Mountains, and is part of the larger Pushmataha County. The town is located about 25 miles from the nearest major city, McAlester.
The town is surrounded by rolling hills and lush forests, and is home to a variety of wildlife. The town is also located near several lakes, including Lake Eufaula and Lake Texoma.
Economy
Back, Oklahoma is a small, rural town, and the economy is largely based on agriculture. The main crops grown in the area are cotton, corn, and hay. The town also has a few small businesses, including a general store, a bank, and a hotel.
The town is also home to a few manufacturing companies, including a furniture factory and a metal fabrication plant. The town also has a few restaurants and bars, as well as a movie theater.
Demographics
As of the 2010 census, the population of Back, Oklahoma was 514 people. The racial makeup of the town was 95.3% White, 0.6% African American, 0.4% Native American, 0.2% Asian, and 3.5% from other races. The median household income was $30,000, and the median age was 40 years.
Conclusion
Back, Oklahoma is a small, rural town located in the southeastern corner of Oklahoma, in the Choctaw Nation. The town has a population of just over 500 people, and is known for its rural charm and friendly atmosphere. The economy is largely based on agriculture, and the town also has a few small businesses. The town is also home to a variety of wildlife, and is surrounded by rolling hills and lush forests.
Common Questions
What is Per Capita Income in Pump Back?
Per Capita income in Pump Back is $54,757.
What is the Median Family Income in Pump Back?
Median Family Income in Pump Back is $113,250.
What is the Median Household income in Pump Back?
Median Household Income in Pump Back is $105,278.
What is Inequality or Gini Index in Pump Back?
Inequality or Gini Index in Pump Back is 0.21.
What is the Total Population of Pump Back?
Total Population of Pump Back is 138.
What is the Total Male Population of Pump Back?
Total Male Population of Pump Back is 88.
What is the Total Female Population of Pump Back?
Total Female Population of Pump Back is 50.
What is the Ratio of Males per 100 Females in Pump Back?
There are 176.00 Males per 100 Females in Pump Back.
What is the Ratio of Females per 100 Males in Pump Back?
There are 56.82 Females per 100 Males in Pump Back.
What is the Median Population Age in Pump Back?
Median Population Age in Pump Back is 61.4 Years.
What is the Average Family Size in Pump Back
Average Family Size in Pump Back is 2.2 People.
What is the Average Household Size in Pump Back
Average Household Size in Pump Back is 2.0 People.
How Large is the Labor Force in Pump Back?
There are 86 People in the Labor Forcein in Pump Back.
What is the Percentage of People in the Labor Force in Pump Back?
62.3% of People are in the Labor Force in Pump Back.