Tyrone, OK Map & Demographics
Tyrone Map
Tyrone Overview
$16,488
PER CAPITA INCOME
$2,499
AVG FAMILY INCOME
43.2%
WAGE / INCOME GAP [ % ]
56.8¢/ $1
WAGE / INCOME GAP [ $ ]
0.63
INEQUALITY / GINI INDEX
1,082
TOTAL POPULATION
600
MALE POPULATION
482
FEMALE POPULATION
124.48
MALES / 100 FEMALES
80.33
FEMALES / 100 MALES
26.9
MEDIAN AGE
3.5
AVG FAMILY SIZE
3.6
AVG HOUSEHOLD SIZE
240
LABOR FORCE [ PEOPLE ]
32.6%
PERCENT IN LABOR FORCE
Tyrone Zip Codes
Tyrone Area Codes
Income in Tyrone
Income Overview in Tyrone
| Characteristic | Number | Measure |
| Per Capita Income | 1,082 | $16,488 |
| Median Family Income | 258 | $2,499 |
| Mean Family Income | 258 | $37,532 |
| Median Household Income | 301 | $0 |
| Mean Household Income | 301 | $39,125 |
| Income Deficit | 258 | $0 |
| Wage / Income Gap (%) | 1,082 | 43.20% |
| Wage / Income Gap ($) | 1,082 | 56.80¢ per $1 |
| Gini / Inequality Index | 1,082 | 0.63 |
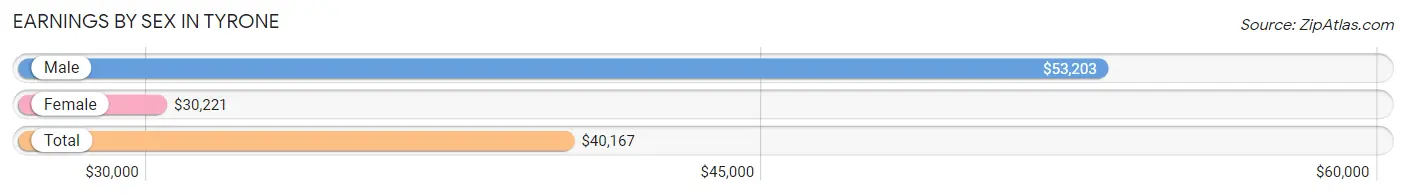
Earnings by Sex in Tyrone
Average Earnings in Tyrone are $40,167, $53,203 for men and $30,221 for women, a difference of 43.2%.
| Sex | Number | Average Earnings |
| Male | 135 (55.8%) | $53,203 |
| Female | 107 (44.2%) | $30,221 |
| Total | 242 (100.0%) | $40,167 |
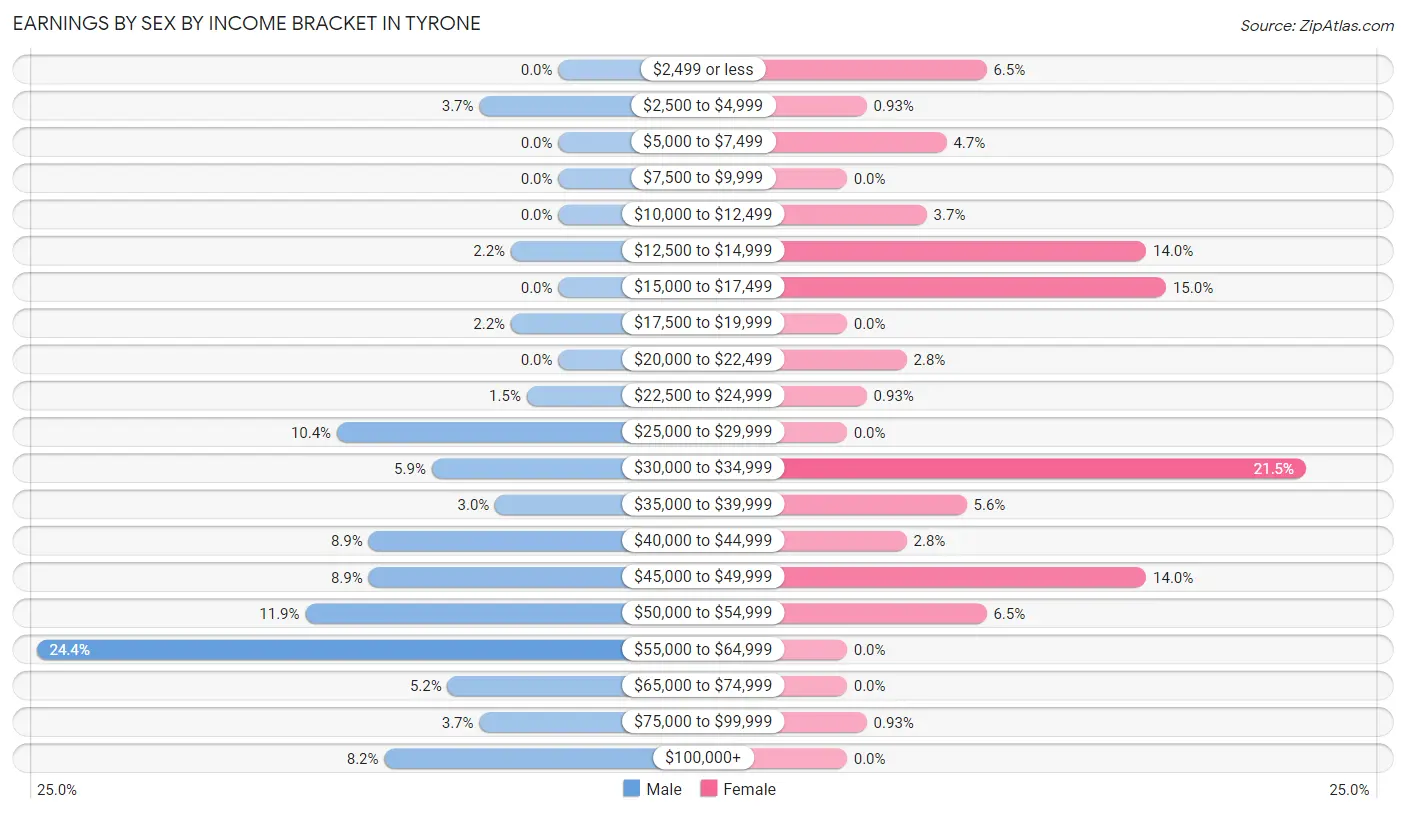
Earnings by Sex by Income Bracket in Tyrone
The most common earnings brackets in Tyrone are $55,000 to $64,999 for men (33 | 24.4%) and $30,000 to $34,999 for women (23 | 21.5%).
| Income | Male | Female |
| $2,499 or less | 0 (0.0%) | 7 (6.5%) |
| $2,500 to $4,999 | 5 (3.7%) | 1 (0.9%) |
| $5,000 to $7,499 | 0 (0.0%) | 5 (4.7%) |
| $7,500 to $9,999 | 0 (0.0%) | 0 (0.0%) |
| $10,000 to $12,499 | 0 (0.0%) | 4 (3.7%) |
| $12,500 to $14,999 | 3 (2.2%) | 15 (14.0%) |
| $15,000 to $17,499 | 0 (0.0%) | 16 (14.9%) |
| $17,500 to $19,999 | 3 (2.2%) | 0 (0.0%) |
| $20,000 to $22,499 | 0 (0.0%) | 3 (2.8%) |
| $22,500 to $24,999 | 2 (1.5%) | 1 (0.9%) |
| $25,000 to $29,999 | 14 (10.4%) | 0 (0.0%) |
| $30,000 to $34,999 | 8 (5.9%) | 23 (21.5%) |
| $35,000 to $39,999 | 4 (3.0%) | 6 (5.6%) |
| $40,000 to $44,999 | 12 (8.9%) | 3 (2.8%) |
| $45,000 to $49,999 | 12 (8.9%) | 15 (14.0%) |
| $50,000 to $54,999 | 16 (11.8%) | 7 (6.5%) |
| $55,000 to $64,999 | 33 (24.4%) | 0 (0.0%) |
| $65,000 to $74,999 | 7 (5.2%) | 0 (0.0%) |
| $75,000 to $99,999 | 5 (3.7%) | 1 (0.9%) |
| $100,000+ | 11 (8.2%) | 0 (0.0%) |
| Total | 135 (100.0%) | 107 (100.0%) |
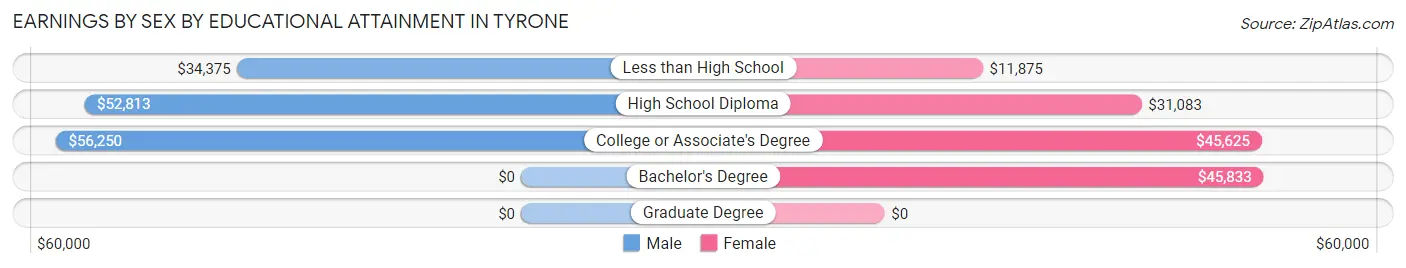
Earnings by Sex by Educational Attainment in Tyrone
Average earnings in Tyrone are $53,359 for men and $30,956 for women, a difference of 42.0%. Men with an educational attainment of college or associate's degree enjoy the highest average annual earnings of $56,250, while those with less than high school education earn the least with $34,375. Women with an educational attainment of bachelor's degree earn the most with the average annual earnings of $45,833, while those with less than high school education have the smallest earnings of $11,875.
| Educational Attainment | Male Income | Female Income |
| Less than High School | $34,375 | $11,875 |
| High School Diploma | $52,813 | $31,083 |
| College or Associate's Degree | $56,250 | $45,625 |
| Bachelor's Degree | - | - |
| Graduate Degree | - | - |
| Total | $53,359 | $30,956 |
Family Income in Tyrone
Family Income Brackets in Tyrone
According to the Tyrone family income data, there are 133 families falling into the less than $10,000 income range, which is the most common income bracket and makes up 51.5% of all families.
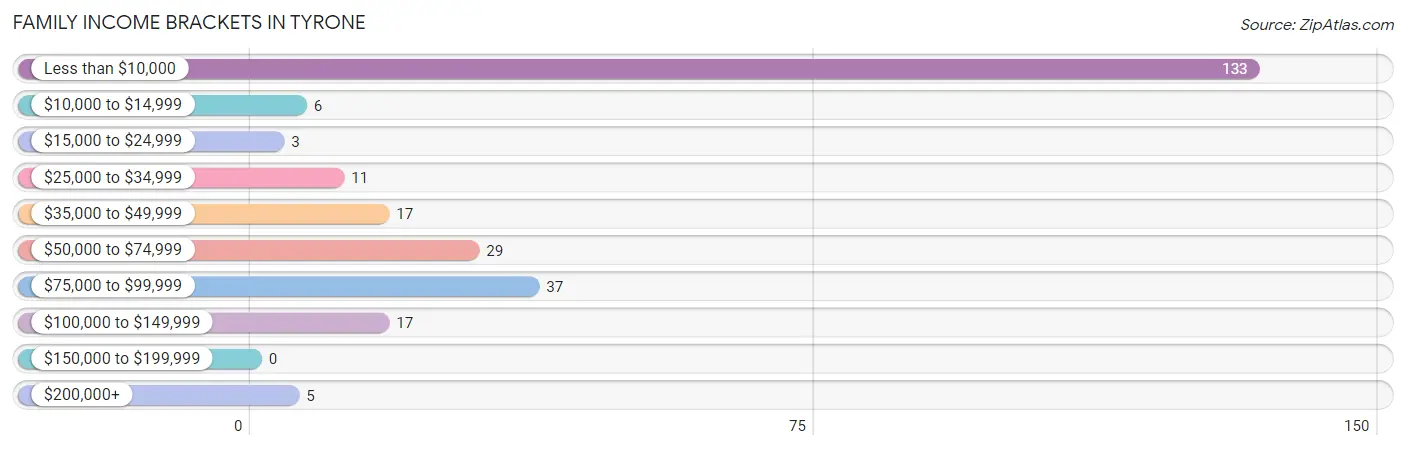
| Income Bracket | # Families | % Families |
| Less than $10,000 | 133 | 51.6% |
| $10,000 to $14,999 | 6 | 2.3% |
| $15,000 to $24,999 | 3 | 1.2% |
| $25,000 to $34,999 | 11 | 4.3% |
| $35,000 to $49,999 | 17 | 6.6% |
| $50,000 to $74,999 | 29 | 11.2% |
| $75,000 to $99,999 | 37 | 14.3% |
| $100,000 to $149,999 | 17 | 6.6% |
| $150,000 to $199,999 | 0 | 0.0% |
| $200,000+ | 5 | 1.9% |
Family Income by Famaliy Size in Tyrone
3-person families (26 | 10.1%) account for the highest median family income in Tyrone with $90,417 per family, while 2-person families (72 | 27.9%) have the highest median income of $30,714 per family member.
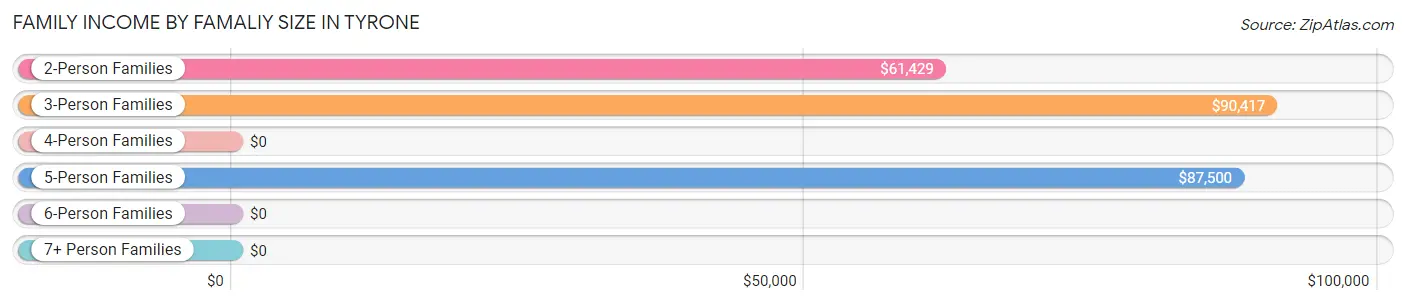
| Income Bracket | # Families | Median Income |
| 2-Person Families | 72 (27.9%) | $61,429 |
| 3-Person Families | 26 (10.1%) | $90,417 |
| 4-Person Families | 2 (0.8%) | $0 |
| 5-Person Families | 18 (7.0%) | $87,500 |
| 6-Person Families | 137 (53.1%) | $0 |
| 7+ Person Families | 3 (1.2%) | $0 |
| Total | 258 (100.0%) | $2,499 |
Family Income by Number of Earners in Tyrone
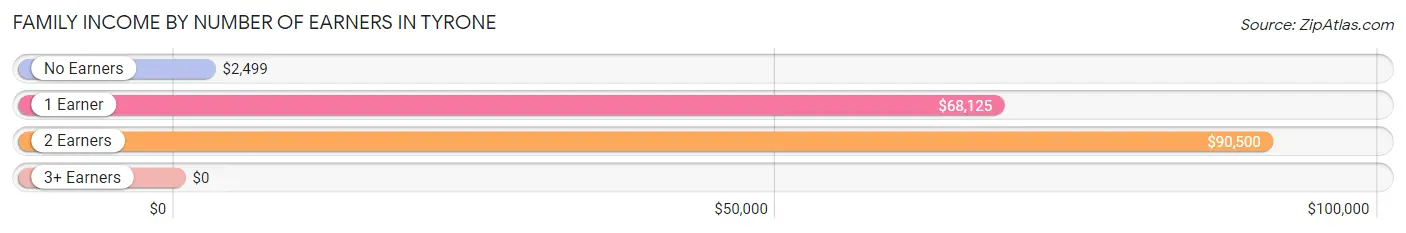
| Number of Earners | # Families | Median Income |
| No Earners | 166 (64.3%) | $2,499 |
| 1 Earner | 25 (9.7%) | $68,125 |
| 2 Earners | 60 (23.3%) | $90,500 |
| 3+ Earners | 7 (2.7%) | $0 |
| Total | 258 (100.0%) | $2,499 |
Household Income in Tyrone
Household Income Brackets in Tyrone
With 134 households falling in the category, the less than $10,000 income range is the most frequent in Tyrone, accounting for 44.5% of all households.
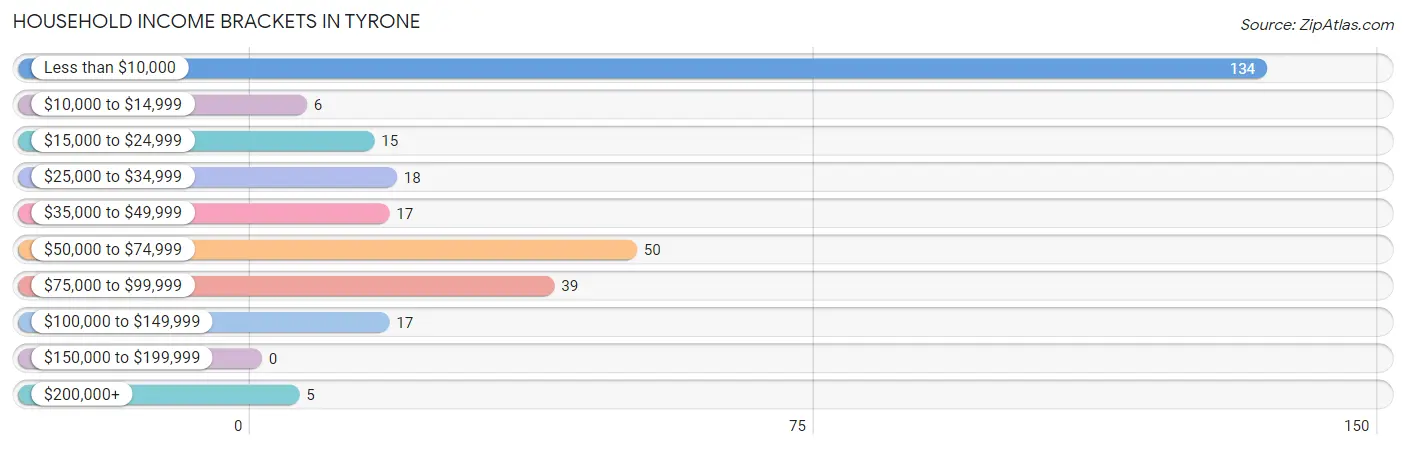
| Income Bracket | # Households | % Households |
| Less than $10,000 | 134 | 44.5% |
| $10,000 to $14,999 | 6 | 2.0% |
| $15,000 to $24,999 | 15 | 5.0% |
| $25,000 to $34,999 | 18 | 6.0% |
| $35,000 to $49,999 | 17 | 5.6% |
| $50,000 to $74,999 | 50 | 16.6% |
| $75,000 to $99,999 | 39 | 13.0% |
| $100,000 to $149,999 | 17 | 5.6% |
| $150,000 to $199,999 | 0 | 0.0% |
| $200,000+ | 5 | 1.7% |
Household Income by Householder Age in Tyrone
The median household income in Tyrone is $0, with the highest median household income of $68,750 found in the 25 to 44 years age bracket for the primary householder. A total of 38 households (12.6%) fall into this category. Meanwhile, the 15 to 24 years age bracket for the primary householder has the lowest median household income of $0, with 10 households (3.3%) in this group.
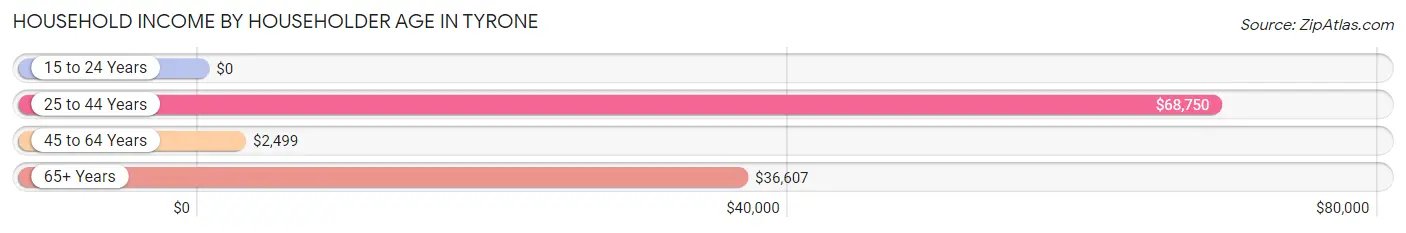
| Income Bracket | # Households | Median Income |
| 15 to 24 Years | 10 (3.3%) | $0 |
| 25 to 44 Years | 38 (12.6%) | $68,750 |
| 45 to 64 Years | 206 (68.4%) | $2,499 |
| 65+ Years | 47 (15.6%) | $36,607 |
| Total | 301 (100.0%) | $0 |
Poverty in Tyrone
Income Below Poverty by Sex and Age in Tyrone
With 60.3% poverty level for males and 34.6% for females among the residents of Tyrone, 16 and 17 year old males and 5 year old females are the most vulnerable to poverty, with 101 males (100.0%) and 3 females (100.0%) in their respective age groups living below the poverty level.
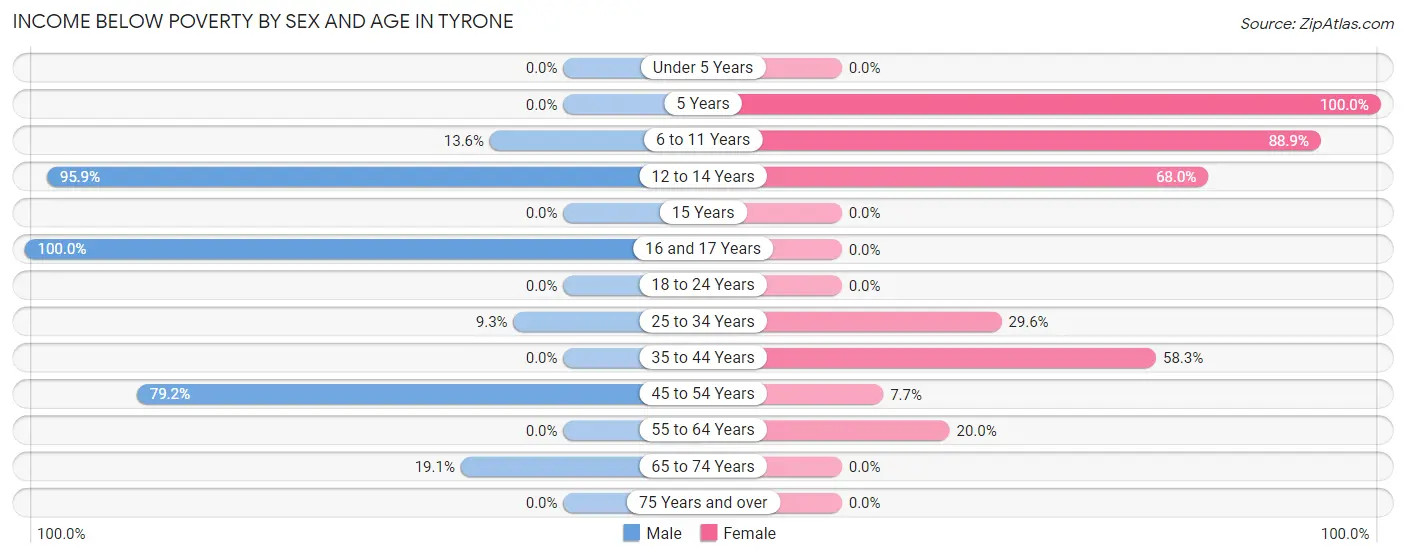
| Age Bracket | Male | Female |
| Under 5 Years | 0 (0.0%) | 0 (0.0%) |
| 5 Years | 0 (0.0%) | 3 (100.0%) |
| 6 to 11 Years | 3 (13.6%) | 64 (88.9%) |
| 12 to 14 Years | 116 (95.9%) | 51 (68.0%) |
| 15 Years | 0 (0.0%) | 0 (0.0%) |
| 16 and 17 Years | 101 (100.0%) | 0 (0.0%) |
| 18 to 24 Years | 0 (0.0%) | 0 (0.0%) |
| 25 to 34 Years | 5 (9.3%) | 8 (29.6%) |
| 35 to 44 Years | 0 (0.0%) | 28 (58.3%) |
| 45 to 54 Years | 133 (79.2%) | 1 (7.7%) |
| 55 to 64 Years | 0 (0.0%) | 12 (20.0%) |
| 65 to 74 Years | 4 (19.1%) | 0 (0.0%) |
| 75 Years and over | 0 (0.0%) | 0 (0.0%) |
| Total | 362 (60.3%) | 167 (34.6%) |
Income Above Poverty by Sex and Age in Tyrone
According to the poverty statistics in Tyrone, males aged under 5 years and females aged under 5 years are the age groups that are most secure financially, with 100.0% of males and 100.0% of females in these age groups living above the poverty line.
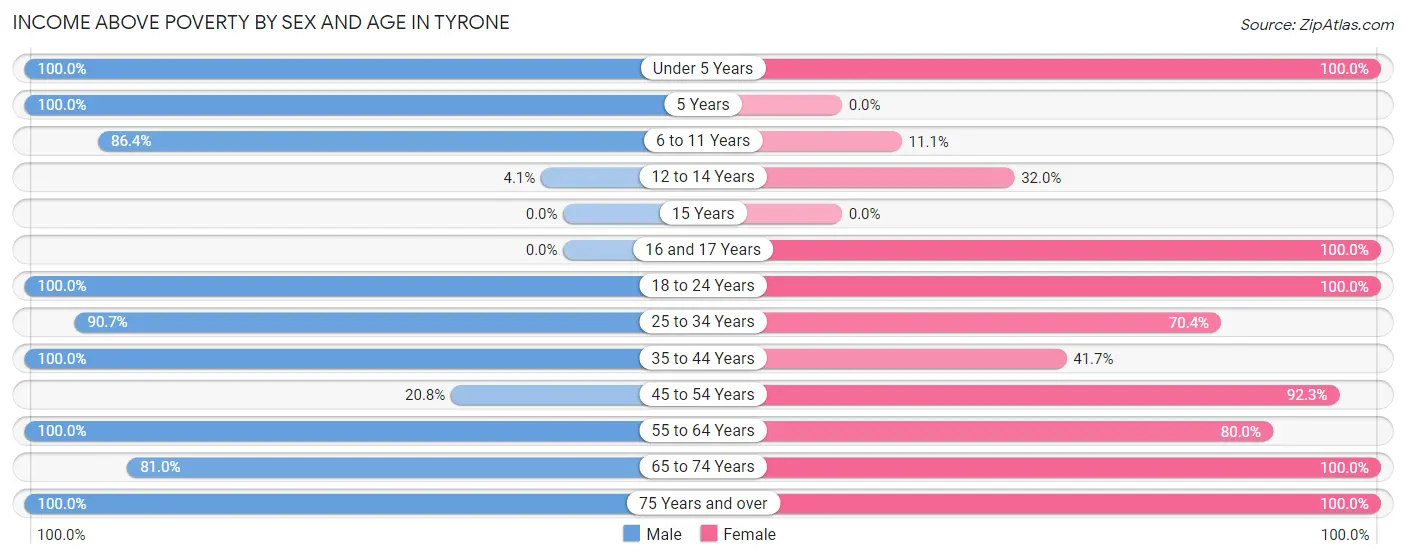
| Age Bracket | Male | Female |
| Under 5 Years | 29 (100.0%) | 12 (100.0%) |
| 5 Years | 12 (100.0%) | 0 (0.0%) |
| 6 to 11 Years | 19 (86.4%) | 8 (11.1%) |
| 12 to 14 Years | 5 (4.1%) | 24 (32.0%) |
| 15 Years | 0 (0.0%) | 0 (0.0%) |
| 16 and 17 Years | 0 (0.0%) | 3 (100.0%) |
| 18 to 24 Years | 17 (100.0%) | 48 (100.0%) |
| 25 to 34 Years | 49 (90.7%) | 19 (70.4%) |
| 35 to 44 Years | 4 (100.0%) | 20 (41.7%) |
| 45 to 54 Years | 35 (20.8%) | 12 (92.3%) |
| 55 to 64 Years | 34 (100.0%) | 48 (80.0%) |
| 65 to 74 Years | 17 (80.9%) | 108 (100.0%) |
| 75 Years and over | 17 (100.0%) | 13 (100.0%) |
| Total | 238 (39.7%) | 315 (65.3%) |
Income Below Poverty Among Married-Couple Families in Tyrone
The poverty statistics for married-couple families in Tyrone show that 55.9% or 133 of the total 238 families live below the poverty line. Families with 3 or 4 children have the highest poverty rate of 91.1%, comprising of 133 families. On the other hand, families with no children have the lowest poverty rate of 0.0%, which includes 0 families.
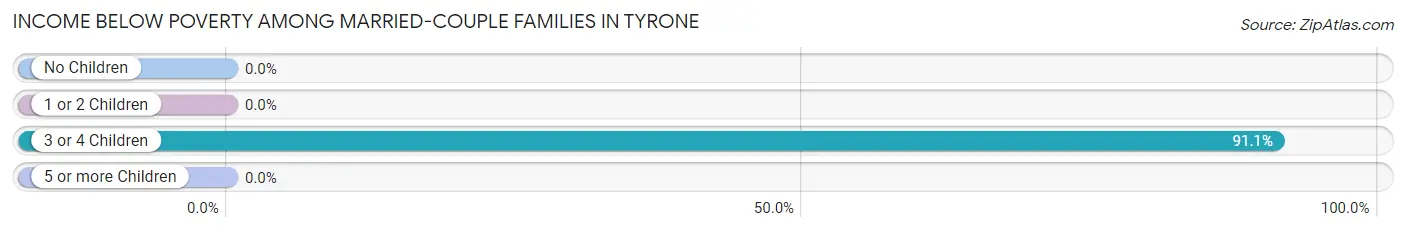
| Children | Above Poverty | Below Poverty |
| No Children | 57 (100.0%) | 0 (0.0%) |
| 1 or 2 Children | 32 (100.0%) | 0 (0.0%) |
| 3 or 4 Children | 13 (8.9%) | 133 (91.1%) |
| 5 or more Children | 3 (100.0%) | 0 (0.0%) |
| Total | 105 (44.1%) | 133 (55.9%) |
Income Below Poverty Among Single-Parent Households in Tyrone
According to the poverty data in Tyrone, 57.1% or 4 single-father households and 15.4% or 2 single-mother households are living below the poverty line. Among single-father households, those with no children have the highest poverty rate, with 4 households (100.0%) experiencing poverty. Likewise, among single-mother households, those with 3 or 4 children have the highest poverty rate, with 2 households (100.0%) falling below the poverty line.
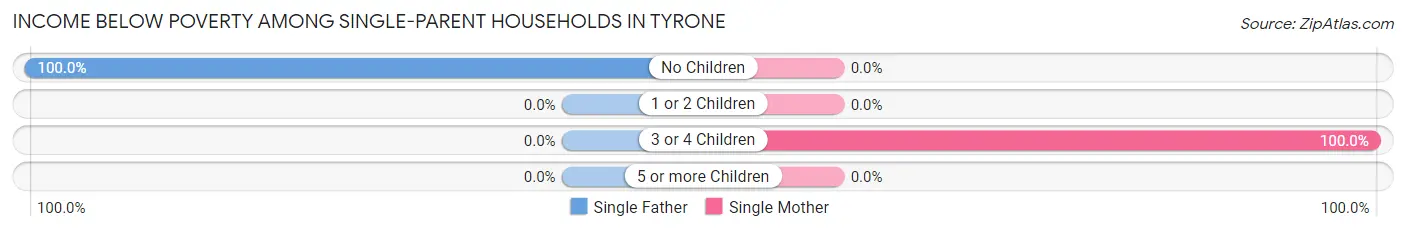
| Children | Single Father | Single Mother |
| No Children | 4 (100.0%) | 0 (0.0%) |
| 1 or 2 Children | 0 (0.0%) | 0 (0.0%) |
| 3 or 4 Children | 0 (0.0%) | 2 (100.0%) |
| 5 or more Children | 0 (0.0%) | 0 (0.0%) |
| Total | 4 (57.1%) | 2 (15.4%) |
Income Below Poverty Among Married-Couple vs Single-Parent Households in Tyrone
The poverty data for Tyrone shows that 133 of the married-couple family households (55.9%) and 6 of the single-parent households (30.0%) are living below the poverty level. Within the married-couple family households, those with 3 or 4 children have the highest poverty rate, with 133 households (91.1%) falling below the poverty line. Among the single-parent households, those with 3 or 4 children have the highest poverty rate, with 2 household (100.0%) living below poverty.
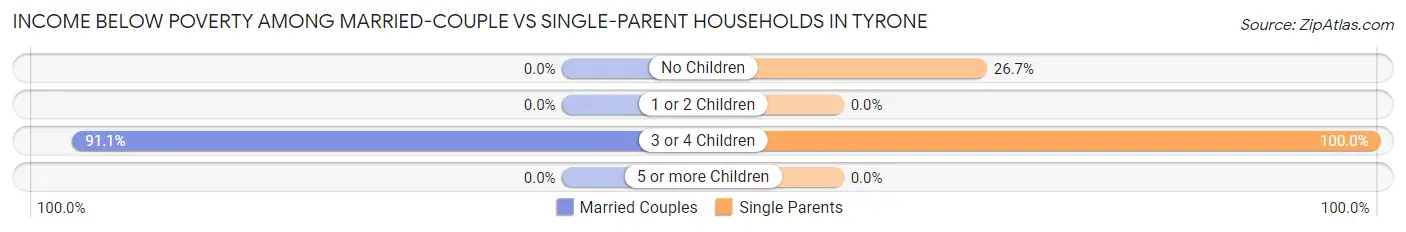
| Children | Married-Couple Families | Single-Parent Households |
| No Children | 0 (0.0%) | 4 (26.7%) |
| 1 or 2 Children | 0 (0.0%) | 0 (0.0%) |
| 3 or 4 Children | 133 (91.1%) | 2 (100.0%) |
| 5 or more Children | 0 (0.0%) | 0 (0.0%) |
| Total | 133 (55.9%) | 6 (30.0%) |
Race in Tyrone
The most populous races in Tyrone are Hispanic or Latino (693 | 64.0%), Some other Race (533 | 49.3%), and White / Caucasian (358 | 33.1%).
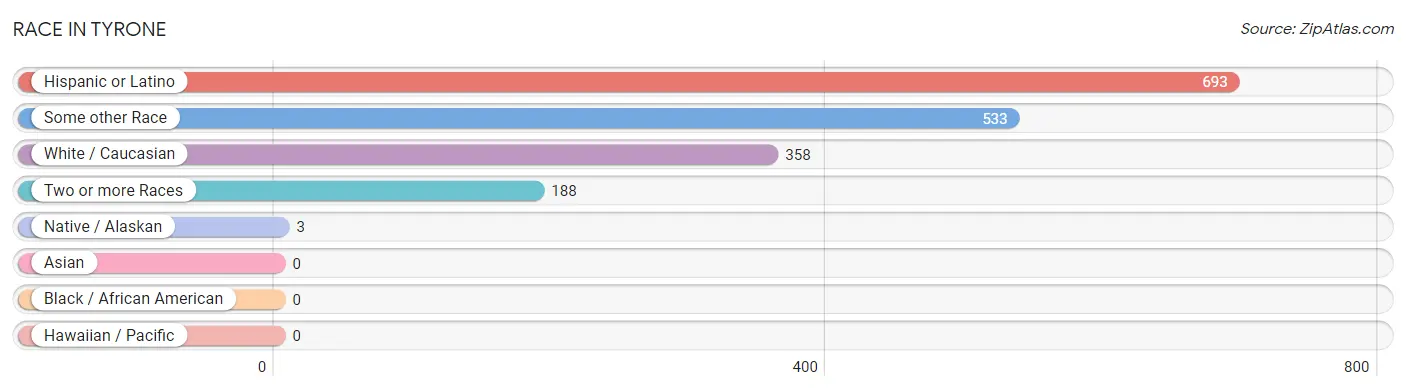
| Race | # Population | % Population |
| Asian | 0 | 0.0% |
| Black / African American | 0 | 0.0% |
| Hawaiian / Pacific | 0 | 0.0% |
| Hispanic or Latino | 693 | 64.0% |
| Native / Alaskan | 3 | 0.3% |
| White / Caucasian | 358 | 33.1% |
| Two or more Races | 188 | 17.4% |
| Some other Race | 533 | 49.3% |
| Total | 1,082 | 100.0% |
Ancestry in Tyrone
The most populous ancestries reported in Tyrone are Mexican (693 | 64.0%), German (84 | 7.8%), American (30 | 2.8%), English (19 | 1.8%), and Irish (9 | 0.8%), together accounting for 77.2% of all Tyrone residents.
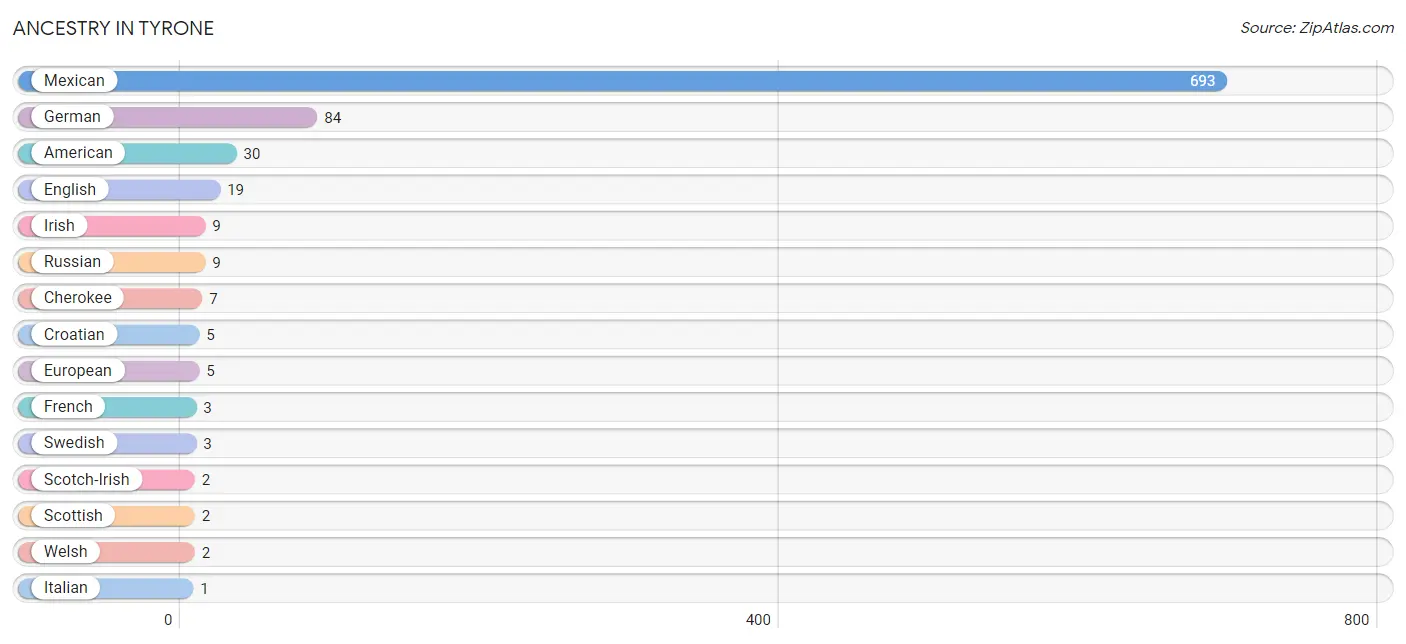
| Ancestry | # Population | % Population |
| American | 30 | 2.8% |
| Cherokee | 7 | 0.6% |
| Croatian | 5 | 0.5% |
| English | 19 | 1.8% |
| European | 5 | 0.5% |
| French | 3 | 0.3% |
| German | 84 | 7.8% |
| Irish | 9 | 0.8% |
| Italian | 1 | 0.1% |
| Mexican | 693 | 64.0% |
| Russian | 9 | 0.8% |
| Scotch-Irish | 2 | 0.2% |
| Scottish | 2 | 0.2% |
| Swedish | 3 | 0.3% |
| Welsh | 2 | 0.2% | View All 15 Rows |
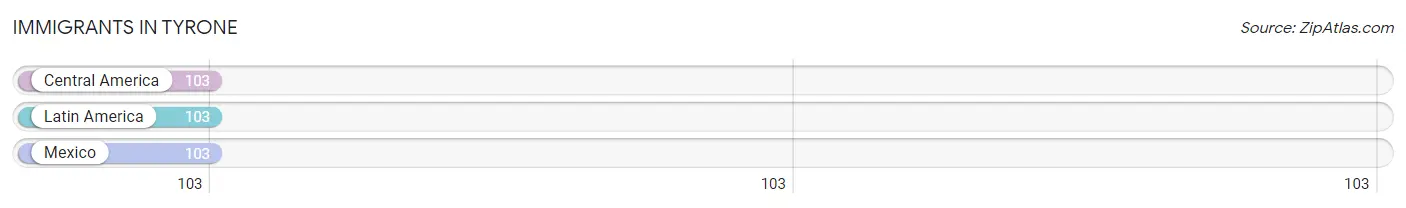
Immigrants in Tyrone
The most numerous immigrant groups reported in Tyrone came from Central America (103 | 9.5%), Latin America (103 | 9.5%), and Mexico (103 | 9.5%), together accounting for 28.6% of all Tyrone residents.
| Immigration Origin | # Population | % Population |
| Central America | 103 | 9.5% |
| Latin America | 103 | 9.5% |
| Mexico | 103 | 9.5% | View All 3 Rows |
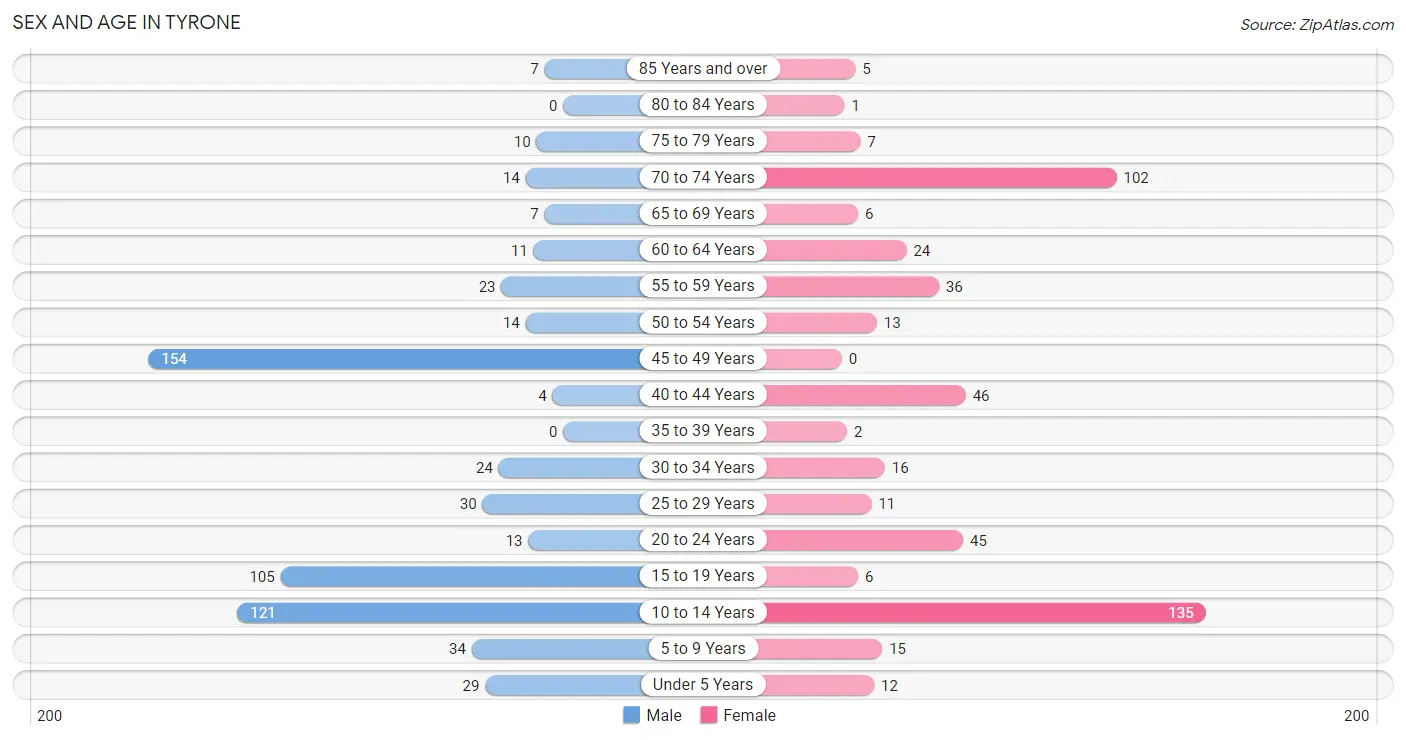
Sex and Age in Tyrone
Sex and Age in Tyrone
The most populous age groups in Tyrone are 45 to 49 Years (154 | 25.7%) for men and 10 to 14 Years (135 | 28.0%) for women.
| Age Bracket | Male | Female |
| Under 5 Years | 29 (4.8%) | 12 (2.5%) |
| 5 to 9 Years | 34 (5.7%) | 15 (3.1%) |
| 10 to 14 Years | 121 (20.2%) | 135 (28.0%) |
| 15 to 19 Years | 105 (17.5%) | 6 (1.2%) |
| 20 to 24 Years | 13 (2.2%) | 45 (9.3%) |
| 25 to 29 Years | 30 (5.0%) | 11 (2.3%) |
| 30 to 34 Years | 24 (4.0%) | 16 (3.3%) |
| 35 to 39 Years | 0 (0.0%) | 2 (0.4%) |
| 40 to 44 Years | 4 (0.7%) | 46 (9.5%) |
| 45 to 49 Years | 154 (25.7%) | 0 (0.0%) |
| 50 to 54 Years | 14 (2.3%) | 13 (2.7%) |
| 55 to 59 Years | 23 (3.8%) | 36 (7.5%) |
| 60 to 64 Years | 11 (1.8%) | 24 (5.0%) |
| 65 to 69 Years | 7 (1.2%) | 6 (1.2%) |
| 70 to 74 Years | 14 (2.3%) | 102 (21.2%) |
| 75 to 79 Years | 10 (1.7%) | 7 (1.5%) |
| 80 to 84 Years | 0 (0.0%) | 1 (0.2%) |
| 85 Years and over | 7 (1.2%) | 5 (1.0%) |
| Total | 600 (100.0%) | 482 (100.0%) |
Families and Households in Tyrone
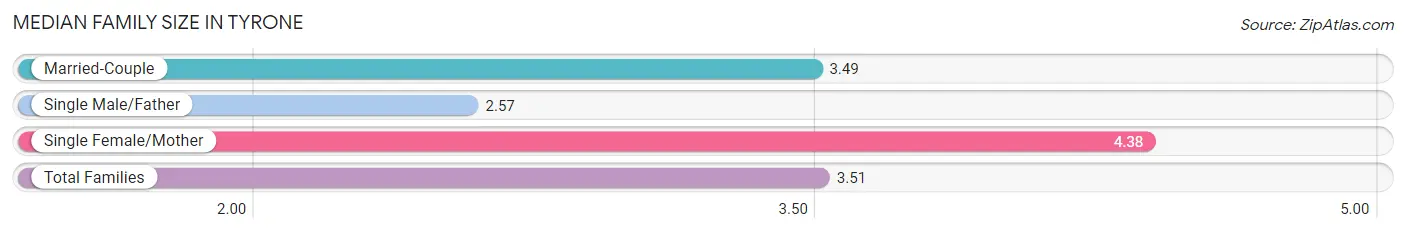
Median Family Size in Tyrone
The median family size in Tyrone is 3.51 persons per family, with single female/mother families (13 | 5.0%) accounting for the largest median family size of 4.38 persons per family. On the other hand, single male/father families (7 | 2.7%) represent the smallest median family size with 2.57 persons per family.
| Family Type | # Families | Family Size |
| Married-Couple | 238 (92.2%) | 3.49 |
| Single Male/Father | 7 (2.7%) | 2.57 |
| Single Female/Mother | 13 (5.0%) | 4.38 |
| Total Families | 258 (100.0%) | 3.51 |
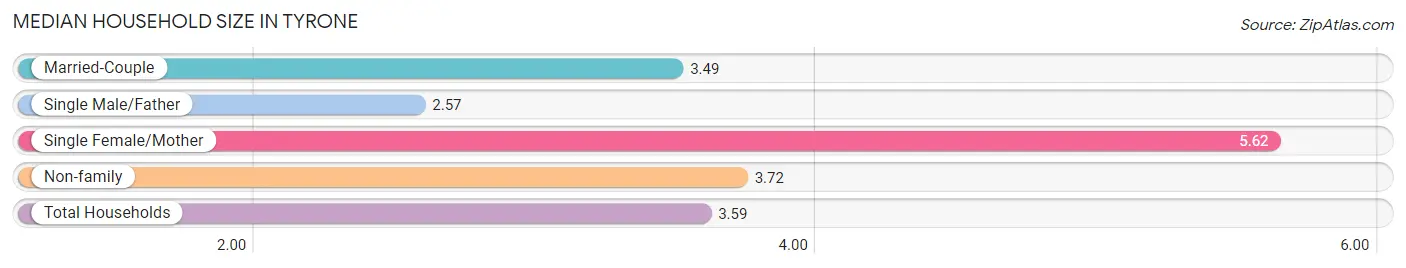
Median Household Size in Tyrone
The median household size in Tyrone is 3.59 persons per household, with single female/mother households (13 | 4.3%) accounting for the largest median household size of 5.62 persons per household. single male/father households (7 | 2.3%) represent the smallest median household size with 2.57 persons per household.
| Household Type | # Households | Household Size |
| Married-Couple | 238 (79.1%) | 3.49 |
| Single Male/Father | 7 (2.3%) | 2.57 |
| Single Female/Mother | 13 (4.3%) | 5.62 |
| Non-family | 43 (14.3%) | 3.72 |
| Total Households | 301 (100.0%) | 3.59 |
Household Size by Marriage Status in Tyrone
Out of a total of 301 households in Tyrone, 258 (85.7%) are family households, while 43 (14.3%) are nonfamily households. The most numerous type of family households are 6-person households, comprising 137, and the most common type of nonfamily households are 2-person households, comprising 23.
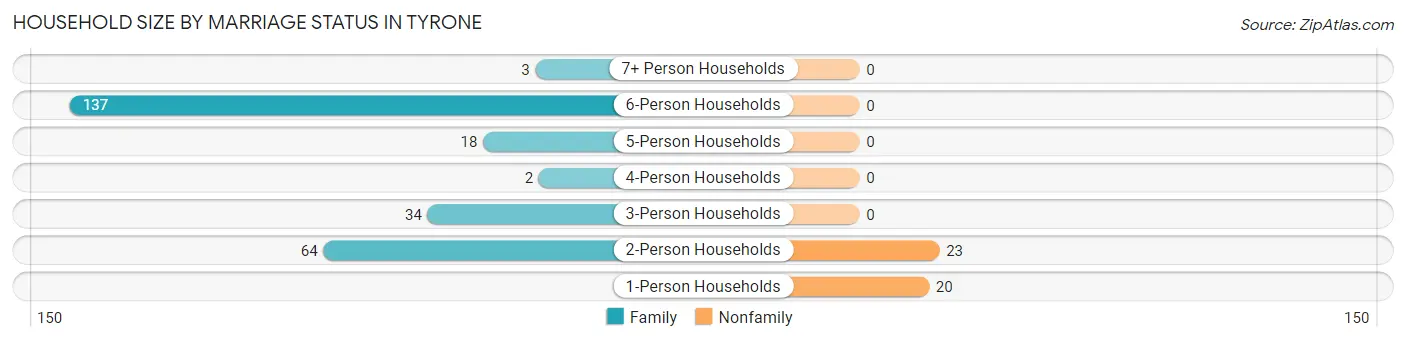
| Household Size | Family Households | Nonfamily Households |
| 1-Person Households | - | 20 (6.6%) |
| 2-Person Households | 64 (21.3%) | 23 (7.6%) |
| 3-Person Households | 34 (11.3%) | 0 (0.0%) |
| 4-Person Households | 2 (0.7%) | 0 (0.0%) |
| 5-Person Households | 18 (6.0%) | 0 (0.0%) |
| 6-Person Households | 137 (45.5%) | 0 (0.0%) |
| 7+ Person Households | 3 (1.0%) | 0 (0.0%) |
| Total | 258 (85.7%) | 43 (14.3%) |
Female Fertility in Tyrone
Fertility by Age in Tyrone
Average fertility rate in Tyrone is 68.0 births per 1,000 women. Women in the age bracket of 20 to 34 years have the highest fertility rate with 125.0 births per 1,000 women. Women in the age bracket of 20 to 34 years acount for 100.0% of all women with births.
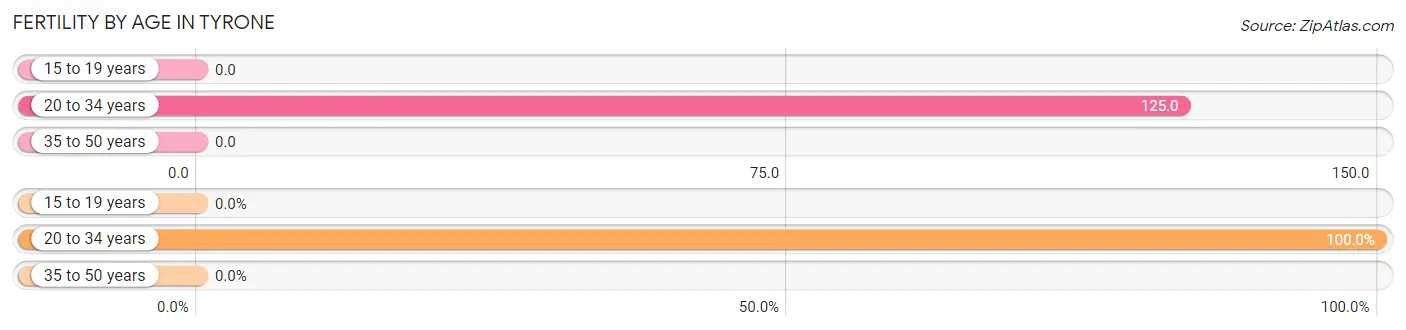
| Age Bracket | Women with Births | Births / 1,000 Women |
| 15 to 19 years | 0 (0.0%) | 0.0 |
| 20 to 34 years | 9 (100.0%) | 125.0 |
| 35 to 50 years | 0 (0.0%) | 0.0 |
| Total | 9 (100.0%) | 68.0 |
Fertility by Age by Marriage Status in Tyrone
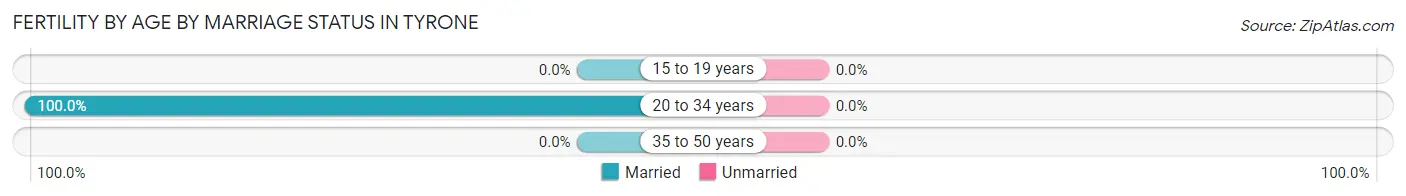
| Age Bracket | Married | Unmarried |
| 15 to 19 years | 0 (0.0%) | 0 (0.0%) |
| 20 to 34 years | 9 (100.0%) | 0 (0.0%) |
| 35 to 50 years | 0 (0.0%) | 0 (0.0%) |
| Total | 9 (100.0%) | 0 (0.0%) |
Fertility by Education in Tyrone
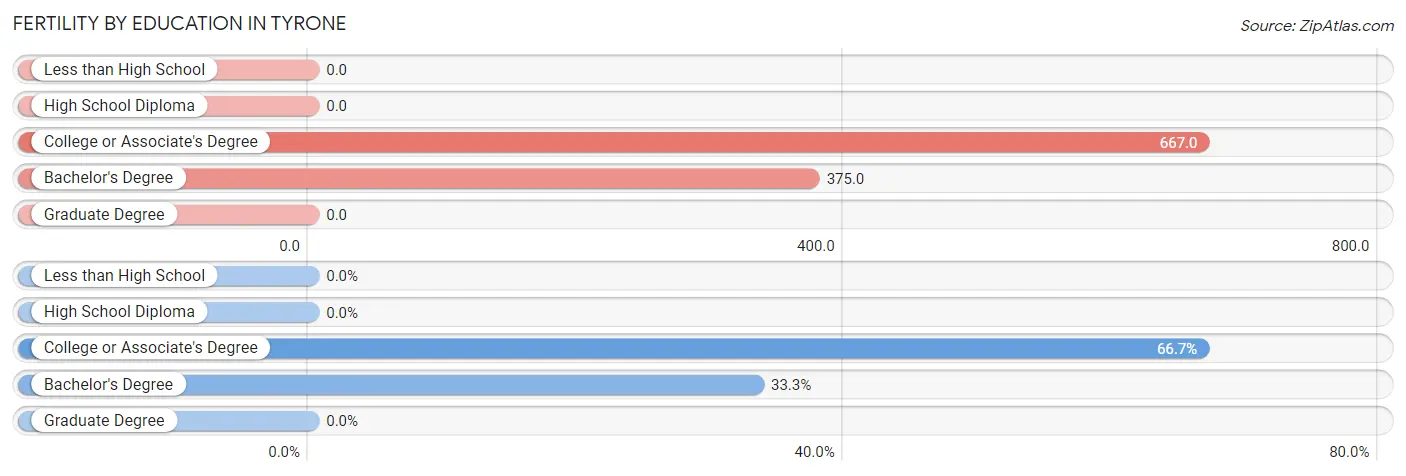
| Educational Attainment | Women with Births | Births / 1,000 Women |
| Less than High School | 0 (0.0%) | 0.0 |
| High School Diploma | 0 (0.0%) | 0.0 |
| College or Associate's Degree | 6 (66.7%) | 667.0 |
| Bachelor's Degree | 3 (33.3%) | 375.0 |
| Graduate Degree | 0 (0.0%) | 0.0 |
| Total | 9 (100.0%) | 68.0 |
Fertility by Education by Marriage Status in Tyrone
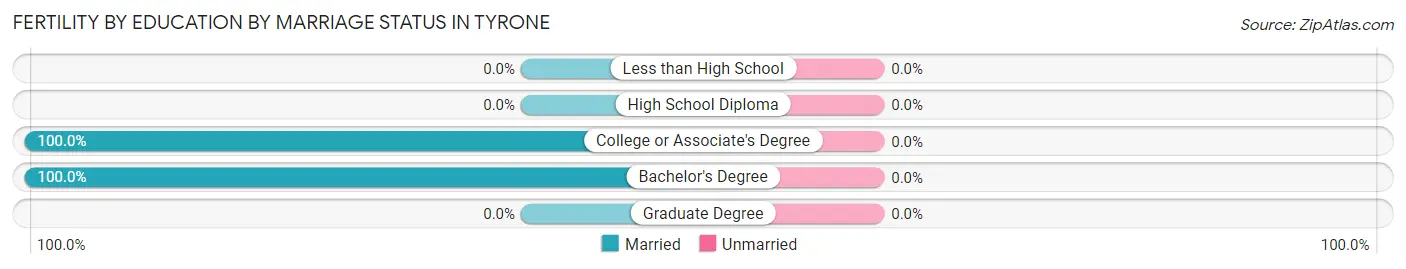
| Educational Attainment | Married | Unmarried |
| Less than High School | 0 (0.0%) | 0 (0.0%) |
| High School Diploma | 0 (0.0%) | 0 (0.0%) |
| College or Associate's Degree | 6 (100.0%) | 0 (0.0%) |
| Bachelor's Degree | 3 (100.0%) | 0 (0.0%) |
| Graduate Degree | 0 (0.0%) | 0 (0.0%) |
| Total | 9 (100.0%) | 0 (0.0%) |
Employment Characteristics in Tyrone
Employment by Class of Employer in Tyrone
Among the 234 employed individuals in Tyrone, private company employees (150 | 64.1%), self-employed (not incorporated) (31 | 13.3%), and state government employees (31 | 13.3%) make up the most common classes of employment.
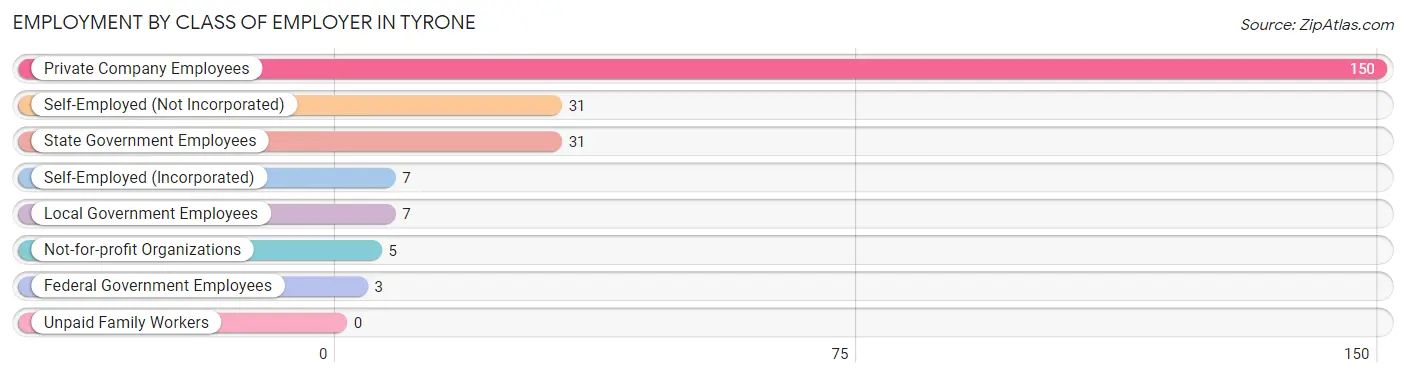
| Employer Class | # Employees | % Employees |
| Private Company Employees | 150 | 64.1% |
| Self-Employed (Incorporated) | 7 | 3.0% |
| Self-Employed (Not Incorporated) | 31 | 13.3% |
| Not-for-profit Organizations | 5 | 2.1% |
| Local Government Employees | 7 | 3.0% |
| State Government Employees | 31 | 13.3% |
| Federal Government Employees | 3 | 1.3% |
| Unpaid Family Workers | 0 | 0.0% |
| Total | 234 | 100.0% |
Employment Status by Age in Tyrone
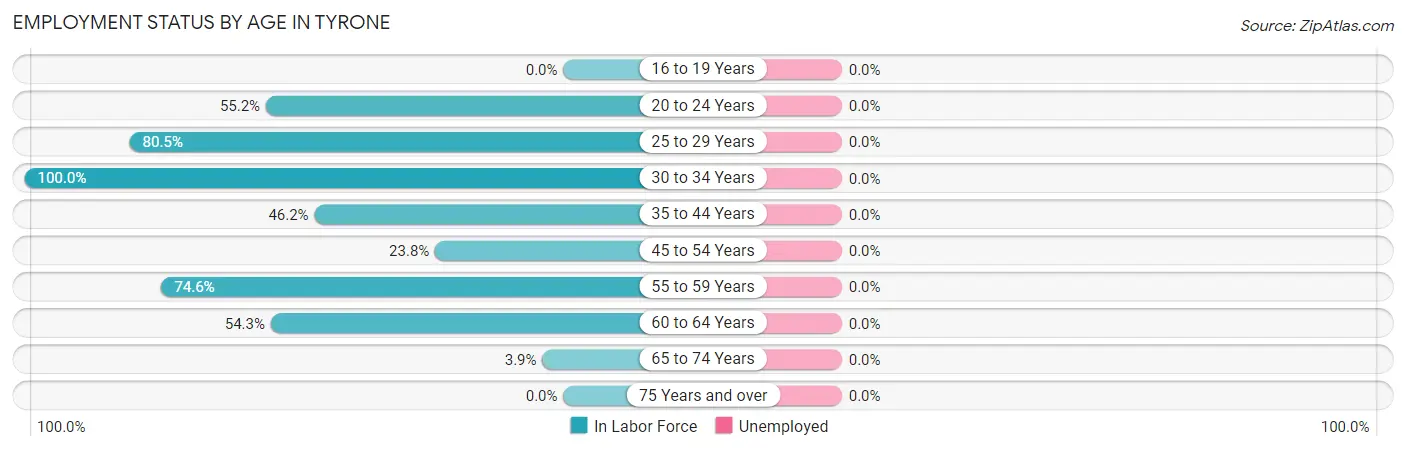
| Age Bracket | In Labor Force | Unemployed |
| 16 to 19 Years | 0 (0.0%) | 0 (0.0%) |
| 20 to 24 Years | 32 (55.2%) | 0 (0.0%) |
| 25 to 29 Years | 33 (80.5%) | 0 (0.0%) |
| 30 to 34 Years | 40 (100.0%) | 0 (0.0%) |
| 35 to 44 Years | 24 (46.2%) | 0 (0.0%) |
| 45 to 54 Years | 43 (23.8%) | 0 (0.0%) |
| 55 to 59 Years | 44 (74.6%) | 0 (0.0%) |
| 60 to 64 Years | 19 (54.3%) | 0 (0.0%) |
| 65 to 74 Years | 5 (3.9%) | 0 (0.0%) |
| 75 Years and over | 0 (0.0%) | 0 (0.0%) |
| Total | 240 (32.6%) | 0 (0.0%) |
Employment Status by Educational Attainment in Tyrone
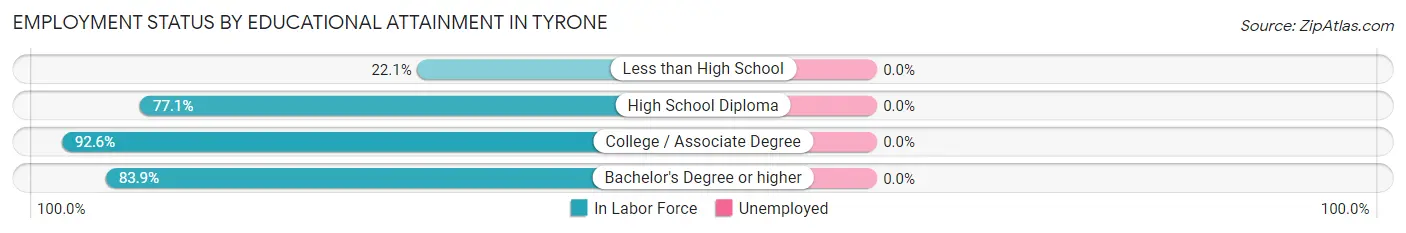
| Educational Attainment | In Labor Force | Unemployed |
| Less than High School | 50 (22.1%) | 0 (0.0%) |
| High School Diploma | 64 (77.1%) | 0 (0.0%) |
| College / Associate Degree | 63 (92.6%) | 0 (0.0%) |
| Bachelor's Degree or higher | 26 (83.9%) | 0 (0.0%) |
| Total | 203 (49.8%) | 0 (0.0%) |
Employment Occupations by Sex in Tyrone
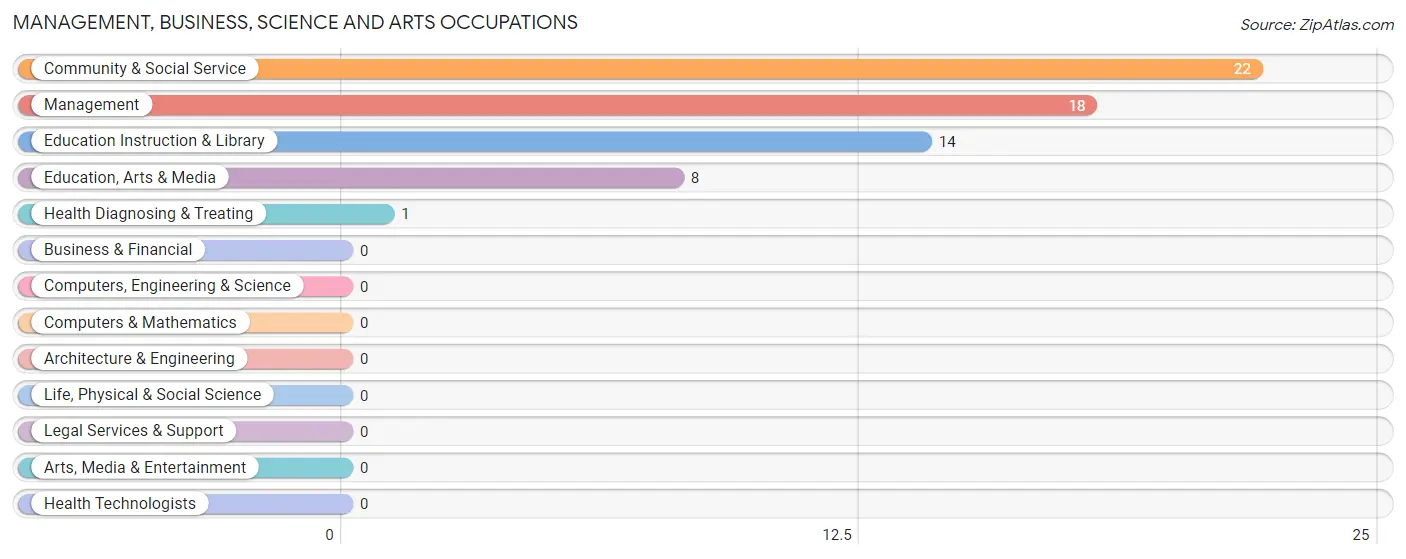
Management, Business, Science and Arts Occupations
The most common Management, Business, Science and Arts occupations in Tyrone are Community & Social Service (22 | 9.2%), Management (18 | 7.5%), Education Instruction & Library (14 | 5.8%), Education, Arts & Media (8 | 3.3%), and Health Diagnosing & Treating (1 | 0.4%).
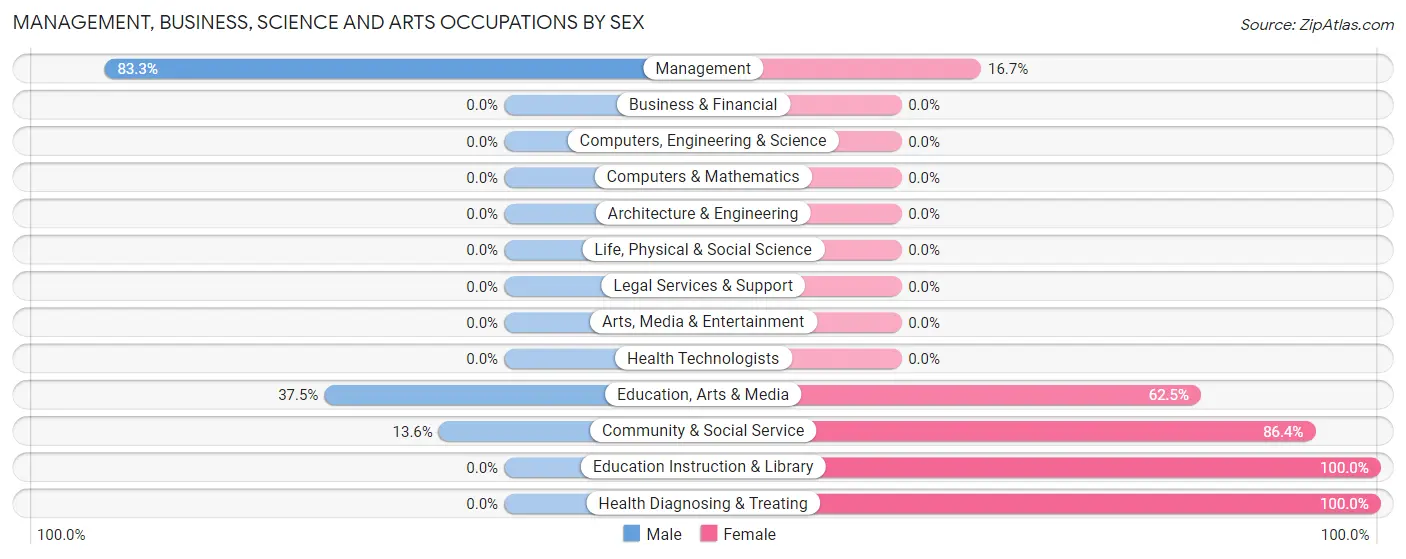
Management, Business, Science and Arts Occupations by Sex
Within the Management, Business, Science and Arts occupations in Tyrone, the most male-oriented occupations are Management (83.3%), Education, Arts & Media (37.5%), and Community & Social Service (13.6%), while the most female-oriented occupations are Education Instruction & Library (100.0%), Health Diagnosing & Treating (100.0%), and Community & Social Service (86.4%).
| Occupation | Male | Female |
| Management | 15 (83.3%) | 3 (16.7%) |
| Business & Financial | 0 (0.0%) | 0 (0.0%) |
| Computers, Engineering & Science | 0 (0.0%) | 0 (0.0%) |
| Computers & Mathematics | 0 (0.0%) | 0 (0.0%) |
| Architecture & Engineering | 0 (0.0%) | 0 (0.0%) |
| Life, Physical & Social Science | 0 (0.0%) | 0 (0.0%) |
| Community & Social Service | 3 (13.6%) | 19 (86.4%) |
| Education, Arts & Media | 3 (37.5%) | 5 (62.5%) |
| Legal Services & Support | 0 (0.0%) | 0 (0.0%) |
| Education Instruction & Library | 0 (0.0%) | 14 (100.0%) |
| Arts, Media & Entertainment | 0 (0.0%) | 0 (0.0%) |
| Health Diagnosing & Treating | 0 (0.0%) | 1 (100.0%) |
| Health Technologists | 0 (0.0%) | 0 (0.0%) |
| Total (Category) | 18 (43.9%) | 23 (56.1%) |
| Total (Overall) | 135 (56.2%) | 105 (43.8%) |
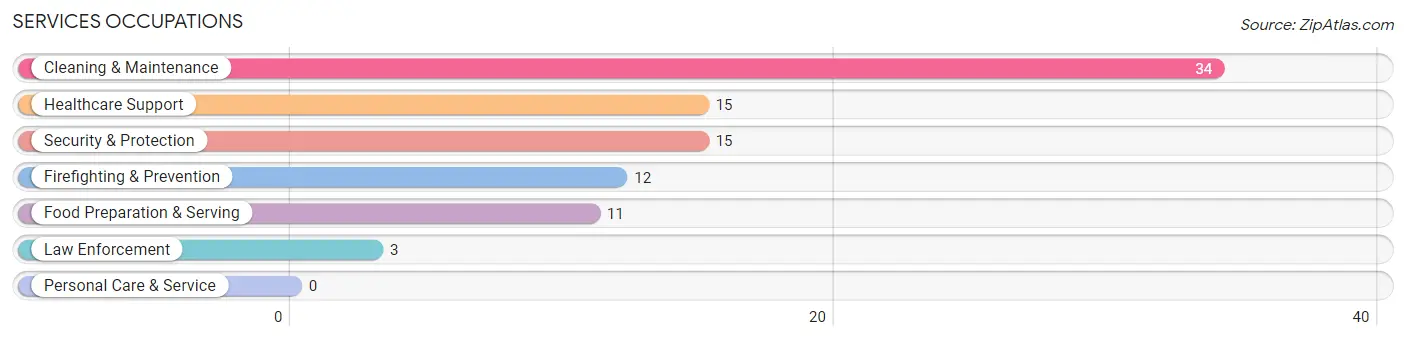
Services Occupations
The most common Services occupations in Tyrone are Cleaning & Maintenance (34 | 14.2%), Healthcare Support (15 | 6.2%), Security & Protection (15 | 6.2%), Firefighting & Prevention (12 | 5.0%), and Food Preparation & Serving (11 | 4.6%).
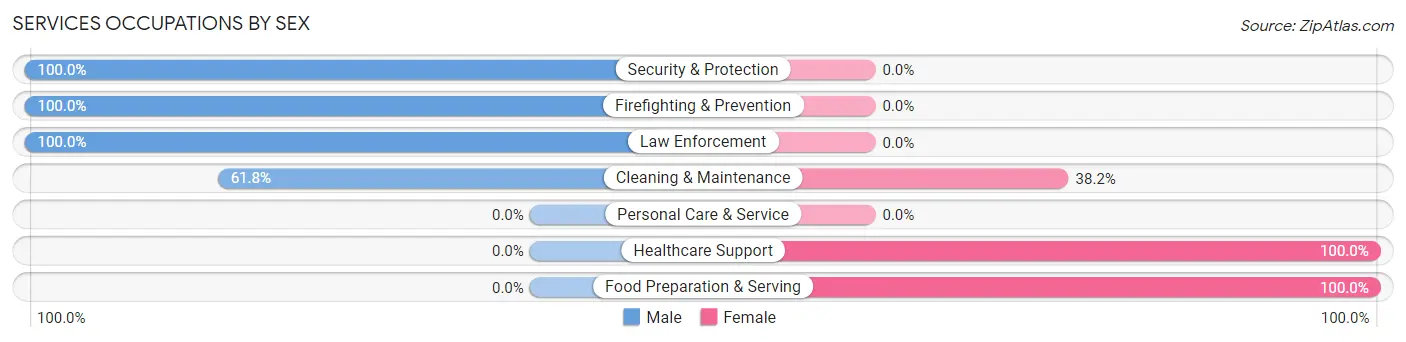
Services Occupations by Sex
Within the Services occupations in Tyrone, the most male-oriented occupations are Security & Protection (100.0%), Firefighting & Prevention (100.0%), and Law Enforcement (100.0%), while the most female-oriented occupations are Healthcare Support (100.0%), Food Preparation & Serving (100.0%), and Cleaning & Maintenance (38.2%).
| Occupation | Male | Female |
| Healthcare Support | 0 (0.0%) | 15 (100.0%) |
| Security & Protection | 15 (100.0%) | 0 (0.0%) |
| Firefighting & Prevention | 12 (100.0%) | 0 (0.0%) |
| Law Enforcement | 3 (100.0%) | 0 (0.0%) |
| Food Preparation & Serving | 0 (0.0%) | 11 (100.0%) |
| Cleaning & Maintenance | 21 (61.8%) | 13 (38.2%) |
| Personal Care & Service | 0 (0.0%) | 0 (0.0%) |
| Total (Category) | 36 (48.0%) | 39 (52.0%) |
| Total (Overall) | 135 (56.2%) | 105 (43.8%) |
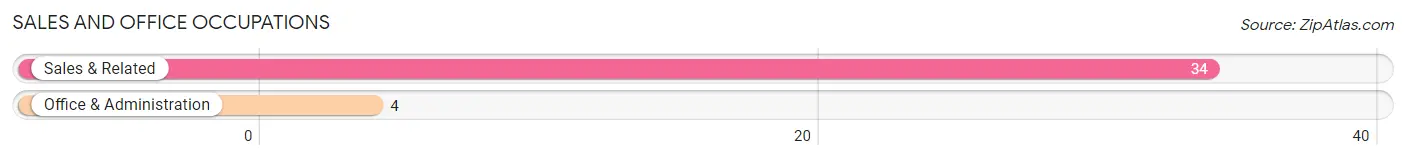
Sales and Office Occupations
The most common Sales and Office occupations in Tyrone are Sales & Related (34 | 14.2%), and Office & Administration (4 | 1.7%).
Sales and Office Occupations by Sex
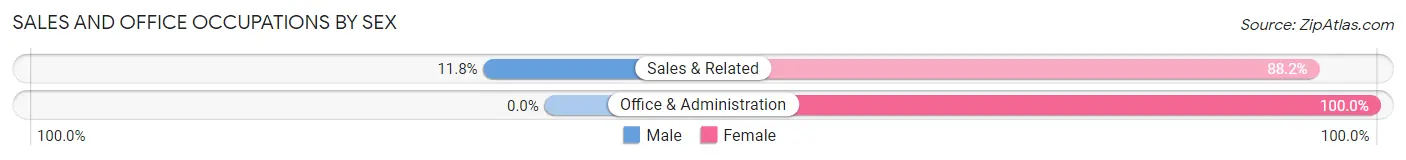
| Occupation | Male | Female |
| Sales & Related | 4 (11.8%) | 30 (88.2%) |
| Office & Administration | 0 (0.0%) | 4 (100.0%) |
| Total (Category) | 4 (10.5%) | 34 (89.5%) |
| Total (Overall) | 135 (56.2%) | 105 (43.8%) |
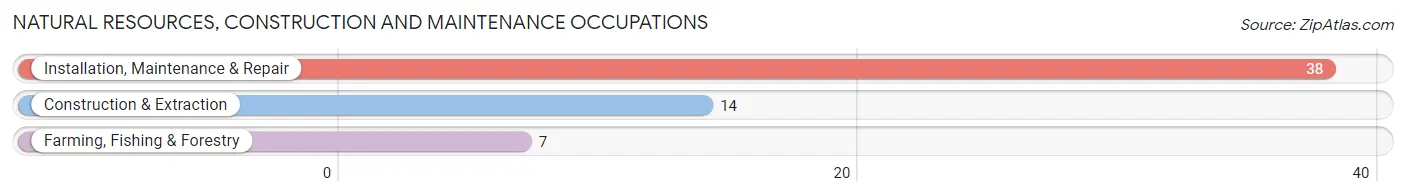
Natural Resources, Construction and Maintenance Occupations
The most common Natural Resources, Construction and Maintenance occupations in Tyrone are Installation, Maintenance & Repair (38 | 15.8%), Construction & Extraction (14 | 5.8%), and Farming, Fishing & Forestry (7 | 2.9%).
Natural Resources, Construction and Maintenance Occupations by Sex
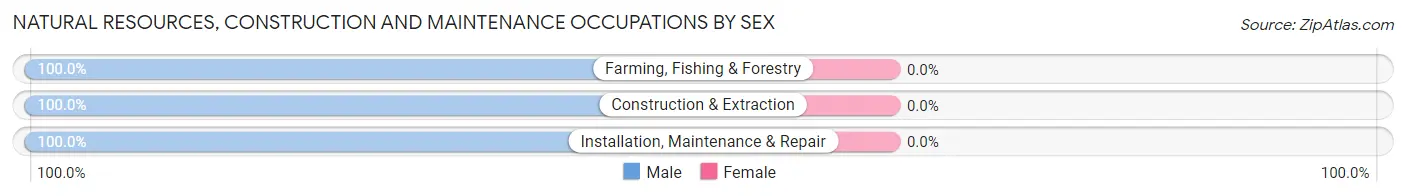
| Occupation | Male | Female |
| Farming, Fishing & Forestry | 7 (100.0%) | 0 (0.0%) |
| Construction & Extraction | 14 (100.0%) | 0 (0.0%) |
| Installation, Maintenance & Repair | 38 (100.0%) | 0 (0.0%) |
| Total (Category) | 59 (100.0%) | 0 (0.0%) |
| Total (Overall) | 135 (56.2%) | 105 (43.8%) |
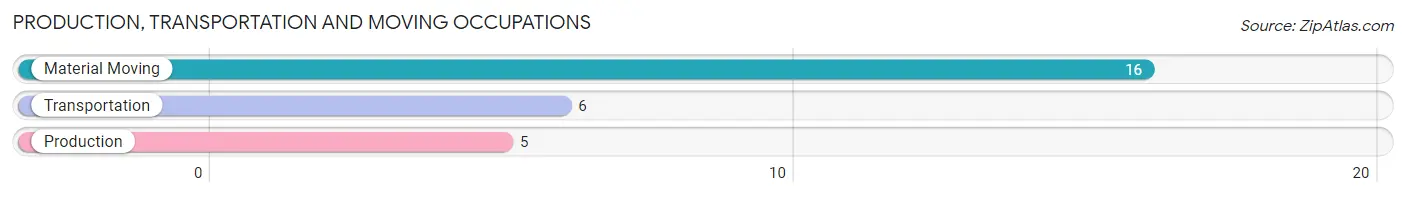
Production, Transportation and Moving Occupations
The most common Production, Transportation and Moving occupations in Tyrone are Material Moving (16 | 6.7%), Transportation (6 | 2.5%), and Production (5 | 2.1%).
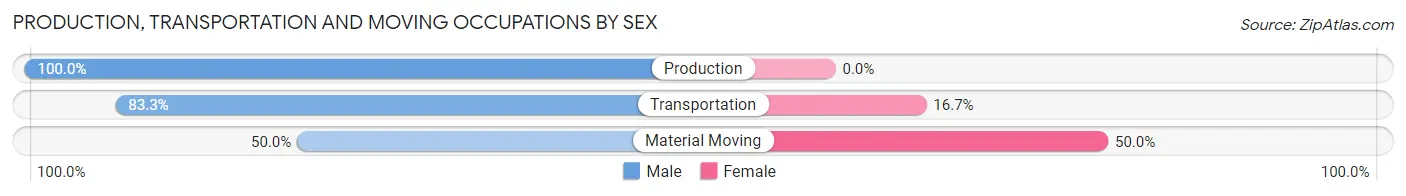
Production, Transportation and Moving Occupations by Sex
| Occupation | Male | Female |
| Production | 5 (100.0%) | 0 (0.0%) |
| Transportation | 5 (83.3%) | 1 (16.7%) |
| Material Moving | 8 (50.0%) | 8 (50.0%) |
| Total (Category) | 18 (66.7%) | 9 (33.3%) |
| Total (Overall) | 135 (56.2%) | 105 (43.8%) |
Employment Industries by Sex in Tyrone
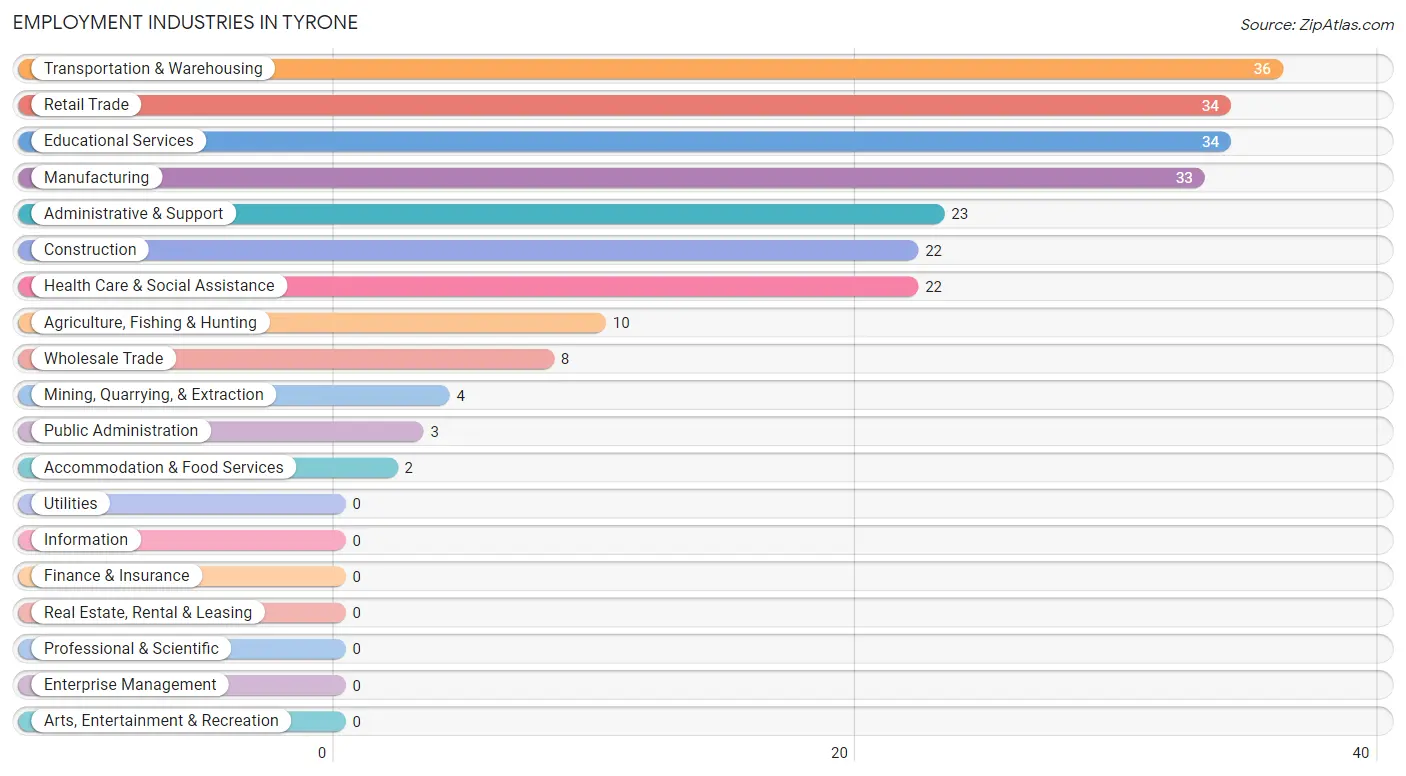
Employment Industries in Tyrone
The major employment industries in Tyrone include Transportation & Warehousing (36 | 15.0%), Retail Trade (34 | 14.2%), Educational Services (34 | 14.2%), Manufacturing (33 | 13.8%), and Administrative & Support (23 | 9.6%).
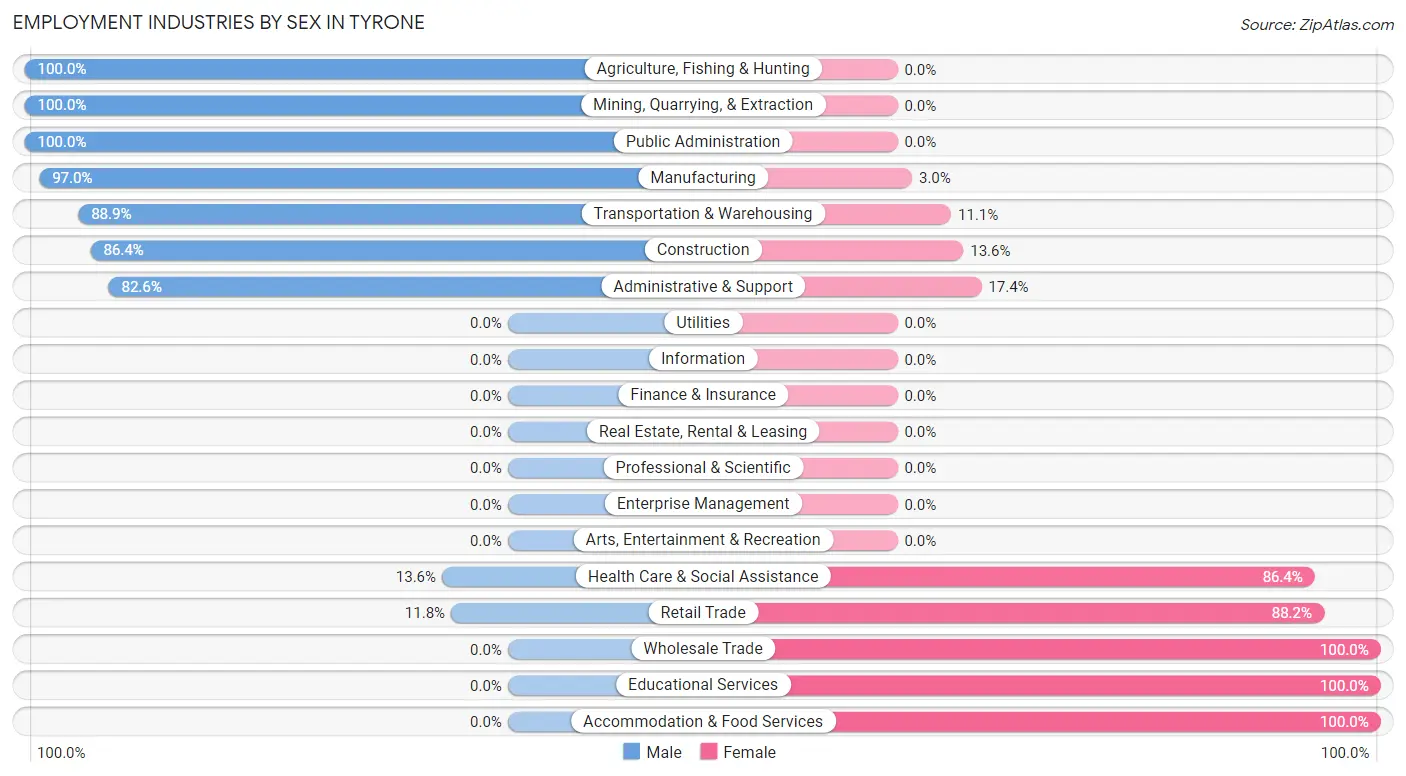
Employment Industries by Sex in Tyrone
The Tyrone industries that see more men than women are Agriculture, Fishing & Hunting (100.0%), Mining, Quarrying, & Extraction (100.0%), and Public Administration (100.0%), whereas the industries that tend to have a higher number of women are Wholesale Trade (100.0%), Educational Services (100.0%), and Accommodation & Food Services (100.0%).
| Industry | Male | Female |
| Agriculture, Fishing & Hunting | 10 (100.0%) | 0 (0.0%) |
| Mining, Quarrying, & Extraction | 4 (100.0%) | 0 (0.0%) |
| Construction | 19 (86.4%) | 3 (13.6%) |
| Manufacturing | 32 (97.0%) | 1 (3.0%) |
| Wholesale Trade | 0 (0.0%) | 8 (100.0%) |
| Retail Trade | 4 (11.8%) | 30 (88.2%) |
| Transportation & Warehousing | 32 (88.9%) | 4 (11.1%) |
| Utilities | 0 (0.0%) | 0 (0.0%) |
| Information | 0 (0.0%) | 0 (0.0%) |
| Finance & Insurance | 0 (0.0%) | 0 (0.0%) |
| Real Estate, Rental & Leasing | 0 (0.0%) | 0 (0.0%) |
| Professional & Scientific | 0 (0.0%) | 0 (0.0%) |
| Enterprise Management | 0 (0.0%) | 0 (0.0%) |
| Administrative & Support | 19 (82.6%) | 4 (17.4%) |
| Educational Services | 0 (0.0%) | 34 (100.0%) |
| Health Care & Social Assistance | 3 (13.6%) | 19 (86.4%) |
| Arts, Entertainment & Recreation | 0 (0.0%) | 0 (0.0%) |
| Accommodation & Food Services | 0 (0.0%) | 2 (100.0%) |
| Public Administration | 3 (100.0%) | 0 (0.0%) |
| Total | 135 (56.2%) | 105 (43.8%) |
Education in Tyrone
School Enrollment in Tyrone
The most common levels of schooling among the 439 students in Tyrone are middle school (248 | 56.5%), high school (119 | 27.1%), and elementary school (34 | 7.7%).
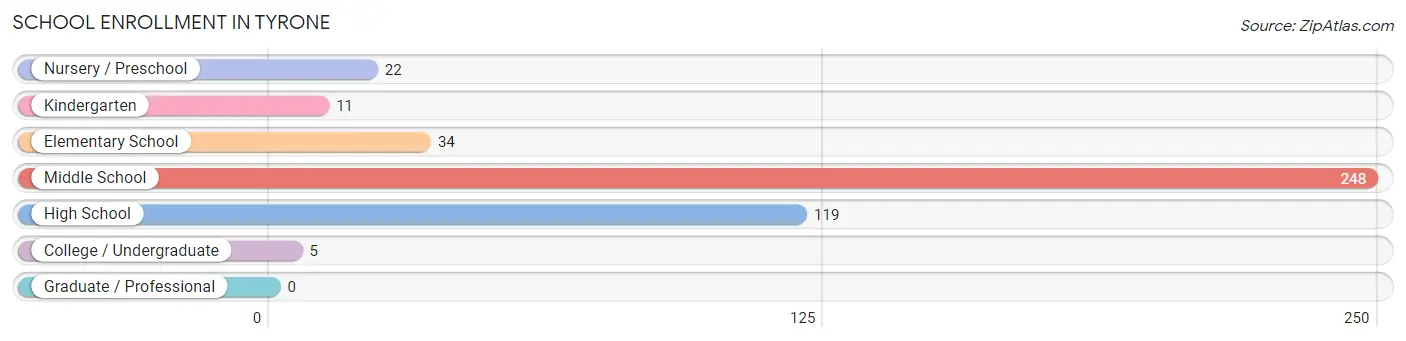
| School Level | # Students | % Students |
| Nursery / Preschool | 22 | 5.0% |
| Kindergarten | 11 | 2.5% |
| Elementary School | 34 | 7.7% |
| Middle School | 248 | 56.5% |
| High School | 119 | 27.1% |
| College / Undergraduate | 5 | 1.1% |
| Graduate / Professional | 0 | 0.0% |
| Total | 439 | 100.0% |
School Enrollment by Age by Funding Source in Tyrone
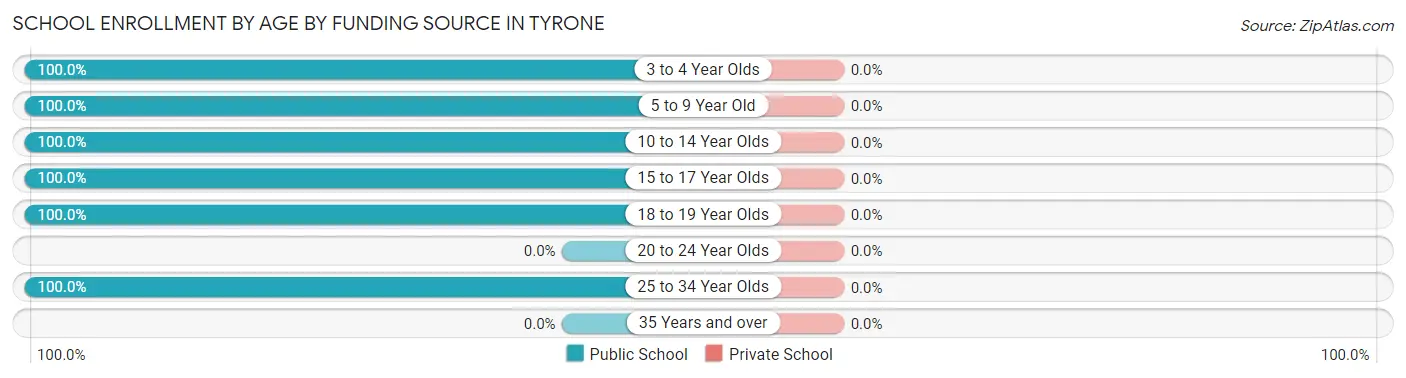
| Age Bracket | Public School | Private School |
| 3 to 4 Year Olds | 18 (100.0%) | 0 (0.0%) |
| 5 to 9 Year Old | 49 (100.0%) | 0 (0.0%) |
| 10 to 14 Year Olds | 256 (100.0%) | 0 (0.0%) |
| 15 to 17 Year Olds | 104 (100.0%) | 0 (0.0%) |
| 18 to 19 Year Olds | 7 (100.0%) | 0 (0.0%) |
| 20 to 24 Year Olds | 0 (0.0%) | 0 (0.0%) |
| 25 to 34 Year Olds | 5 (100.0%) | 0 (0.0%) |
| 35 Years and over | 0 (0.0%) | 0 (0.0%) |
| Total | 439 (100.0%) | 0 (0.0%) |
Educational Attainment by Field of Study in Tyrone
Education (109 | 85.2%), science & technology (5 | 3.9%), business (5 | 3.9%), arts & humanities (4 | 3.1%), and bio, nature & agricultural (3 | 2.3%) are the most common fields of study among 128 individuals in Tyrone who have obtained a bachelor's degree or higher.
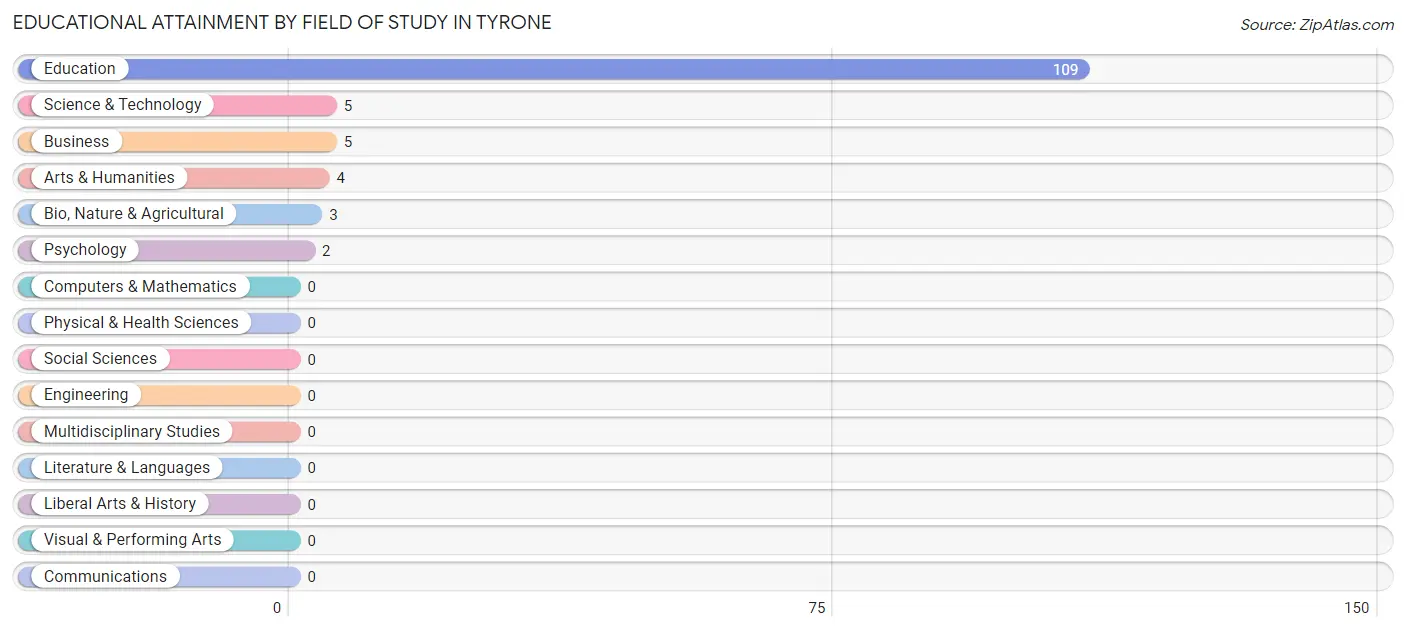
| Field of Study | # Graduates | % Graduates |
| Computers & Mathematics | 0 | 0.0% |
| Bio, Nature & Agricultural | 3 | 2.3% |
| Physical & Health Sciences | 0 | 0.0% |
| Psychology | 2 | 1.6% |
| Social Sciences | 0 | 0.0% |
| Engineering | 0 | 0.0% |
| Multidisciplinary Studies | 0 | 0.0% |
| Science & Technology | 5 | 3.9% |
| Business | 5 | 3.9% |
| Education | 109 | 85.2% |
| Literature & Languages | 0 | 0.0% |
| Liberal Arts & History | 0 | 0.0% |
| Visual & Performing Arts | 0 | 0.0% |
| Communications | 0 | 0.0% |
| Arts & Humanities | 4 | 3.1% |
| Total | 128 | 100.0% |
Transportation & Commute in Tyrone
Vehicle Availability by Sex in Tyrone
The most prevalent vehicle ownership categories in Tyrone are males with 2 vehicles (61, accounting for 45.2%) and females with 2 vehicles (49, making up 61.6%).
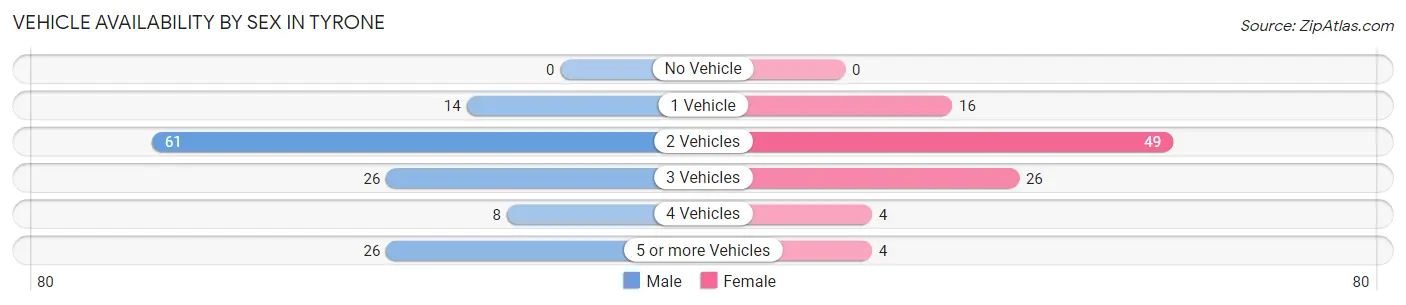
| Vehicles Available | Male | Female |
| No Vehicle | 0 (0.0%) | 0 (0.0%) |
| 1 Vehicle | 14 (10.4%) | 16 (16.2%) |
| 2 Vehicles | 61 (45.2%) | 49 (49.5%) |
| 3 Vehicles | 26 (19.3%) | 26 (26.3%) |
| 4 Vehicles | 8 (5.9%) | 4 (4.0%) |
| 5 or more Vehicles | 26 (19.3%) | 4 (4.0%) |
| Total | 135 (100.0%) | 99 (100.0%) |
Commute Time in Tyrone
The most frequently occuring commute durations in Tyrone are 15 to 19 minutes (63 commuters, 27.4%), 20 to 24 minutes (38 commuters, 16.5%), and 10 to 14 minutes (30 commuters, 13.0%).
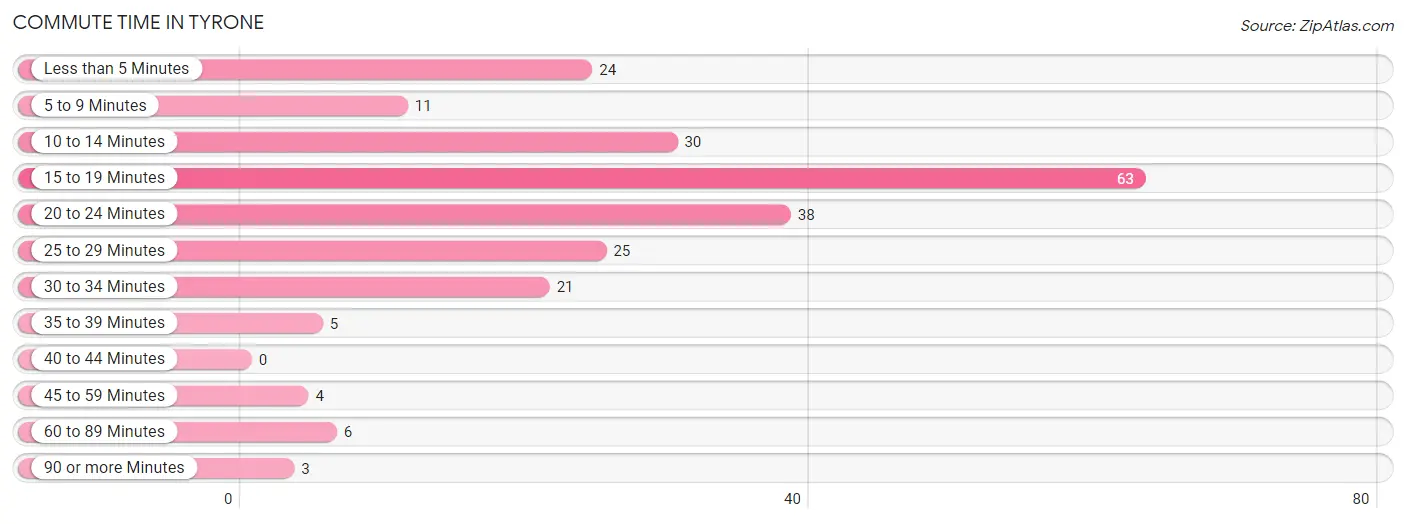
| Commute Time | # Commuters | % Commuters |
| Less than 5 Minutes | 24 | 10.4% |
| 5 to 9 Minutes | 11 | 4.8% |
| 10 to 14 Minutes | 30 | 13.0% |
| 15 to 19 Minutes | 63 | 27.4% |
| 20 to 24 Minutes | 38 | 16.5% |
| 25 to 29 Minutes | 25 | 10.9% |
| 30 to 34 Minutes | 21 | 9.1% |
| 35 to 39 Minutes | 5 | 2.2% |
| 40 to 44 Minutes | 0 | 0.0% |
| 45 to 59 Minutes | 4 | 1.7% |
| 60 to 89 Minutes | 6 | 2.6% |
| 90 or more Minutes | 3 | 1.3% |
Commute Time by Sex in Tyrone
The most common commute times in Tyrone are 15 to 19 minutes (44 commuters, 33.6%) for males and less than 5 minutes (24 commuters, 24.2%) for females.
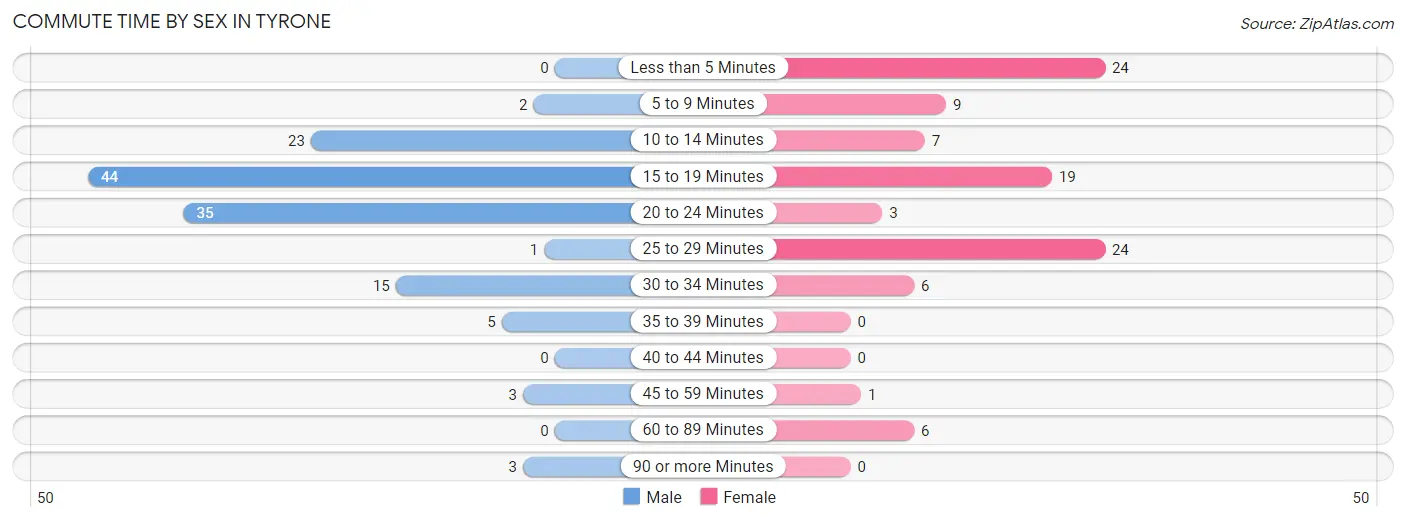
| Commute Time | Male | Female |
| Less than 5 Minutes | 0 (0.0%) | 24 (24.2%) |
| 5 to 9 Minutes | 2 (1.5%) | 9 (9.1%) |
| 10 to 14 Minutes | 23 (17.6%) | 7 (7.1%) |
| 15 to 19 Minutes | 44 (33.6%) | 19 (19.2%) |
| 20 to 24 Minutes | 35 (26.7%) | 3 (3.0%) |
| 25 to 29 Minutes | 1 (0.8%) | 24 (24.2%) |
| 30 to 34 Minutes | 15 (11.5%) | 6 (6.1%) |
| 35 to 39 Minutes | 5 (3.8%) | 0 (0.0%) |
| 40 to 44 Minutes | 0 (0.0%) | 0 (0.0%) |
| 45 to 59 Minutes | 3 (2.3%) | 1 (1.0%) |
| 60 to 89 Minutes | 0 (0.0%) | 6 (6.1%) |
| 90 or more Minutes | 3 (2.3%) | 0 (0.0%) |
Time of Departure to Work by Sex in Tyrone
The most frequent times of departure to work in Tyrone are 7:00 AM to 7:29 AM (29, 22.1%) for males and 7:00 AM to 7:29 AM (34, 34.3%) for females.
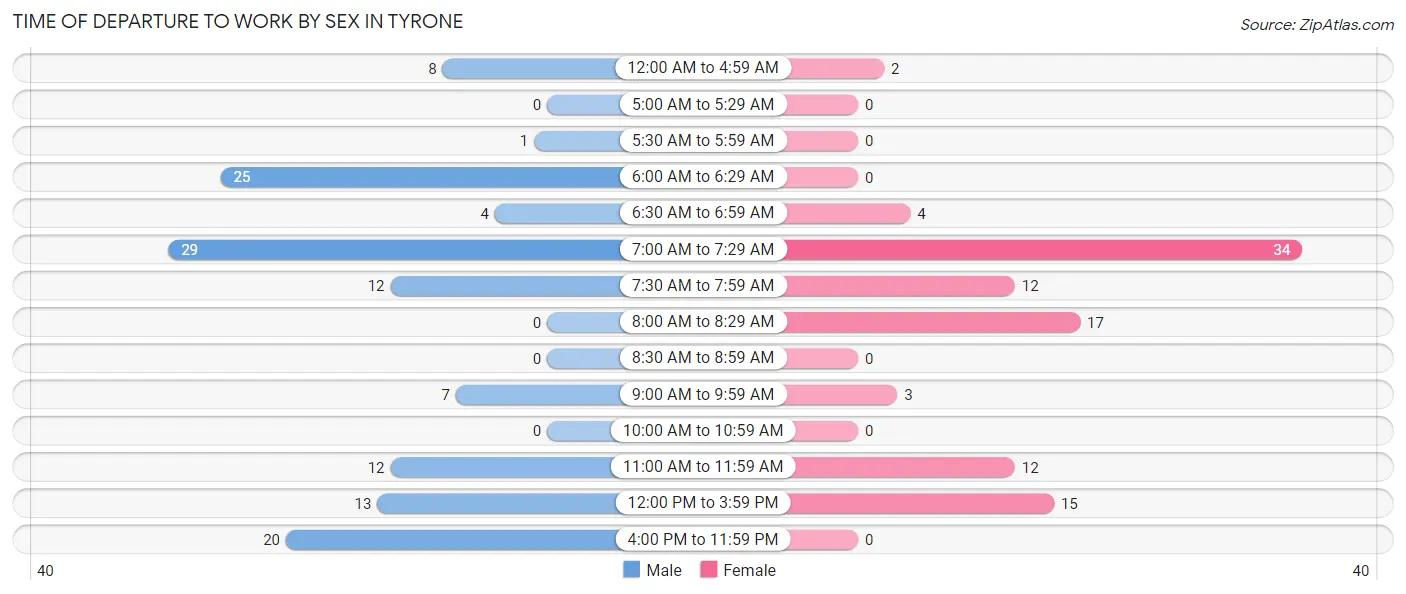
| Time of Departure | Male | Female |
| 12:00 AM to 4:59 AM | 8 (6.1%) | 2 (2.0%) |
| 5:00 AM to 5:29 AM | 0 (0.0%) | 0 (0.0%) |
| 5:30 AM to 5:59 AM | 1 (0.8%) | 0 (0.0%) |
| 6:00 AM to 6:29 AM | 25 (19.1%) | 0 (0.0%) |
| 6:30 AM to 6:59 AM | 4 (3.0%) | 4 (4.0%) |
| 7:00 AM to 7:29 AM | 29 (22.1%) | 34 (34.3%) |
| 7:30 AM to 7:59 AM | 12 (9.2%) | 12 (12.1%) |
| 8:00 AM to 8:29 AM | 0 (0.0%) | 17 (17.2%) |
| 8:30 AM to 8:59 AM | 0 (0.0%) | 0 (0.0%) |
| 9:00 AM to 9:59 AM | 7 (5.3%) | 3 (3.0%) |
| 10:00 AM to 10:59 AM | 0 (0.0%) | 0 (0.0%) |
| 11:00 AM to 11:59 AM | 12 (9.2%) | 12 (12.1%) |
| 12:00 PM to 3:59 PM | 13 (9.9%) | 15 (15.1%) |
| 4:00 PM to 11:59 PM | 20 (15.3%) | 0 (0.0%) |
| Total | 131 (100.0%) | 99 (100.0%) |
Housing Occupancy in Tyrone
Occupancy by Ownership in Tyrone
Of the total 301 dwellings in Tyrone, owner-occupied units account for 260 (86.4%), while renter-occupied units make up 41 (13.6%).
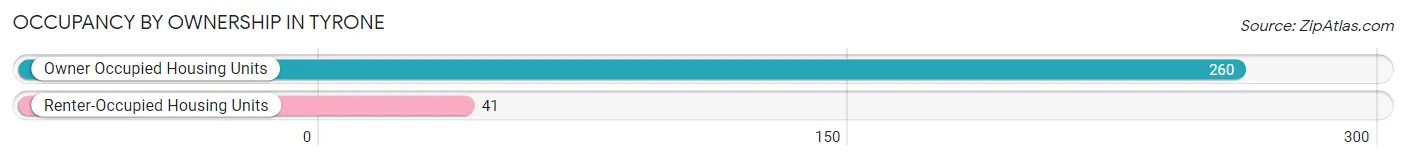
| Occupancy | # Housing Units | % Housing Units |
| Owner Occupied Housing Units | 260 | 86.4% |
| Renter-Occupied Housing Units | 41 | 13.6% |
| Total Occupied Housing Units | 301 | 100.0% |
Occupancy by Household Size in Tyrone
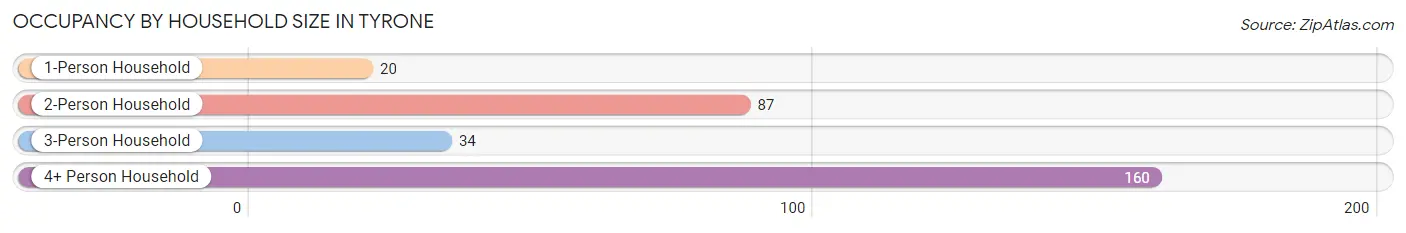
| Household Size | # Housing Units | % Housing Units |
| 1-Person Household | 20 | 6.6% |
| 2-Person Household | 87 | 28.9% |
| 3-Person Household | 34 | 11.3% |
| 4+ Person Household | 160 | 53.2% |
| Total Housing Units | 301 | 100.0% |
Occupancy by Ownership by Household Size in Tyrone
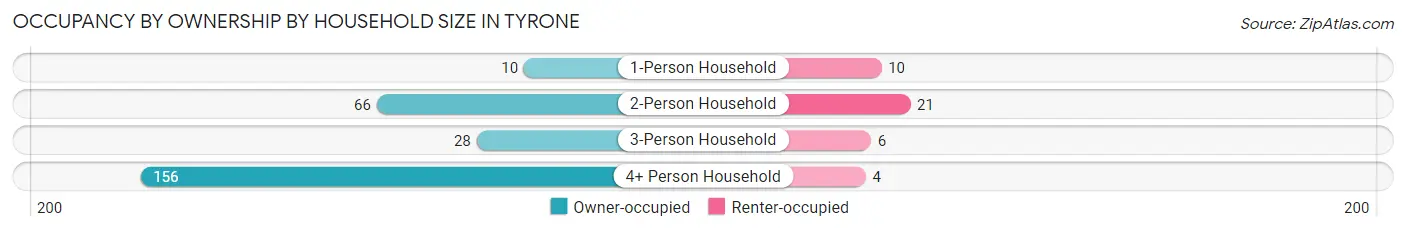
| Household Size | Owner-occupied | Renter-occupied |
| 1-Person Household | 10 (50.0%) | 10 (50.0%) |
| 2-Person Household | 66 (75.9%) | 21 (24.1%) |
| 3-Person Household | 28 (82.4%) | 6 (17.6%) |
| 4+ Person Household | 156 (97.5%) | 4 (2.5%) |
| Total Housing Units | 260 (86.4%) | 41 (13.6%) |
Occupancy by Educational Attainment in Tyrone
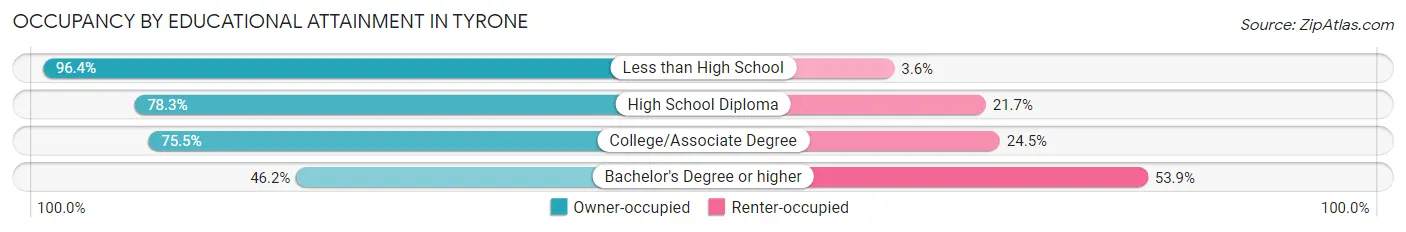
| Household Size | Owner-occupied | Renter-occupied |
| Less than High School | 160 (96.4%) | 6 (3.6%) |
| High School Diploma | 54 (78.3%) | 15 (21.7%) |
| College/Associate Degree | 40 (75.5%) | 13 (24.5%) |
| Bachelor's Degree or higher | 6 (46.2%) | 7 (53.8%) |
Occupancy by Age of Householder in Tyrone
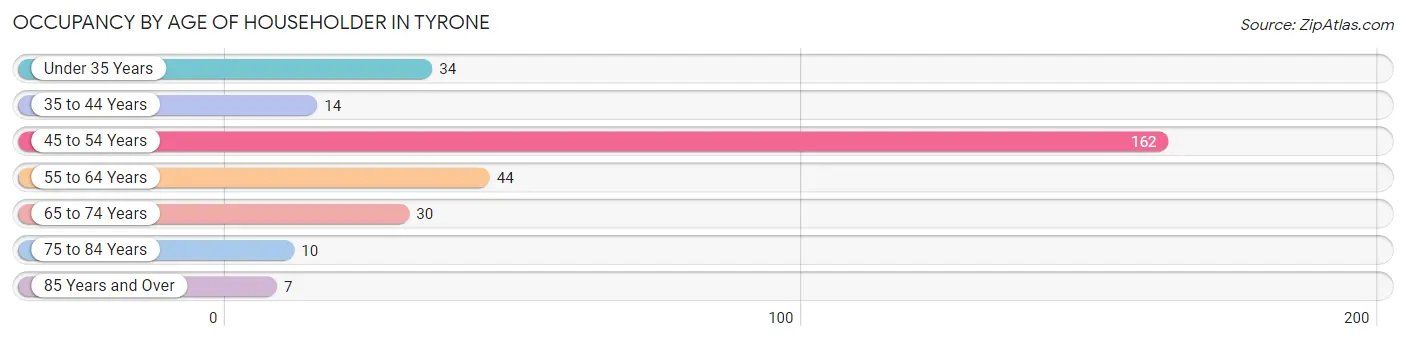
| Age Bracket | # Households | % Households |
| Under 35 Years | 34 | 11.3% |
| 35 to 44 Years | 14 | 4.6% |
| 45 to 54 Years | 162 | 53.8% |
| 55 to 64 Years | 44 | 14.6% |
| 65 to 74 Years | 30 | 10.0% |
| 75 to 84 Years | 10 | 3.3% |
| 85 Years and Over | 7 | 2.3% |
| Total | 301 | 100.0% |
Housing Finances in Tyrone
Median Income by Occupancy in Tyrone
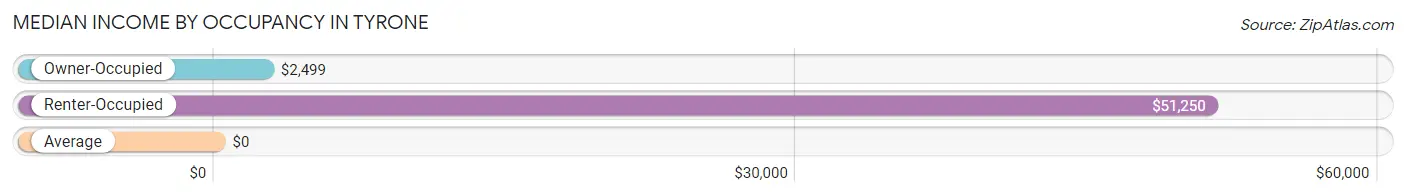
| Occupancy Type | # Households | Median Income |
| Owner-Occupied | 260 (86.4%) | $2,499 |
| Renter-Occupied | 41 (13.6%) | $51,250 |
| Average | 301 (100.0%) | $0 |
Occupancy by Householder Income Bracket in Tyrone
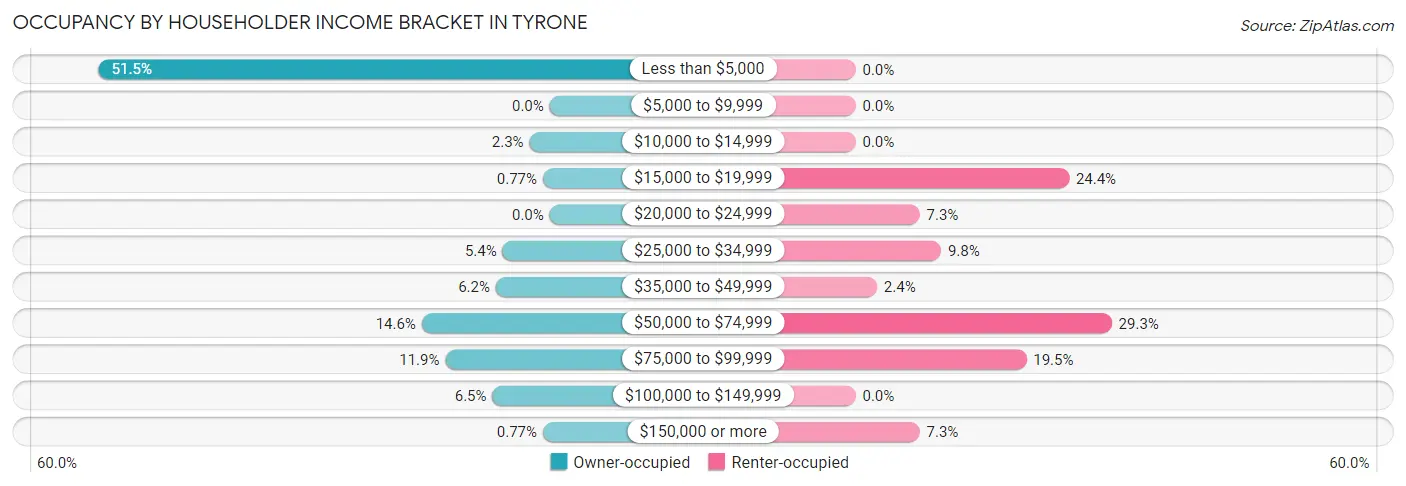
| Income Bracket | Owner-occupied | Renter-occupied |
| Less than $5,000 | 134 (51.5%) | 0 (0.0%) |
| $5,000 to $9,999 | 0 (0.0%) | 0 (0.0%) |
| $10,000 to $14,999 | 6 (2.3%) | 0 (0.0%) |
| $15,000 to $19,999 | 2 (0.8%) | 10 (24.4%) |
| $20,000 to $24,999 | 0 (0.0%) | 3 (7.3%) |
| $25,000 to $34,999 | 14 (5.4%) | 4 (9.8%) |
| $35,000 to $49,999 | 16 (6.1%) | 1 (2.4%) |
| $50,000 to $74,999 | 38 (14.6%) | 12 (29.3%) |
| $75,000 to $99,999 | 31 (11.9%) | 8 (19.5%) |
| $100,000 to $149,999 | 17 (6.5%) | 0 (0.0%) |
| $150,000 or more | 2 (0.8%) | 3 (7.3%) |
| Total | 260 (100.0%) | 41 (100.0%) |
Monthly Housing Cost Tiers in Tyrone
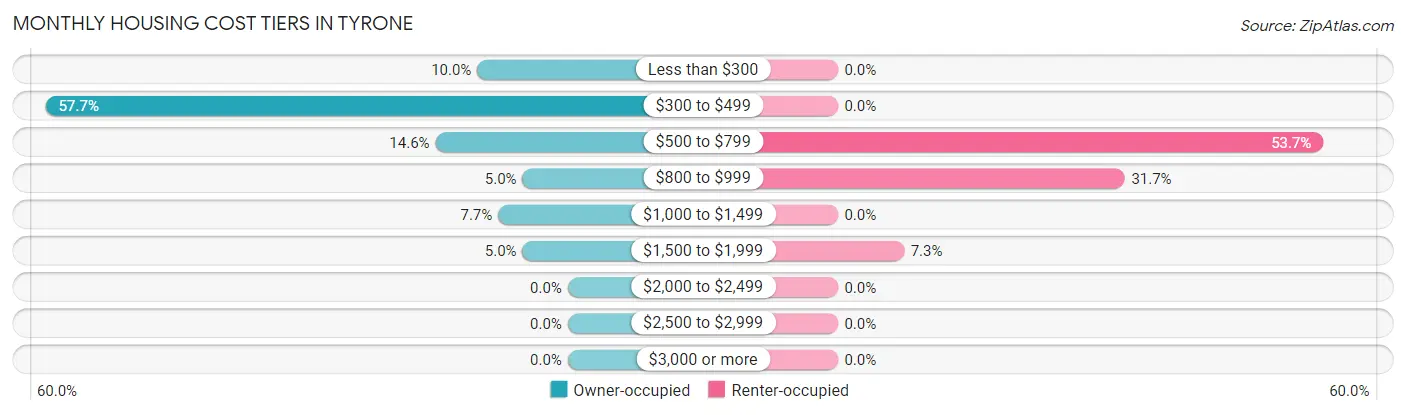
| Monthly Cost | Owner-occupied | Renter-occupied |
| Less than $300 | 26 (10.0%) | 0 (0.0%) |
| $300 to $499 | 150 (57.7%) | 0 (0.0%) |
| $500 to $799 | 38 (14.6%) | 22 (53.7%) |
| $800 to $999 | 13 (5.0%) | 13 (31.7%) |
| $1,000 to $1,499 | 20 (7.7%) | 0 (0.0%) |
| $1,500 to $1,999 | 13 (5.0%) | 3 (7.3%) |
| $2,000 to $2,499 | 0 (0.0%) | 0 (0.0%) |
| $2,500 to $2,999 | 0 (0.0%) | 0 (0.0%) |
| $3,000 or more | 0 (0.0%) | 0 (0.0%) |
| Total | 260 (100.0%) | 41 (100.0%) |
Physical Housing Characteristics in Tyrone
Housing Structures in Tyrone
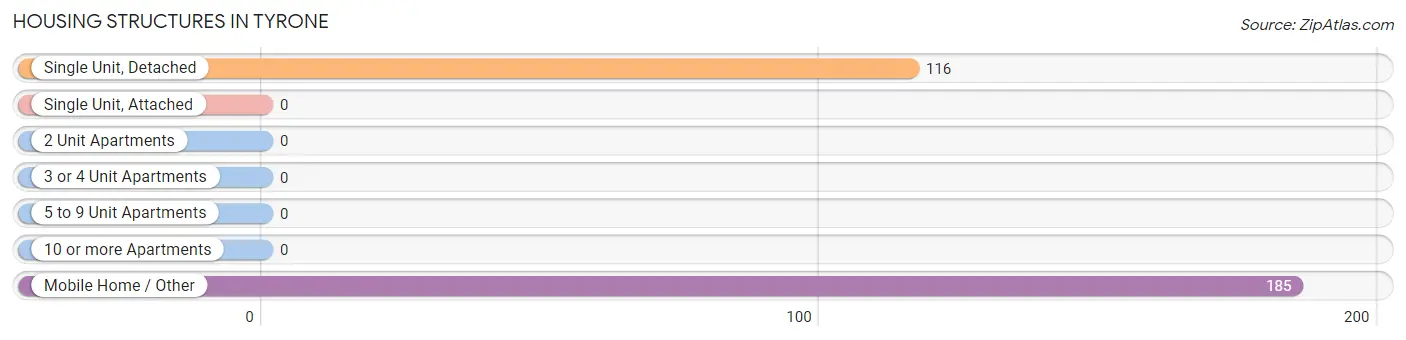
| Structure Type | # Housing Units | % Housing Units |
| Single Unit, Detached | 116 | 38.5% |
| Single Unit, Attached | 0 | 0.0% |
| 2 Unit Apartments | 0 | 0.0% |
| 3 or 4 Unit Apartments | 0 | 0.0% |
| 5 to 9 Unit Apartments | 0 | 0.0% |
| 10 or more Apartments | 0 | 0.0% |
| Mobile Home / Other | 185 | 61.5% |
| Total | 301 | 100.0% |
Housing Structures by Occupancy in Tyrone
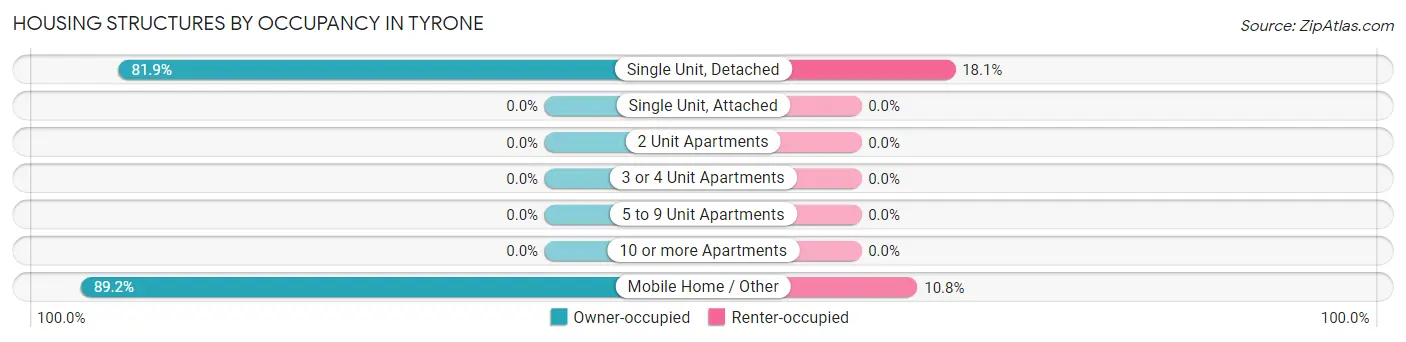
| Structure Type | Owner-occupied | Renter-occupied |
| Single Unit, Detached | 95 (81.9%) | 21 (18.1%) |
| Single Unit, Attached | 0 (0.0%) | 0 (0.0%) |
| 2 Unit Apartments | 0 (0.0%) | 0 (0.0%) |
| 3 or 4 Unit Apartments | 0 (0.0%) | 0 (0.0%) |
| 5 to 9 Unit Apartments | 0 (0.0%) | 0 (0.0%) |
| 10 or more Apartments | 0 (0.0%) | 0 (0.0%) |
| Mobile Home / Other | 165 (89.2%) | 20 (10.8%) |
| Total | 260 (86.4%) | 41 (13.6%) |
Housing Structures by Number of Rooms in Tyrone
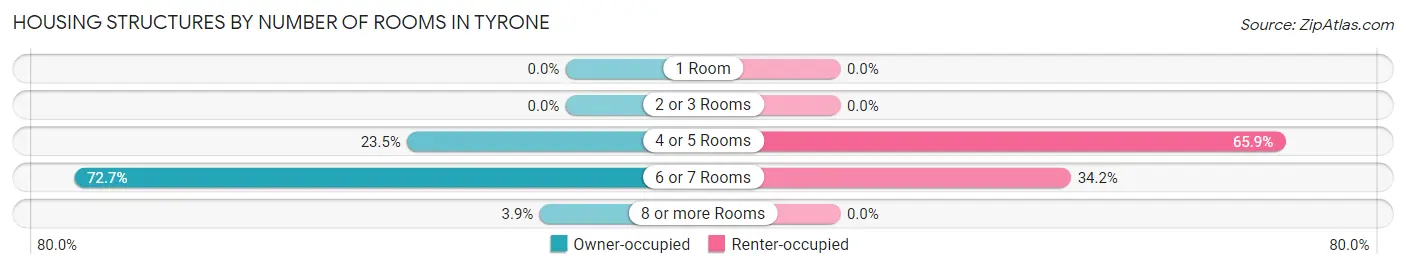
| Number of Rooms | Owner-occupied | Renter-occupied |
| 1 Room | 0 (0.0%) | 0 (0.0%) |
| 2 or 3 Rooms | 0 (0.0%) | 0 (0.0%) |
| 4 or 5 Rooms | 61 (23.5%) | 27 (65.8%) |
| 6 or 7 Rooms | 189 (72.7%) | 14 (34.2%) |
| 8 or more Rooms | 10 (3.8%) | 0 (0.0%) |
| Total | 260 (100.0%) | 41 (100.0%) |
Housing Structure by Heating Type in Tyrone
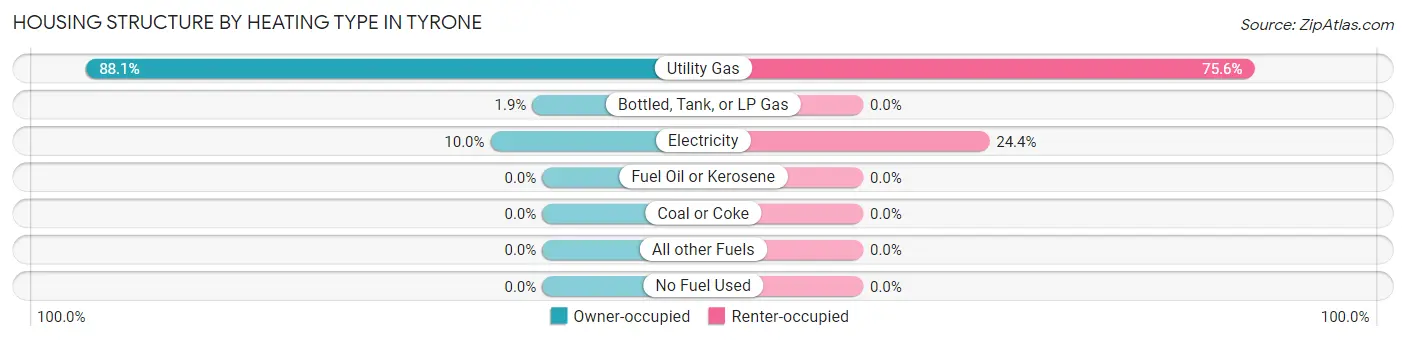
| Heating Type | Owner-occupied | Renter-occupied |
| Utility Gas | 229 (88.1%) | 31 (75.6%) |
| Bottled, Tank, or LP Gas | 5 (1.9%) | 0 (0.0%) |
| Electricity | 26 (10.0%) | 10 (24.4%) |
| Fuel Oil or Kerosene | 0 (0.0%) | 0 (0.0%) |
| Coal or Coke | 0 (0.0%) | 0 (0.0%) |
| All other Fuels | 0 (0.0%) | 0 (0.0%) |
| No Fuel Used | 0 (0.0%) | 0 (0.0%) |
| Total | 260 (100.0%) | 41 (100.0%) |
Household Vehicle Usage in Tyrone
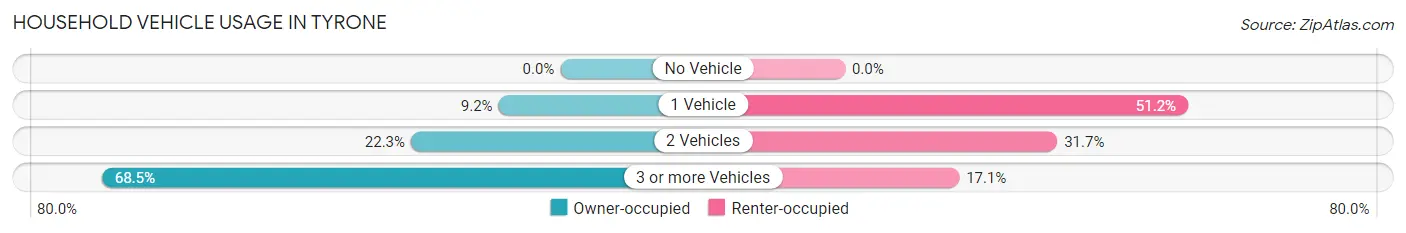
| Vehicles per Household | Owner-occupied | Renter-occupied |
| No Vehicle | 0 (0.0%) | 0 (0.0%) |
| 1 Vehicle | 24 (9.2%) | 21 (51.2%) |
| 2 Vehicles | 58 (22.3%) | 13 (31.7%) |
| 3 or more Vehicles | 178 (68.5%) | 7 (17.1%) |
| Total | 260 (100.0%) | 41 (100.0%) |
Real Estate & Mortgages in Tyrone
Real Estate and Mortgage Overview in Tyrone
| Characteristic | Without Mortgage | With Mortgage |
| Housing Units | 211 | 49 |
| Median Property Value | $55,800 | $145,800 |
| Median Household Income | $2,499 | $2 |
| Monthly Housing Costs | $379 | $0 |
| Real Estate Taxes | $1,605 | $0 |
Property Value by Mortgage Status in Tyrone
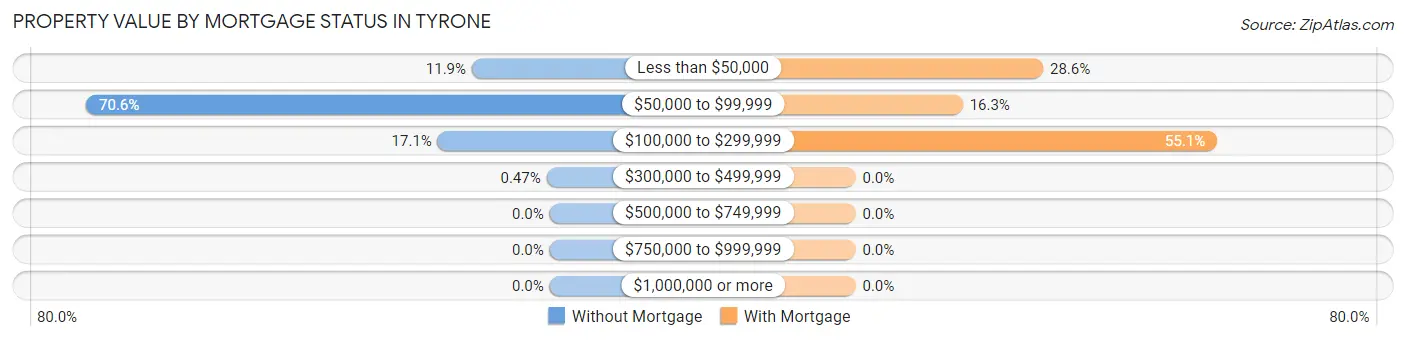
| Property Value | Without Mortgage | With Mortgage |
| Less than $50,000 | 25 (11.8%) | 14 (28.6%) |
| $50,000 to $99,999 | 149 (70.6%) | 8 (16.3%) |
| $100,000 to $299,999 | 36 (17.1%) | 27 (55.1%) |
| $300,000 to $499,999 | 1 (0.5%) | 0 (0.0%) |
| $500,000 to $749,999 | 0 (0.0%) | 0 (0.0%) |
| $750,000 to $999,999 | 0 (0.0%) | 0 (0.0%) |
| $1,000,000 or more | 0 (0.0%) | 0 (0.0%) |
| Total | 211 (100.0%) | 49 (100.0%) |
Household Income by Mortgage Status in Tyrone
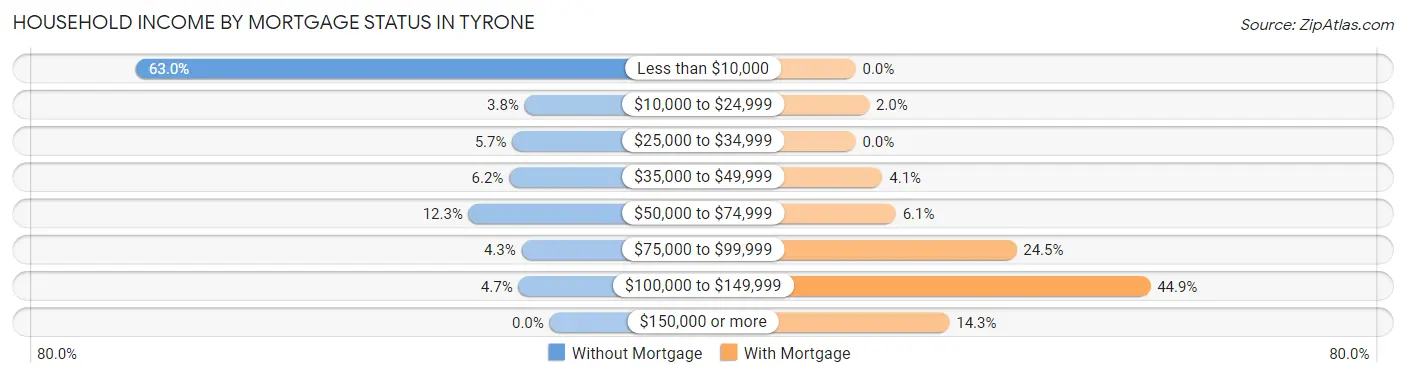
| Household Income | Without Mortgage | With Mortgage |
| Less than $10,000 | 133 (63.0%) | 0 (0.0%) |
| $10,000 to $24,999 | 8 (3.8%) | 1 (2.0%) |
| $25,000 to $34,999 | 12 (5.7%) | 0 (0.0%) |
| $35,000 to $49,999 | 13 (6.2%) | 2 (4.1%) |
| $50,000 to $74,999 | 26 (12.3%) | 3 (6.1%) |
| $75,000 to $99,999 | 9 (4.3%) | 12 (24.5%) |
| $100,000 to $149,999 | 10 (4.7%) | 22 (44.9%) |
| $150,000 or more | 0 (0.0%) | 7 (14.3%) |
| Total | 211 (100.0%) | 49 (100.0%) |
Property Value to Household Income Ratio in Tyrone
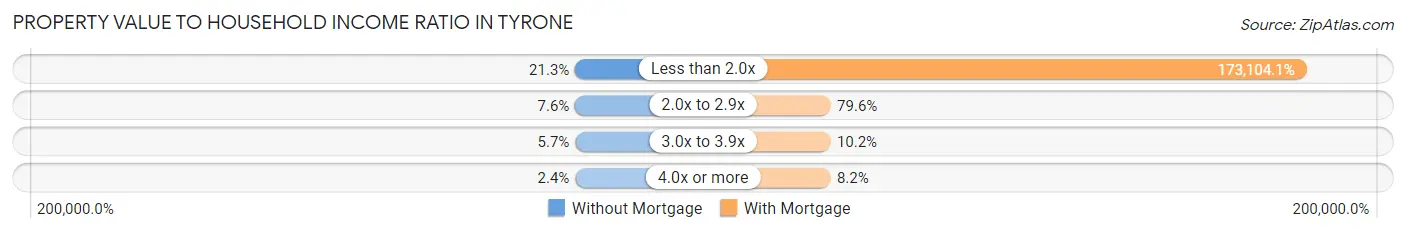
| Value-to-Income Ratio | Without Mortgage | With Mortgage |
| Less than 2.0x | 45 (21.3%) | 84,821 (173,104.1%) |
| 2.0x to 2.9x | 16 (7.6%) | 39 (79.6%) |
| 3.0x to 3.9x | 12 (5.7%) | 5 (10.2%) |
| 4.0x or more | 5 (2.4%) | 4 (8.2%) |
| Total | 211 (100.0%) | 49 (100.0%) |
Real Estate Taxes by Mortgage Status in Tyrone
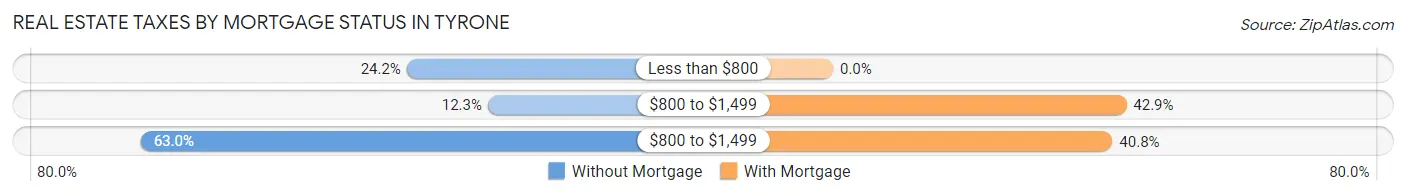
| Property Taxes | Without Mortgage | With Mortgage |
| Less than $800 | 51 (24.2%) | 0 (0.0%) |
| $800 to $1,499 | 26 (12.3%) | 21 (42.9%) |
| $800 to $1,499 | 133 (63.0%) | 20 (40.8%) |
| Total | 211 (100.0%) | 49 (100.0%) |
Health & Disability in Tyrone
Health Insurance Coverage by Age in Tyrone
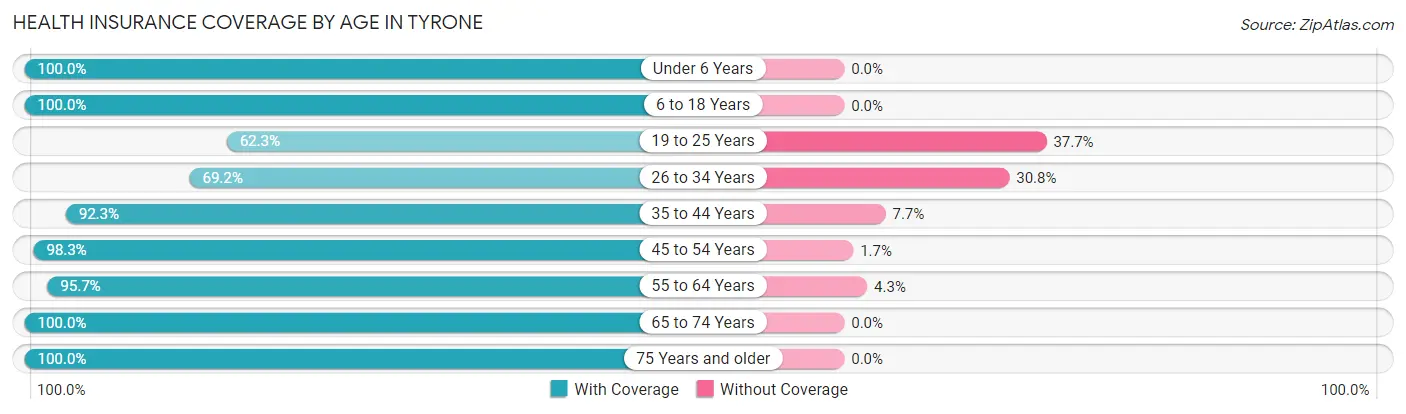
| Age Bracket | With Coverage | Without Coverage |
| Under 6 Years | 56 (100.0%) | 0 (0.0%) |
| 6 to 18 Years | 401 (100.0%) | 0 (0.0%) |
| 19 to 25 Years | 38 (62.3%) | 23 (37.7%) |
| 26 to 34 Years | 54 (69.2%) | 24 (30.8%) |
| 35 to 44 Years | 48 (92.3%) | 4 (7.7%) |
| 45 to 54 Years | 178 (98.3%) | 3 (1.7%) |
| 55 to 64 Years | 90 (95.7%) | 4 (4.3%) |
| 65 to 74 Years | 129 (100.0%) | 0 (0.0%) |
| 75 Years and older | 30 (100.0%) | 0 (0.0%) |
| Total | 1,024 (94.6%) | 58 (5.4%) |
Health Insurance Coverage by Citizenship Status in Tyrone
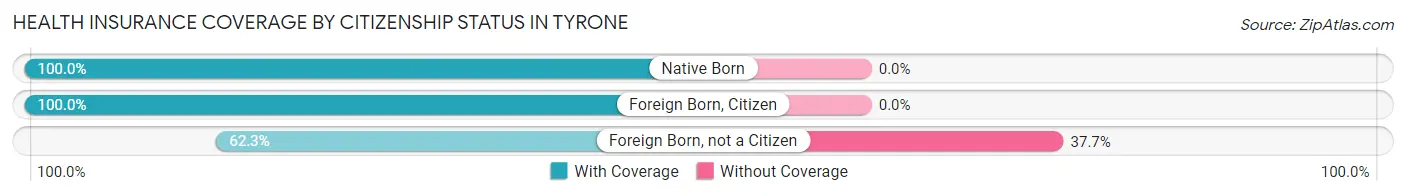
| Citizenship Status | With Coverage | Without Coverage |
| Native Born | 56 (100.0%) | 0 (0.0%) |
| Foreign Born, Citizen | 401 (100.0%) | 0 (0.0%) |
| Foreign Born, not a Citizen | 38 (62.3%) | 23 (37.7%) |
Health Insurance Coverage by Household Income in Tyrone
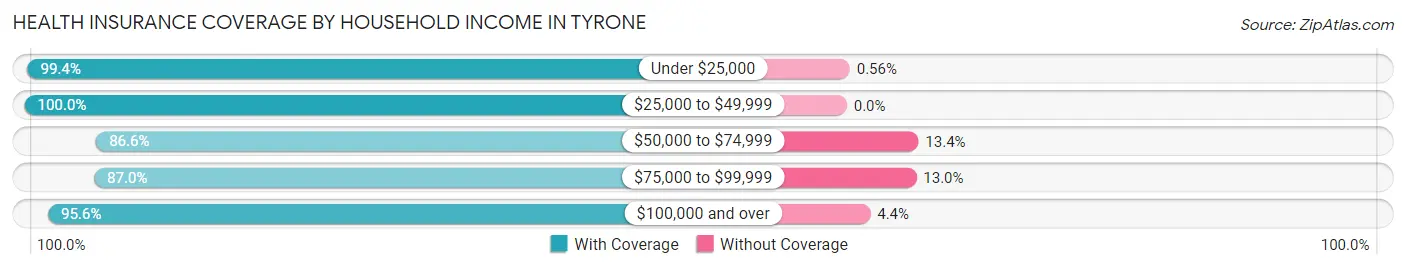
| Household Income | With Coverage | Without Coverage |
| Under $25,000 | 528 (99.4%) | 3 (0.6%) |
| $25,000 to $49,999 | 73 (100.0%) | 0 (0.0%) |
| $50,000 to $74,999 | 129 (86.6%) | 20 (13.4%) |
| $75,000 to $99,999 | 207 (87.0%) | 31 (13.0%) |
| $100,000 and over | 87 (95.6%) | 4 (4.4%) |
Public vs Private Health Insurance Coverage by Age in Tyrone
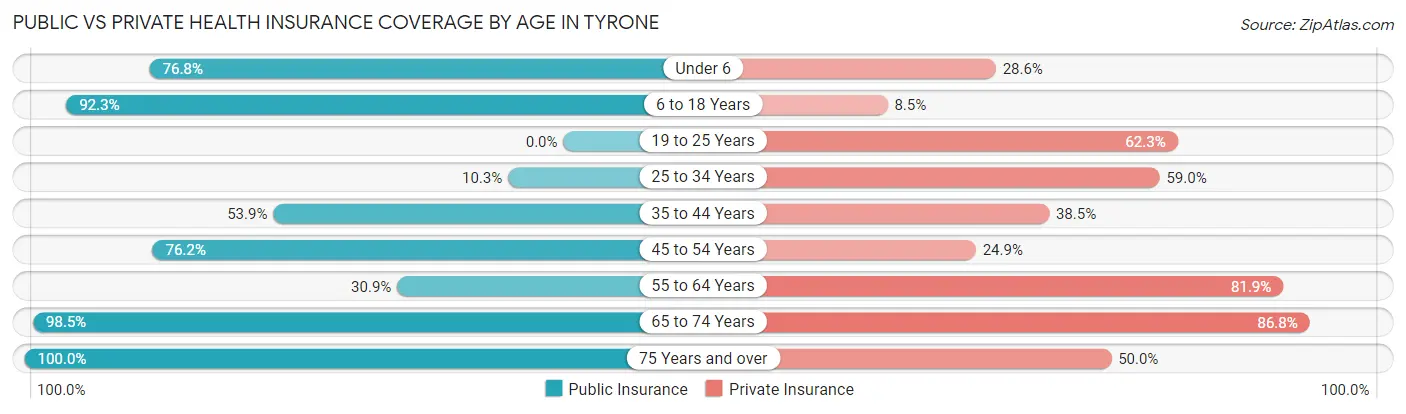
| Age Bracket | Public Insurance | Private Insurance |
| Under 6 | 43 (76.8%) | 16 (28.6%) |
| 6 to 18 Years | 370 (92.3%) | 34 (8.5%) |
| 19 to 25 Years | 0 (0.0%) | 38 (62.3%) |
| 25 to 34 Years | 8 (10.3%) | 46 (59.0%) |
| 35 to 44 Years | 28 (53.8%) | 20 (38.5%) |
| 45 to 54 Years | 138 (76.2%) | 45 (24.9%) |
| 55 to 64 Years | 29 (30.8%) | 77 (81.9%) |
| 65 to 74 Years | 127 (98.5%) | 112 (86.8%) |
| 75 Years and over | 30 (100.0%) | 15 (50.0%) |
| Total | 773 (71.4%) | 403 (37.2%) |
Disability Status by Sex by Age in Tyrone
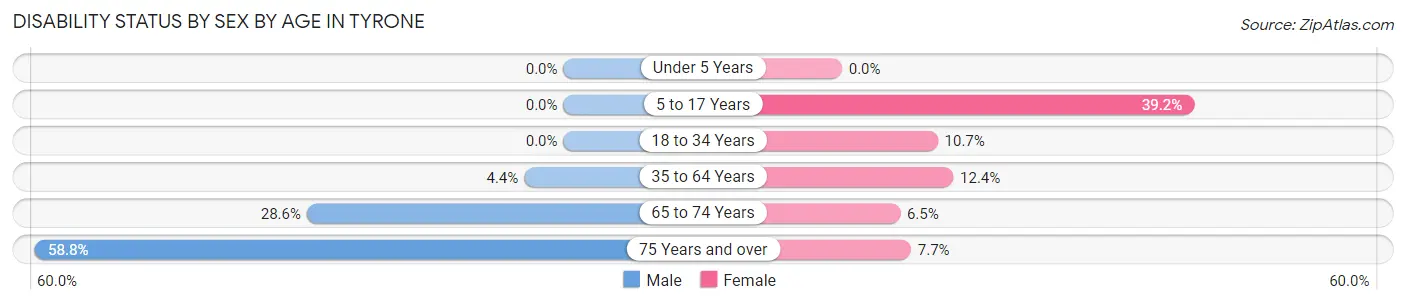
| Age Bracket | Male | Female |
| Under 5 Years | 0 (0.0%) | 0 (0.0%) |
| 5 to 17 Years | 0 (0.0%) | 60 (39.2%) |
| 18 to 34 Years | 0 (0.0%) | 8 (10.7%) |
| 35 to 64 Years | 9 (4.4%) | 15 (12.4%) |
| 65 to 74 Years | 6 (28.6%) | 7 (6.5%) |
| 75 Years and over | 10 (58.8%) | 1 (7.7%) |
Disability Class by Sex by Age in Tyrone
Disability Class: Hearing Difficulty
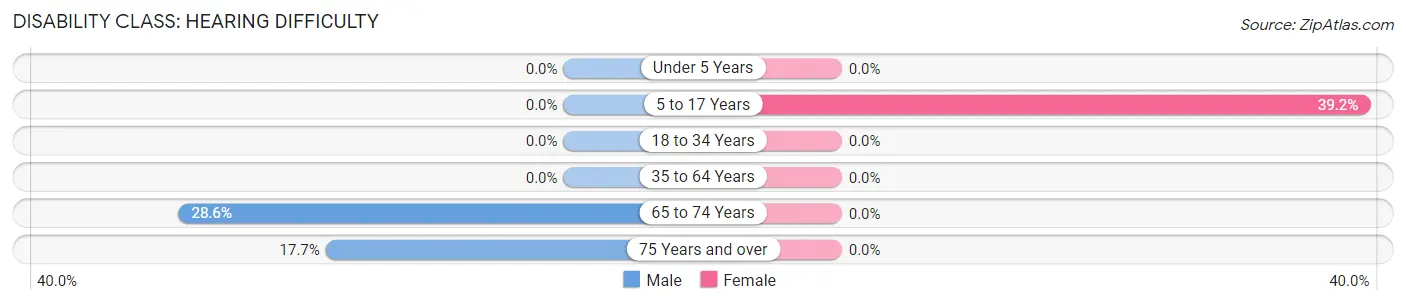
| Age Bracket | Male | Female |
| Under 5 Years | 0 (0.0%) | 0 (0.0%) |
| 5 to 17 Years | 0 (0.0%) | 60 (39.2%) |
| 18 to 34 Years | 0 (0.0%) | 0 (0.0%) |
| 35 to 64 Years | 0 (0.0%) | 0 (0.0%) |
| 65 to 74 Years | 6 (28.6%) | 0 (0.0%) |
| 75 Years and over | 3 (17.6%) | 0 (0.0%) |
Disability Class: Vision Difficulty
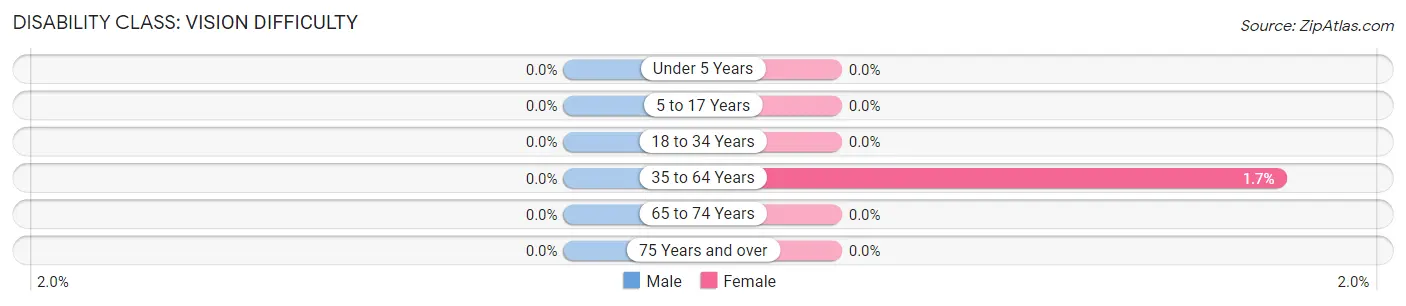
| Age Bracket | Male | Female |
| Under 5 Years | 0 (0.0%) | 0 (0.0%) |
| 5 to 17 Years | 0 (0.0%) | 0 (0.0%) |
| 18 to 34 Years | 0 (0.0%) | 0 (0.0%) |
| 35 to 64 Years | 0 (0.0%) | 2 (1.7%) |
| 65 to 74 Years | 0 (0.0%) | 0 (0.0%) |
| 75 Years and over | 0 (0.0%) | 0 (0.0%) |
Disability Class: Cognitive Difficulty
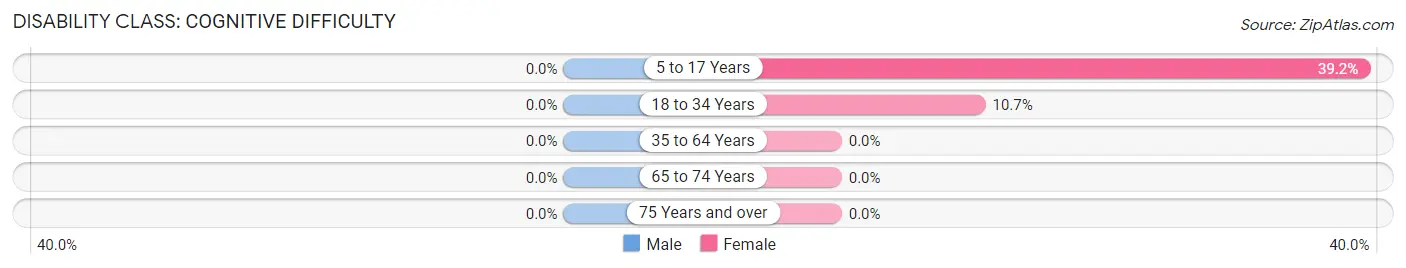
| Age Bracket | Male | Female |
| 5 to 17 Years | 0 (0.0%) | 60 (39.2%) |
| 18 to 34 Years | 0 (0.0%) | 8 (10.7%) |
| 35 to 64 Years | 0 (0.0%) | 0 (0.0%) |
| 65 to 74 Years | 0 (0.0%) | 0 (0.0%) |
| 75 Years and over | 0 (0.0%) | 0 (0.0%) |
Disability Class: Ambulatory Difficulty
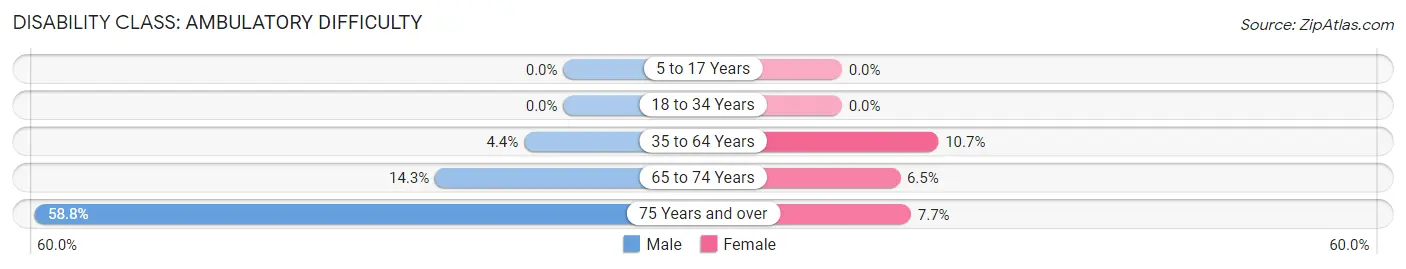
| Age Bracket | Male | Female |
| 5 to 17 Years | 0 (0.0%) | 0 (0.0%) |
| 18 to 34 Years | 0 (0.0%) | 0 (0.0%) |
| 35 to 64 Years | 9 (4.4%) | 13 (10.7%) |
| 65 to 74 Years | 3 (14.3%) | 7 (6.5%) |
| 75 Years and over | 10 (58.8%) | 1 (7.7%) |
Disability Class: Self-Care Difficulty
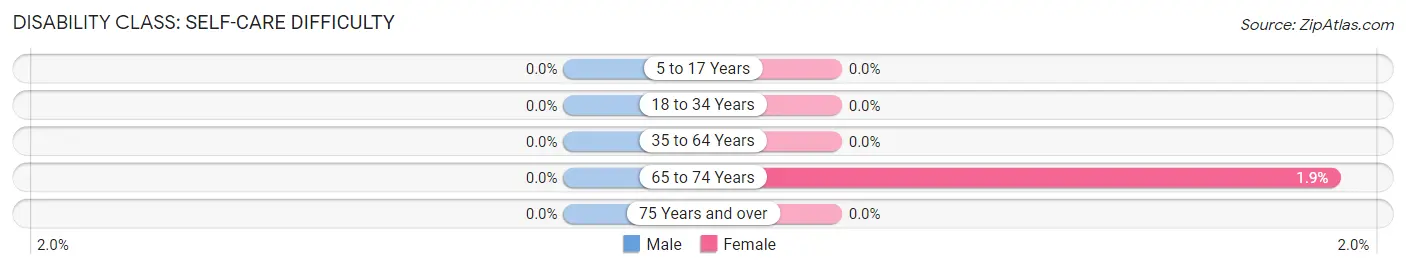
| Age Bracket | Male | Female |
| 5 to 17 Years | 0 (0.0%) | 0 (0.0%) |
| 18 to 34 Years | 0 (0.0%) | 0 (0.0%) |
| 35 to 64 Years | 0 (0.0%) | 0 (0.0%) |
| 65 to 74 Years | 0 (0.0%) | 2 (1.8%) |
| 75 Years and over | 0 (0.0%) | 0 (0.0%) |
Technology Access in Tyrone
Computing Device Access in Tyrone
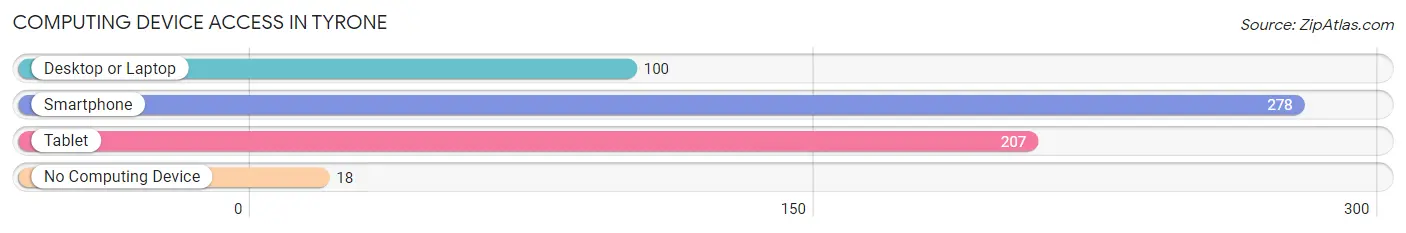
| Device Type | # Households | % Households |
| Desktop or Laptop | 100 | 33.2% |
| Smartphone | 278 | 92.4% |
| Tablet | 207 | 68.8% |
| No Computing Device | 18 | 6.0% |
| Total | 301 | 100.0% |
Internet Access in Tyrone
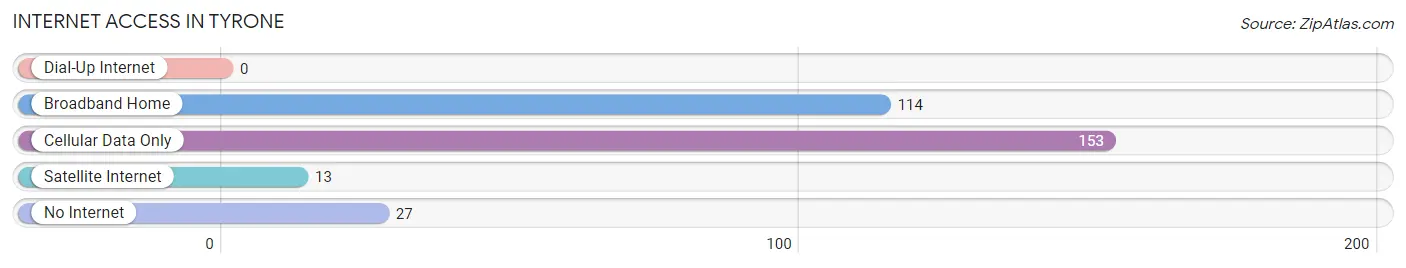
| Internet Type | # Households | % Households |
| Dial-Up Internet | 0 | 0.0% |
| Broadband Home | 114 | 37.9% |
| Cellular Data Only | 153 | 50.8% |
| Satellite Internet | 13 | 4.3% |
| No Internet | 27 | 9.0% |
| Total | 301 | 100.0% |
Tyrone Summary
Tyrone is a small town located in the southwestern corner of Oklahoma, in the United States. It is situated in the foothills of the Wichita Mountains, and is part of the Lawton metropolitan area. The town has a population of just over 1,000 people, and is known for its rural charm and friendly atmosphere.
History
Tyrone was founded in 1891 by a group of settlers from Texas. The town was named after the town of Tyrone, Texas, which was named after the Irish county of Tyrone. The settlers were attracted to the area by the abundance of natural resources, including timber, coal, and water. The town quickly grew, and by the early 1900s, it had become a thriving community.
In the early 1900s, the town was home to several businesses, including a general store, a blacksmith shop, a livery stable, and a hotel. The town also had a school, a post office, and a church. In the 1920s, the town was connected to the rest of the state by the Oklahoma and Gulf Railroad.
Geography
Tyrone is located in southwestern Oklahoma, in the foothills of the Wichita Mountains. The town is situated at an elevation of 1,400 feet, and is surrounded by rolling hills and grasslands. The town is located about 25 miles from Lawton, the nearest major city.
The climate in Tyrone is semi-arid, with hot summers and mild winters. The average annual temperature is around 65 degrees Fahrenheit, and the average annual precipitation is around 25 inches.
Economy
Tyrone’s economy is largely based on agriculture and tourism. The town is home to several farms, which produce a variety of crops, including wheat, corn, and hay. The town is also home to several tourist attractions, including the Wichita Mountains Wildlife Refuge, the Meers Store and Restaurant, and the Medicine Park Aquarium.
Demographics
As of the 2010 census, the population of Tyrone was 1,072. The racial makeup of the town was 95.3% White, 0.9% African American, 0.7% Native American, 0.2% Asian, 0.1% Pacific Islander, and 2.8% from other races. The median household income was $35,000, and the median family income was $41,000.
Tyrone is a small town with a rich history and a friendly atmosphere. The town is home to a variety of businesses and attractions, and is a popular destination for tourists. The town’s economy is largely based on agriculture and tourism, and the population is diverse and welcoming.
Common Questions
What is Per Capita Income in Tyrone?
Per Capita income in Tyrone is $16,488.
What is the Median Family Income in Tyrone?
Median Family Income in Tyrone is $2,499.
What is Income or Wage Gap in Tyrone?
Income or Wage Gap in Tyrone is 43.2%.
Women in Tyrone earn 56.8 cents for every dollar earned by a man.
What is Inequality or Gini Index in Tyrone?
Inequality or Gini Index in Tyrone is 0.63.
What is the Total Population of Tyrone?
Total Population of Tyrone is 1,082.
What is the Total Male Population of Tyrone?
Total Male Population of Tyrone is 600.
What is the Total Female Population of Tyrone?
Total Female Population of Tyrone is 482.
What is the Ratio of Males per 100 Females in Tyrone?
There are 124.48 Males per 100 Females in Tyrone.
What is the Ratio of Females per 100 Males in Tyrone?
There are 80.33 Females per 100 Males in Tyrone.
What is the Median Population Age in Tyrone?
Median Population Age in Tyrone is 26.9 Years.
What is the Average Family Size in Tyrone
Average Family Size in Tyrone is 3.5 People.
What is the Average Household Size in Tyrone
Average Household Size in Tyrone is 3.6 People.
How Large is the Labor Force in Tyrone?
There are 240 People in the Labor Forcein in Tyrone.
What is the Percentage of People in the Labor Force in Tyrone?
32.6% of People are in the Labor Force in Tyrone.