Keota, OK Map & Demographics
Keota Map
Keota Overview
$18,239
PER CAPITA INCOME
$48,750
AVG FAMILY INCOME
$38,472
AVG HOUSEHOLD INCOME
47.6%
WAGE / INCOME GAP [ % ]
52.4¢/ $1
WAGE / INCOME GAP [ $ ]
0.39
INEQUALITY / GINI INDEX
525
TOTAL POPULATION
218
MALE POPULATION
307
FEMALE POPULATION
71.01
MALES / 100 FEMALES
140.83
FEMALES / 100 MALES
39.6
MEDIAN AGE
3.3
AVG FAMILY SIZE
2.6
AVG HOUSEHOLD SIZE
169
LABOR FORCE [ PEOPLE ]
40.3%
PERCENT IN LABOR FORCE
Keota Zip Codes
Keota Area Codes
Income in Keota
Income Overview in Keota
Per Capita Income in Keota is $18,239, while median incomes of families and households are $48,750 and $38,472 respectively.
| Characteristic | Number | Measure |
| Per Capita Income | 525 | $18,239 |
| Median Family Income | 117 | $48,750 |
| Mean Family Income | 117 | $56,590 |
| Median Household Income | 199 | $38,472 |
| Mean Household Income | 199 | $45,194 |
| Income Deficit | 117 | $0 |
| Wage / Income Gap (%) | 525 | 47.64% |
| Wage / Income Gap ($) | 525 | 52.36¢ per $1 |
| Gini / Inequality Index | 525 | 0.39 |
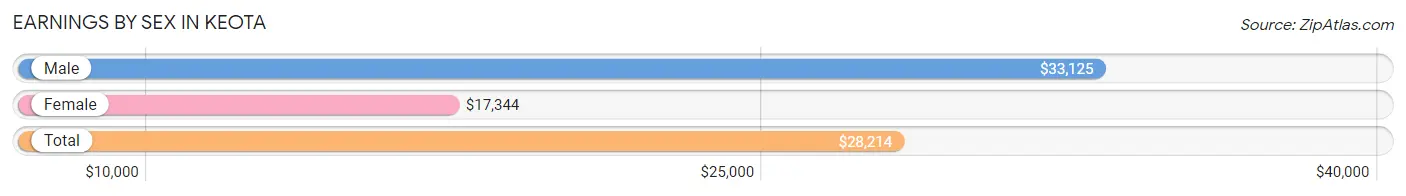
Earnings by Sex in Keota
Average Earnings in Keota are $28,214, $33,125 for men and $17,344 for women, a difference of 47.6%.
| Sex | Number | Average Earnings |
| Male | 97 (47.5%) | $33,125 |
| Female | 107 (52.4%) | $17,344 |
| Total | 204 (100.0%) | $28,214 |
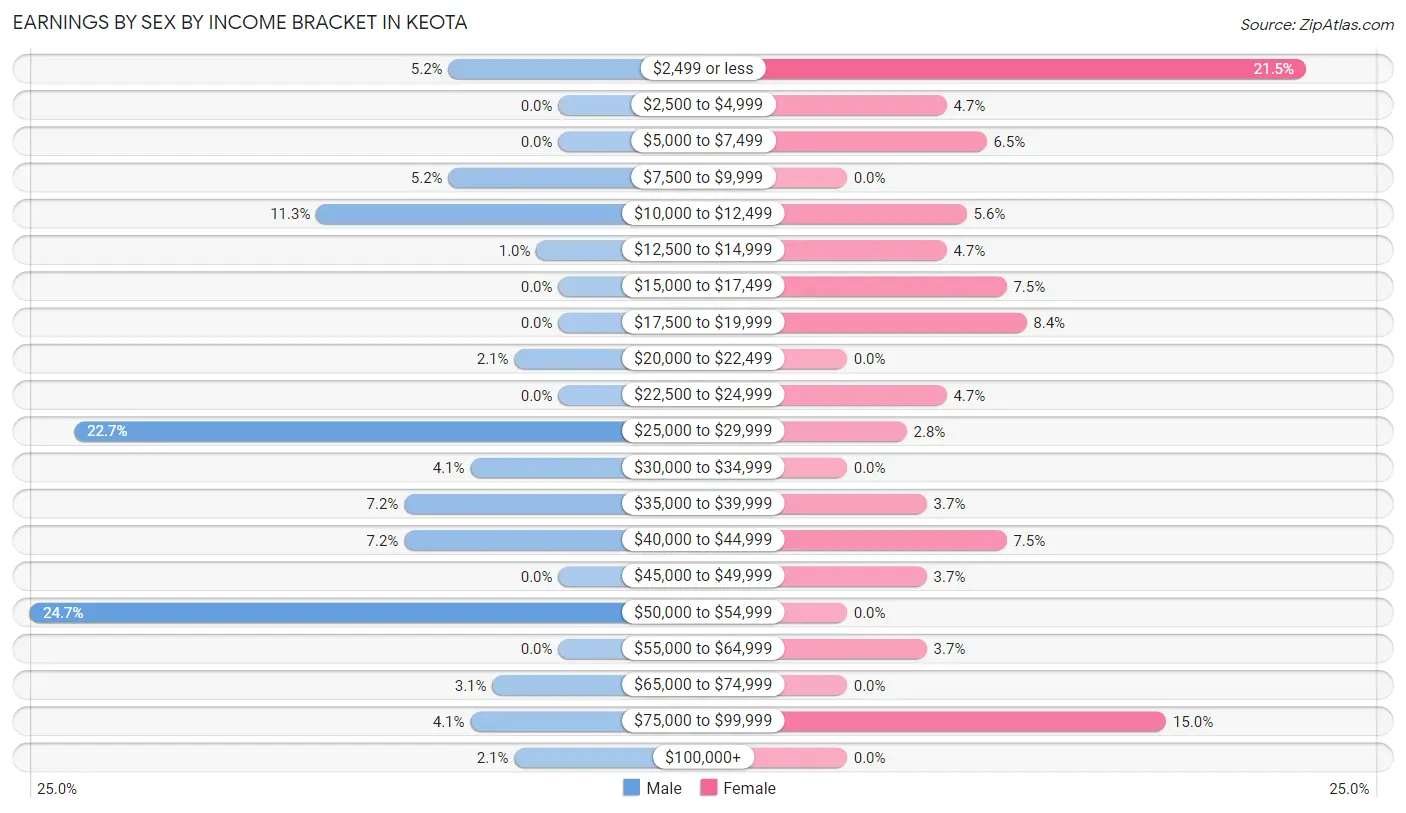
Earnings by Sex by Income Bracket in Keota
The most common earnings brackets in Keota are $50,000 to $54,999 for men (24 | 24.7%) and $2,499 or less for women (23 | 21.5%).
| Income | Male | Female |
| $2,499 or less | 5 (5.1%) | 23 (21.5%) |
| $2,500 to $4,999 | 0 (0.0%) | 5 (4.7%) |
| $5,000 to $7,499 | 0 (0.0%) | 7 (6.5%) |
| $7,500 to $9,999 | 5 (5.1%) | 0 (0.0%) |
| $10,000 to $12,499 | 11 (11.3%) | 6 (5.6%) |
| $12,500 to $14,999 | 1 (1.0%) | 5 (4.7%) |
| $15,000 to $17,499 | 0 (0.0%) | 8 (7.5%) |
| $17,500 to $19,999 | 0 (0.0%) | 9 (8.4%) |
| $20,000 to $22,499 | 2 (2.1%) | 0 (0.0%) |
| $22,500 to $24,999 | 0 (0.0%) | 5 (4.7%) |
| $25,000 to $29,999 | 22 (22.7%) | 3 (2.8%) |
| $30,000 to $34,999 | 4 (4.1%) | 0 (0.0%) |
| $35,000 to $39,999 | 7 (7.2%) | 4 (3.7%) |
| $40,000 to $44,999 | 7 (7.2%) | 8 (7.5%) |
| $45,000 to $49,999 | 0 (0.0%) | 4 (3.7%) |
| $50,000 to $54,999 | 24 (24.7%) | 0 (0.0%) |
| $55,000 to $64,999 | 0 (0.0%) | 4 (3.7%) |
| $65,000 to $74,999 | 3 (3.1%) | 0 (0.0%) |
| $75,000 to $99,999 | 4 (4.1%) | 16 (14.9%) |
| $100,000+ | 2 (2.1%) | 0 (0.0%) |
| Total | 97 (100.0%) | 107 (100.0%) |
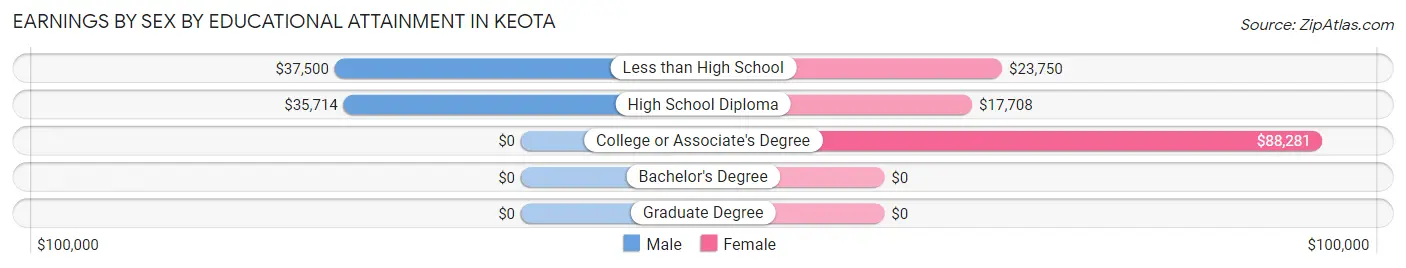
Earnings by Sex by Educational Attainment in Keota
Average earnings in Keota are $35,536 for men and $24,000 for women, a difference of 32.5%. Men with an educational attainment of less than high school enjoy the highest average annual earnings of $37,500, while those with high school diploma education earn the least with $35,714. Women with an educational attainment of college or associate's degree earn the most with the average annual earnings of $88,281, while those with high school diploma education have the smallest earnings of $17,708.
| Educational Attainment | Male Income | Female Income |
| Less than High School | $37,500 | $23,750 |
| High School Diploma | $35,714 | $17,708 |
| College or Associate's Degree | - | - |
| Bachelor's Degree | - | - |
| Graduate Degree | - | - |
| Total | $35,536 | $24,000 |
Family Income in Keota
Family Income Brackets in Keota
According to the Keota family income data, there are 24 families falling into the $35,000 to $49,999 income range, which is the most common income bracket and makes up 20.5% of all families.
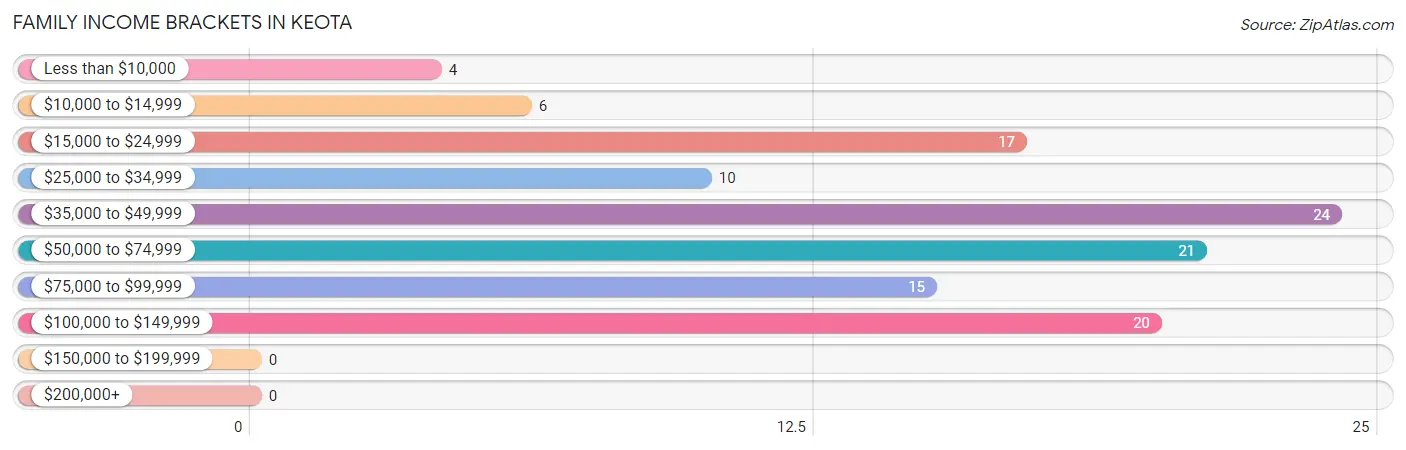
| Income Bracket | # Families | % Families |
| Less than $10,000 | 4 | 3.4% |
| $10,000 to $14,999 | 6 | 5.1% |
| $15,000 to $24,999 | 17 | 14.5% |
| $25,000 to $34,999 | 10 | 8.5% |
| $35,000 to $49,999 | 24 | 20.5% |
| $50,000 to $74,999 | 21 | 17.9% |
| $75,000 to $99,999 | 15 | 12.8% |
| $100,000 to $149,999 | 20 | 17.1% |
| $150,000 to $199,999 | 0 | 0.0% |
| $200,000+ | 0 | 0.0% |
Family Income by Famaliy Size in Keota
2-person families (55 | 47.0%) account for the highest median family income in Keota with $64,583 per family, while 2-person families (55 | 47.0%) have the highest median income of $32,292 per family member.
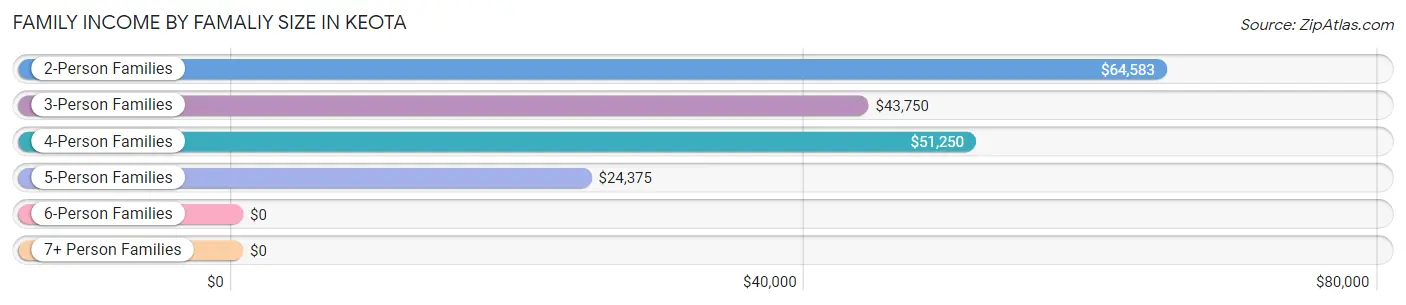
| Income Bracket | # Families | Median Income |
| 2-Person Families | 55 (47.0%) | $64,583 |
| 3-Person Families | 33 (28.2%) | $43,750 |
| 4-Person Families | 18 (15.4%) | $51,250 |
| 5-Person Families | 7 (6.0%) | $24,375 |
| 6-Person Families | 2 (1.7%) | $0 |
| 7+ Person Families | 2 (1.7%) | $0 |
| Total | 117 (100.0%) | $48,750 |
Family Income by Number of Earners in Keota
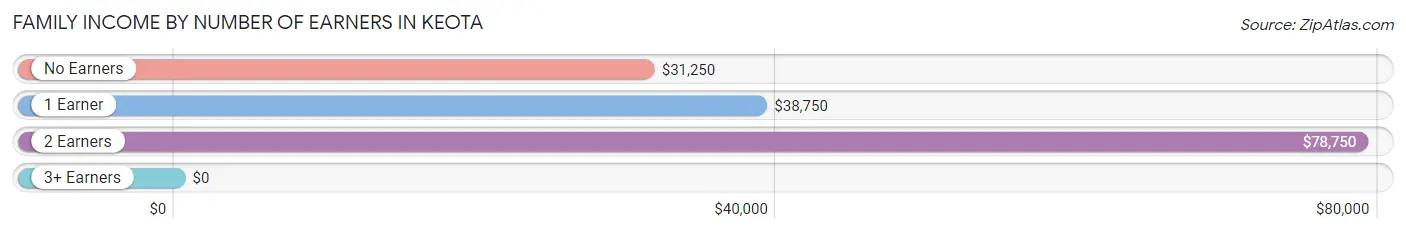
| Number of Earners | # Families | Median Income |
| No Earners | 26 (22.2%) | $31,250 |
| 1 Earner | 42 (35.9%) | $38,750 |
| 2 Earners | 40 (34.2%) | $78,750 |
| 3+ Earners | 9 (7.7%) | $0 |
| Total | 117 (100.0%) | $48,750 |
Household Income in Keota
Household Income Brackets in Keota
With 52 households falling in the category, the $15,000 to $24,999 income range is the most frequent in Keota, accounting for 26.1% of all households.
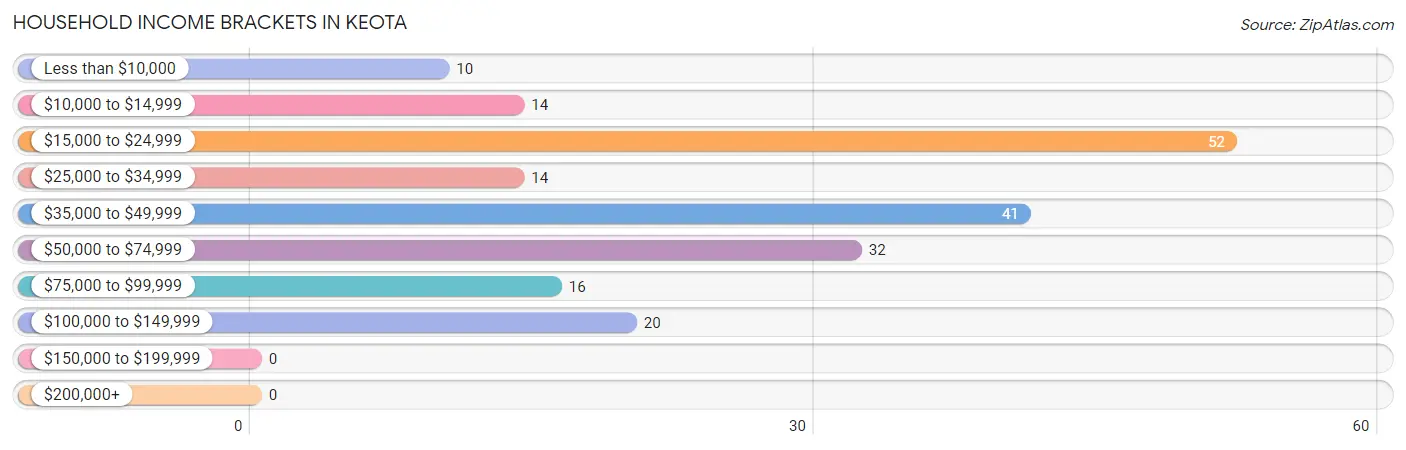
| Income Bracket | # Households | % Households |
| Less than $10,000 | 10 | 5.0% |
| $10,000 to $14,999 | 14 | 7.0% |
| $15,000 to $24,999 | 52 | 26.1% |
| $25,000 to $34,999 | 14 | 7.0% |
| $35,000 to $49,999 | 41 | 20.6% |
| $50,000 to $74,999 | 32 | 16.1% |
| $75,000 to $99,999 | 16 | 8.0% |
| $100,000 to $149,999 | 20 | 10.1% |
| $150,000 to $199,999 | 0 | 0.0% |
| $200,000+ | 0 | 0.0% |
Household Income by Householder Age in Keota
The median household income in Keota is $38,472, with the highest median household income of $55,625 found in the 45 to 64 years age bracket for the primary householder. A total of 77 households (38.7%) fall into this category. Meanwhile, the 15 to 24 years age bracket for the primary householder has the lowest median household income of $0, with 6 households (3.0%) in this group.
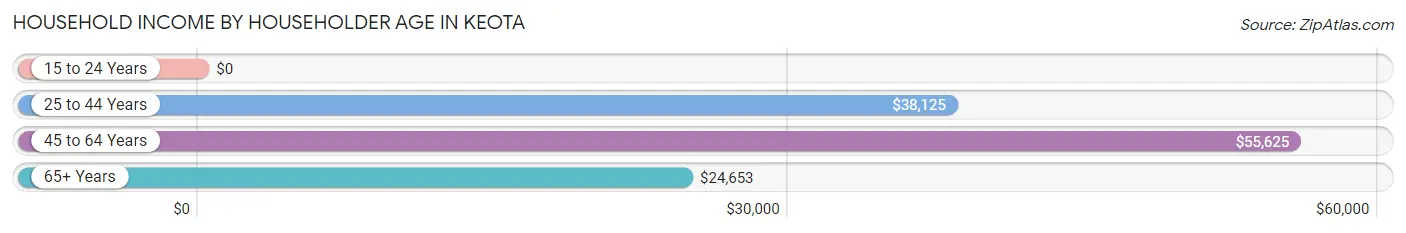
| Income Bracket | # Households | Median Income |
| 15 to 24 Years | 6 (3.0%) | $0 |
| 25 to 44 Years | 43 (21.6%) | $38,125 |
| 45 to 64 Years | 77 (38.7%) | $55,625 |
| 65+ Years | 73 (36.7%) | $24,653 |
| Total | 199 (100.0%) | $38,472 |
Poverty in Keota
Income Below Poverty by Sex and Age in Keota
With 39.9% poverty level for males and 31.6% for females among the residents of Keota, under 5 year old males and 15 year old females are the most vulnerable to poverty, with 2 males (100.0%) and 2 females (66.7%) in their respective age groups living below the poverty level.
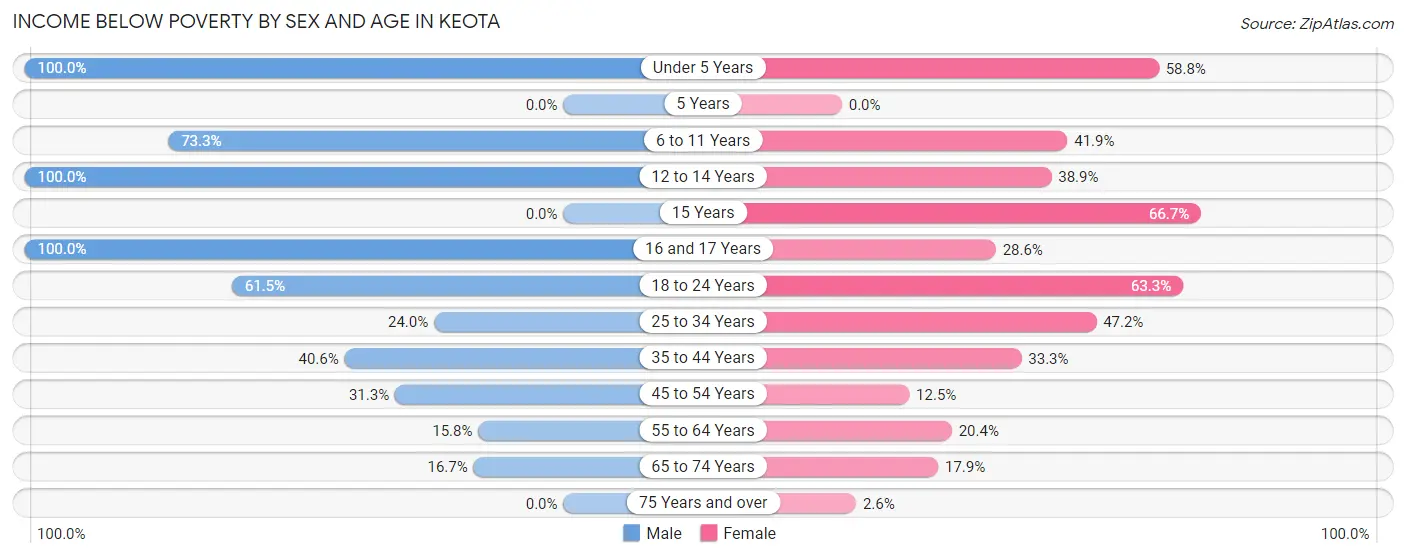
| Age Bracket | Male | Female |
| Under 5 Years | 2 (100.0%) | 10 (58.8%) |
| 5 Years | 0 (0.0%) | 0 (0.0%) |
| 6 to 11 Years | 11 (73.3%) | 18 (41.9%) |
| 12 to 14 Years | 6 (100.0%) | 7 (38.9%) |
| 15 Years | 0 (0.0%) | 2 (66.7%) |
| 16 and 17 Years | 15 (100.0%) | 2 (28.6%) |
| 18 to 24 Years | 16 (61.5%) | 19 (63.3%) |
| 25 to 34 Years | 6 (24.0%) | 17 (47.2%) |
| 35 to 44 Years | 13 (40.6%) | 2 (33.3%) |
| 45 to 54 Years | 10 (31.2%) | 4 (12.5%) |
| 55 to 64 Years | 6 (15.8%) | 10 (20.4%) |
| 65 to 74 Years | 2 (16.7%) | 5 (17.9%) |
| 75 Years and over | 0 (0.0%) | 1 (2.6%) |
| Total | 87 (39.9%) | 97 (31.6%) |
Income Above Poverty by Sex and Age in Keota
According to the poverty statistics in Keota, males aged 5 years and females aged 75 years and over are the age groups that are most secure financially, with 100.0% of males and 97.4% of females in these age groups living above the poverty line.
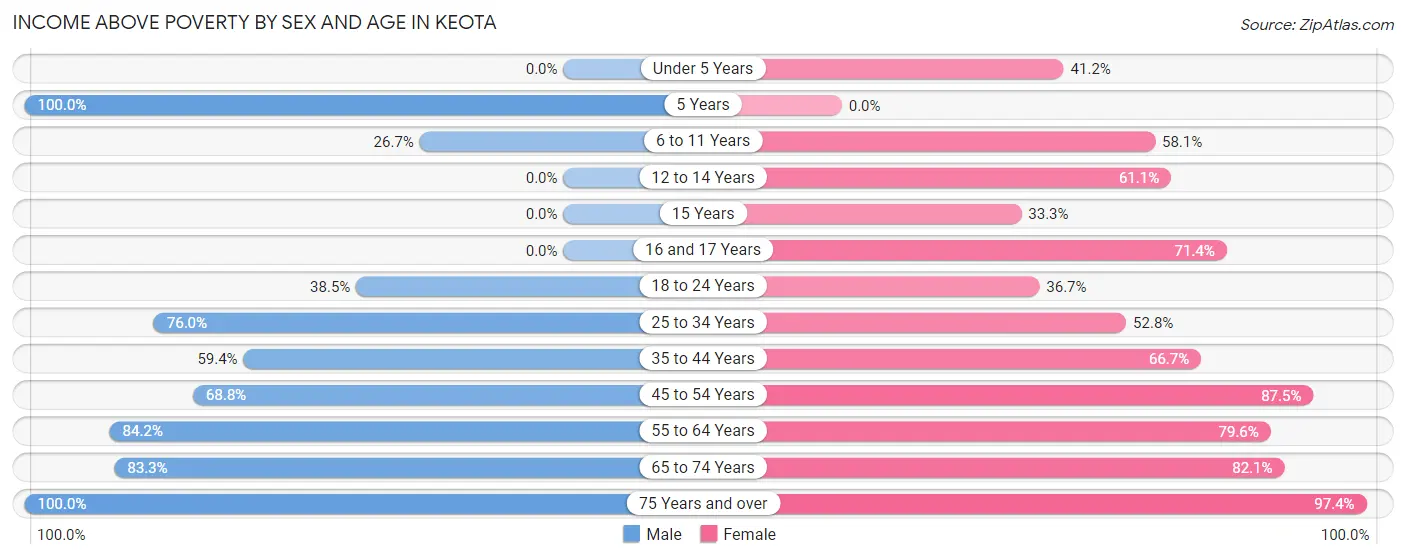
| Age Bracket | Male | Female |
| Under 5 Years | 0 (0.0%) | 7 (41.2%) |
| 5 Years | 2 (100.0%) | 0 (0.0%) |
| 6 to 11 Years | 4 (26.7%) | 25 (58.1%) |
| 12 to 14 Years | 0 (0.0%) | 11 (61.1%) |
| 15 Years | 0 (0.0%) | 1 (33.3%) |
| 16 and 17 Years | 0 (0.0%) | 5 (71.4%) |
| 18 to 24 Years | 10 (38.5%) | 11 (36.7%) |
| 25 to 34 Years | 19 (76.0%) | 19 (52.8%) |
| 35 to 44 Years | 19 (59.4%) | 4 (66.7%) |
| 45 to 54 Years | 22 (68.8%) | 28 (87.5%) |
| 55 to 64 Years | 32 (84.2%) | 39 (79.6%) |
| 65 to 74 Years | 10 (83.3%) | 23 (82.1%) |
| 75 Years and over | 13 (100.0%) | 37 (97.4%) |
| Total | 131 (60.1%) | 210 (68.4%) |
Income Below Poverty Among Married-Couple Families in Keota
The poverty statistics for married-couple families in Keota show that 12.9% or 9 of the total 70 families live below the poverty line. Families with 5 or more children have the highest poverty rate of 100.0%, comprising of 2 families. On the other hand, families with no children have the lowest poverty rate of 0.0%, which includes 0 families.
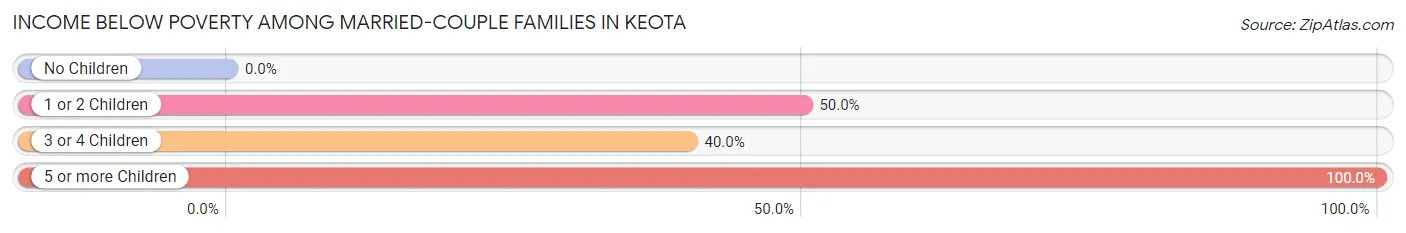
| Children | Above Poverty | Below Poverty |
| No Children | 53 (100.0%) | 0 (0.0%) |
| 1 or 2 Children | 5 (50.0%) | 5 (50.0%) |
| 3 or 4 Children | 3 (60.0%) | 2 (40.0%) |
| 5 or more Children | 0 (0.0%) | 2 (100.0%) |
| Total | 61 (87.1%) | 9 (12.9%) |
Income Below Poverty Among Single-Parent Households in Keota
According to the poverty data in Keota, 40.0% or 4 single-father households and 35.1% or 13 single-mother households are living below the poverty line. Among single-father households, those with 1 or 2 children have the highest poverty rate, with 4 households (50.0%) experiencing poverty. Likewise, among single-mother households, those with 3 or 4 children have the highest poverty rate, with 2 households (100.0%) falling below the poverty line.
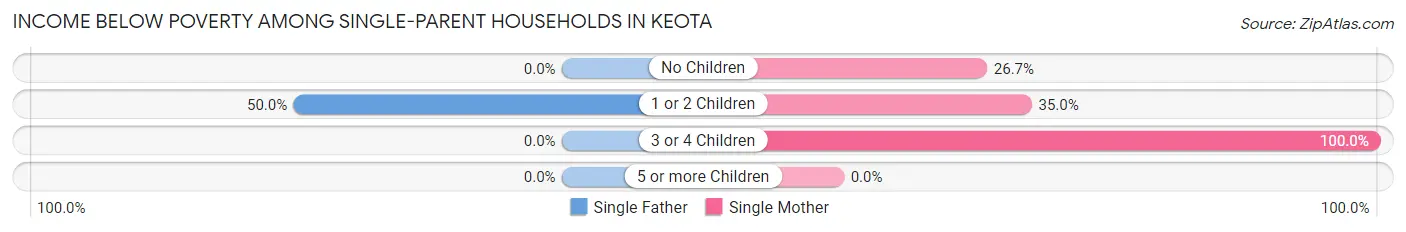
| Children | Single Father | Single Mother |
| No Children | 0 (0.0%) | 4 (26.7%) |
| 1 or 2 Children | 4 (50.0%) | 7 (35.0%) |
| 3 or 4 Children | 0 (0.0%) | 2 (100.0%) |
| 5 or more Children | 0 (0.0%) | 0 (0.0%) |
| Total | 4 (40.0%) | 13 (35.1%) |
Income Below Poverty Among Married-Couple vs Single-Parent Households in Keota
The poverty data for Keota shows that 9 of the married-couple family households (12.9%) and 17 of the single-parent households (36.2%) are living below the poverty level. Within the married-couple family households, those with 5 or more children have the highest poverty rate, with 2 households (100.0%) falling below the poverty line. Among the single-parent households, those with 3 or 4 children have the highest poverty rate, with 2 household (100.0%) living below poverty.
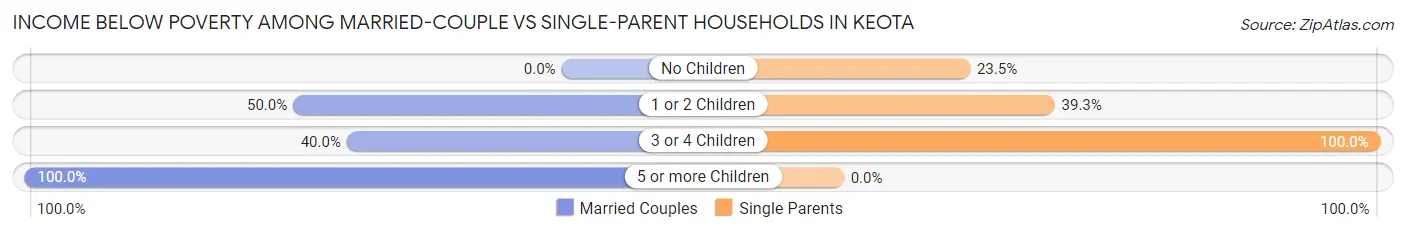
| Children | Married-Couple Families | Single-Parent Households |
| No Children | 0 (0.0%) | 4 (23.5%) |
| 1 or 2 Children | 5 (50.0%) | 11 (39.3%) |
| 3 or 4 Children | 2 (40.0%) | 2 (100.0%) |
| 5 or more Children | 2 (100.0%) | 0 (0.0%) |
| Total | 9 (12.9%) | 17 (36.2%) |
Race in Keota
The most populous races in Keota are White / Caucasian (415 | 79.0%), Native / Alaskan (59 | 11.2%), and Two or more Races (51 | 9.7%).
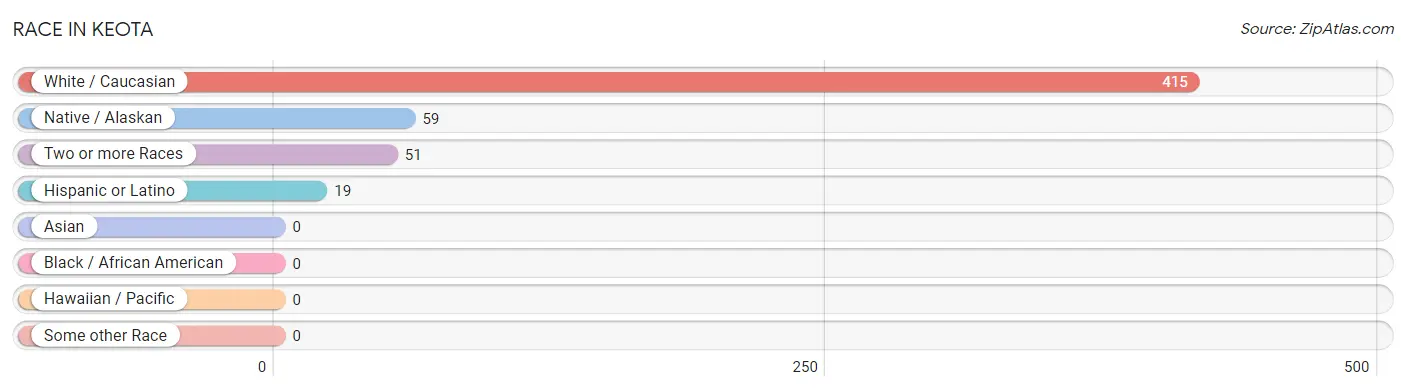
| Race | # Population | % Population |
| Asian | 0 | 0.0% |
| Black / African American | 0 | 0.0% |
| Hawaiian / Pacific | 0 | 0.0% |
| Hispanic or Latino | 19 | 3.6% |
| Native / Alaskan | 59 | 11.2% |
| White / Caucasian | 415 | 79.0% |
| Two or more Races | 51 | 9.7% |
| Some other Race | 0 | 0.0% |
| Total | 525 | 100.0% |
Ancestry in Keota
The most populous ancestries reported in Keota are Choctaw (88 | 16.8%), Irish (62 | 11.8%), English (36 | 6.9%), German (32 | 6.1%), and Dutch (20 | 3.8%), together accounting for 45.3% of all Keota residents.
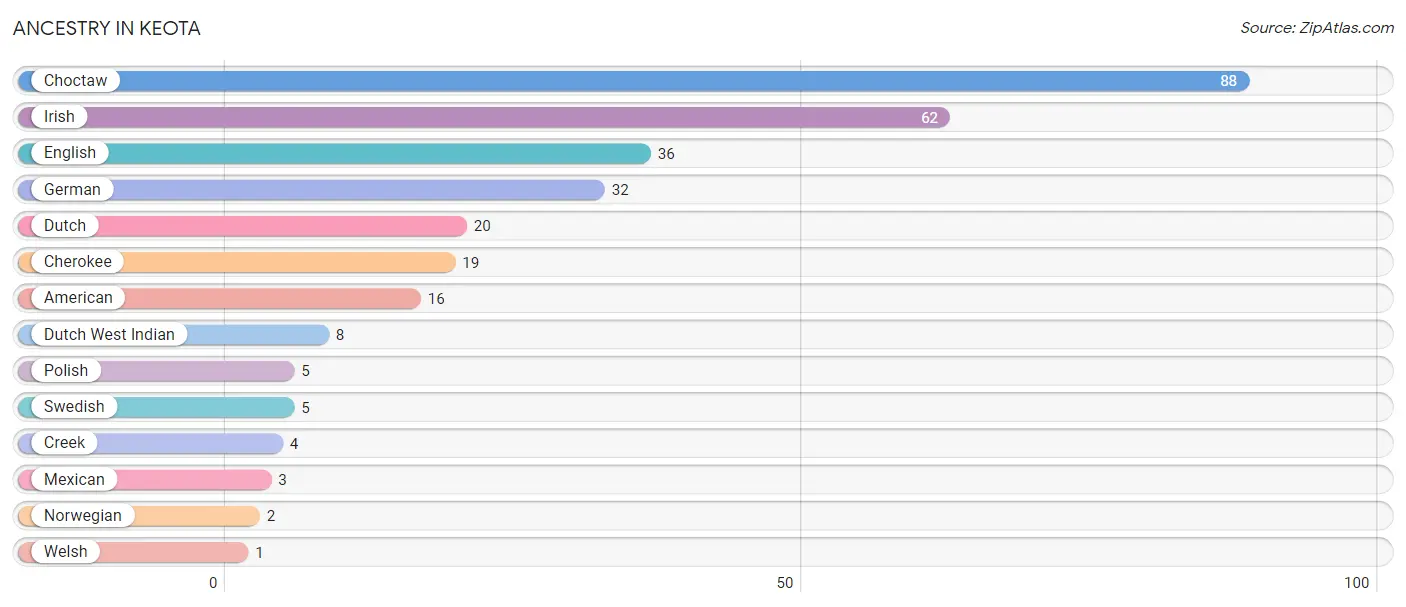
| Ancestry | # Population | % Population |
| American | 16 | 3.0% |
| Cherokee | 19 | 3.6% |
| Choctaw | 88 | 16.8% |
| Creek | 4 | 0.8% |
| Dutch | 20 | 3.8% |
| Dutch West Indian | 8 | 1.5% |
| English | 36 | 6.9% |
| German | 32 | 6.1% |
| Irish | 62 | 11.8% |
| Mexican | 3 | 0.6% |
| Norwegian | 2 | 0.4% |
| Polish | 5 | 0.9% |
| Swedish | 5 | 0.9% |
| Welsh | 1 | 0.2% | View All 14 Rows |
Immigrants in Keota

| Immigration Origin | # Population | % Population | View All 0 Rows |
Sex and Age in Keota
Sex and Age in Keota
The most populous age groups in Keota are 60 to 64 Years (29 | 13.3%) for men and 5 to 9 Years (32 | 10.4%) for women.
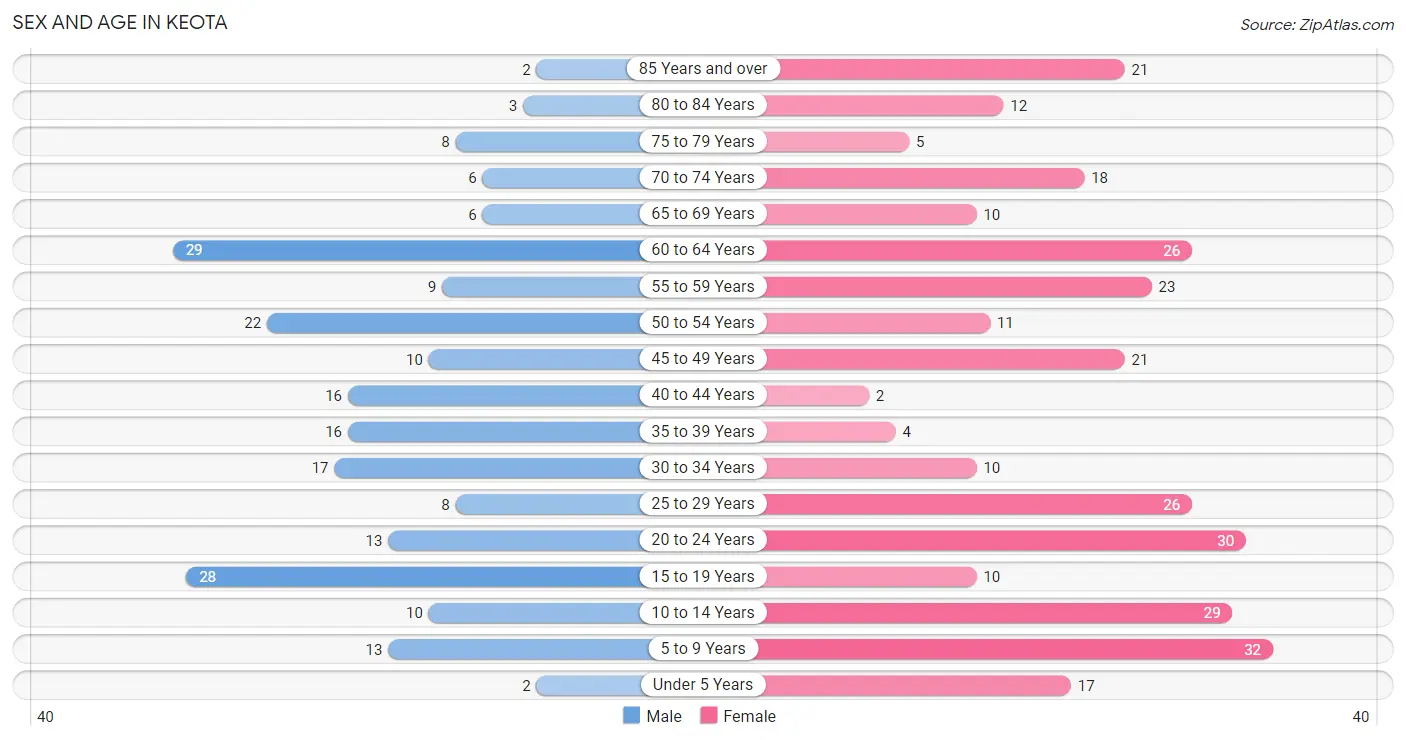
| Age Bracket | Male | Female |
| Under 5 Years | 2 (0.9%) | 17 (5.5%) |
| 5 to 9 Years | 13 (6.0%) | 32 (10.4%) |
| 10 to 14 Years | 10 (4.6%) | 29 (9.5%) |
| 15 to 19 Years | 28 (12.8%) | 10 (3.3%) |
| 20 to 24 Years | 13 (6.0%) | 30 (9.8%) |
| 25 to 29 Years | 8 (3.7%) | 26 (8.5%) |
| 30 to 34 Years | 17 (7.8%) | 10 (3.3%) |
| 35 to 39 Years | 16 (7.3%) | 4 (1.3%) |
| 40 to 44 Years | 16 (7.3%) | 2 (0.6%) |
| 45 to 49 Years | 10 (4.6%) | 21 (6.8%) |
| 50 to 54 Years | 22 (10.1%) | 11 (3.6%) |
| 55 to 59 Years | 9 (4.1%) | 23 (7.5%) |
| 60 to 64 Years | 29 (13.3%) | 26 (8.5%) |
| 65 to 69 Years | 6 (2.8%) | 10 (3.3%) |
| 70 to 74 Years | 6 (2.8%) | 18 (5.9%) |
| 75 to 79 Years | 8 (3.7%) | 5 (1.6%) |
| 80 to 84 Years | 3 (1.4%) | 12 (3.9%) |
| 85 Years and over | 2 (0.9%) | 21 (6.8%) |
| Total | 218 (100.0%) | 307 (100.0%) |
Families and Households in Keota
Median Family Size in Keota
The median family size in Keota is 3.27 persons per family, with single female/mother families (37 | 31.6%) accounting for the largest median family size of 3.32 persons per family. On the other hand, single male/father families (10 | 8.6%) represent the smallest median family size with 3.10 persons per family.
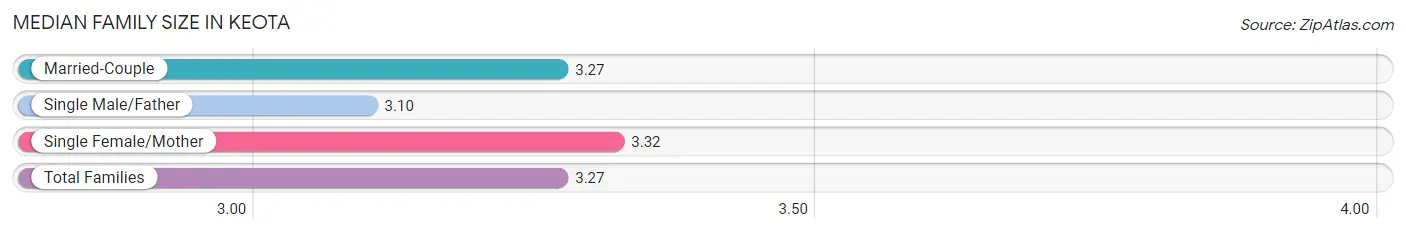
| Family Type | # Families | Family Size |
| Married-Couple | 70 (59.8%) | 3.27 |
| Single Male/Father | 10 (8.6%) | 3.10 |
| Single Female/Mother | 37 (31.6%) | 3.32 |
| Total Families | 117 (100.0%) | 3.27 |
Median Household Size in Keota
The median household size in Keota is 2.64 persons per household, with married-couple households (70 | 35.2%) accounting for the largest median household size of 3.91 persons per household. non-family households (82 | 41.2%) represent the smallest median household size with 1.07 persons per household.
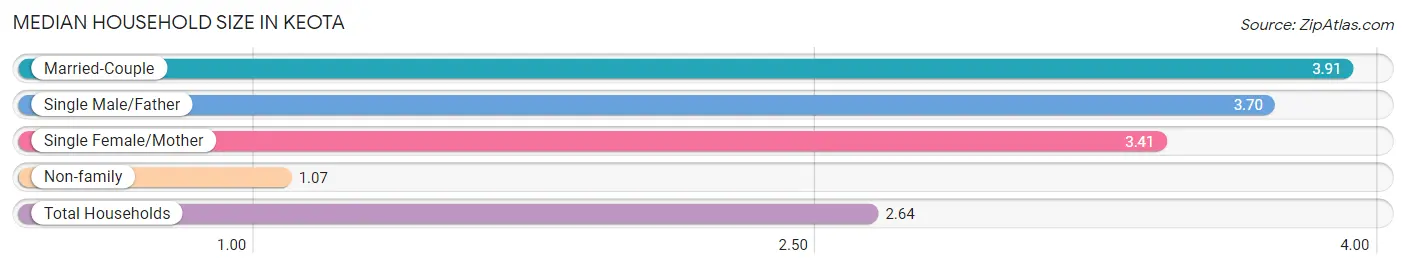
| Household Type | # Households | Household Size |
| Married-Couple | 70 (35.2%) | 3.91 |
| Single Male/Father | 10 (5.0%) | 3.70 |
| Single Female/Mother | 37 (18.6%) | 3.41 |
| Non-family | 82 (41.2%) | 1.07 |
| Total Households | 199 (100.0%) | 2.64 |
Household Size by Marriage Status in Keota
Out of a total of 199 households in Keota, 117 (58.8%) are family households, while 82 (41.2%) are nonfamily households. The most numerous type of family households are 2-person households, comprising 37, and the most common type of nonfamily households are 1-person households, comprising 77.
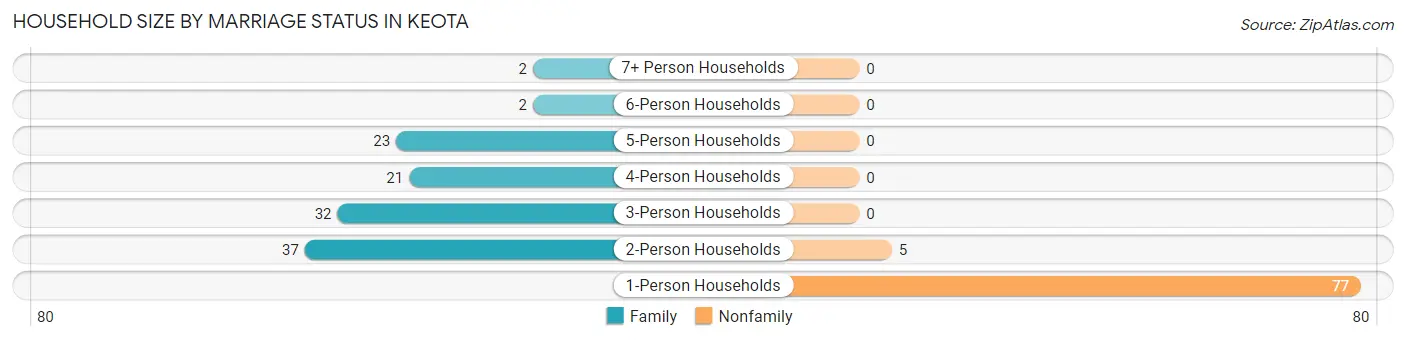
| Household Size | Family Households | Nonfamily Households |
| 1-Person Households | - | 77 (38.7%) |
| 2-Person Households | 37 (18.6%) | 5 (2.5%) |
| 3-Person Households | 32 (16.1%) | 0 (0.0%) |
| 4-Person Households | 21 (10.5%) | 0 (0.0%) |
| 5-Person Households | 23 (11.6%) | 0 (0.0%) |
| 6-Person Households | 2 (1.0%) | 0 (0.0%) |
| 7+ Person Households | 2 (1.0%) | 0 (0.0%) |
| Total | 117 (58.8%) | 82 (41.2%) |
Female Fertility in Keota
Fertility by Age in Keota
Average fertility rate in Keota is 103.0 births per 1,000 women. Women in the age bracket of 15 to 19 years have the highest fertility rate with 200.0 births per 1,000 women. Women in the age bracket of 20 to 34 years acount for 81.8% of all women with births.
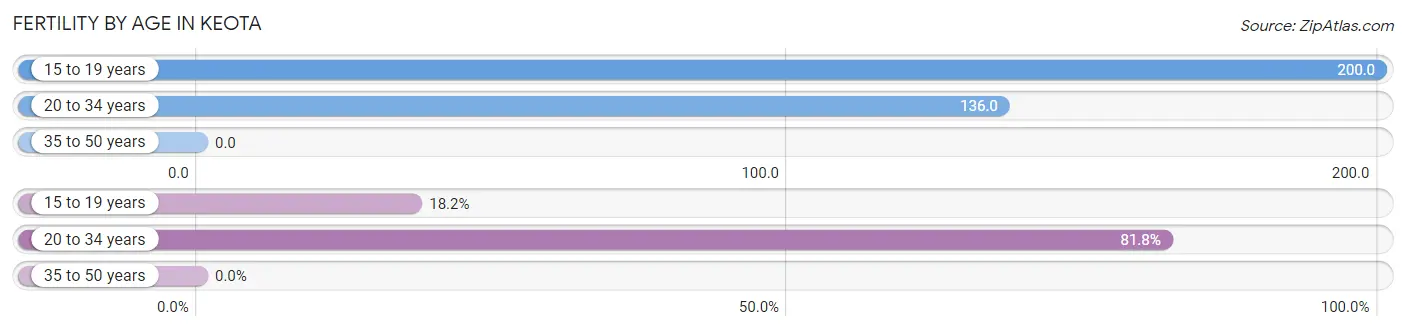
| Age Bracket | Women with Births | Births / 1,000 Women |
| 15 to 19 years | 2 (18.2%) | 200.0 |
| 20 to 34 years | 9 (81.8%) | 136.0 |
| 35 to 50 years | 0 (0.0%) | 0.0 |
| Total | 11 (100.0%) | 103.0 |
Fertility by Age by Marriage Status in Keota
72.7% of women with births (11) in Keota are married. The highest percentage of unmarried women with births falls into 20 to 34 years age bracket with 33.3% of them unmarried at the time of birth, while the lowest percentage of unmarried women with births belong to 15 to 19 years age bracket with 0.0% of them unmarried.
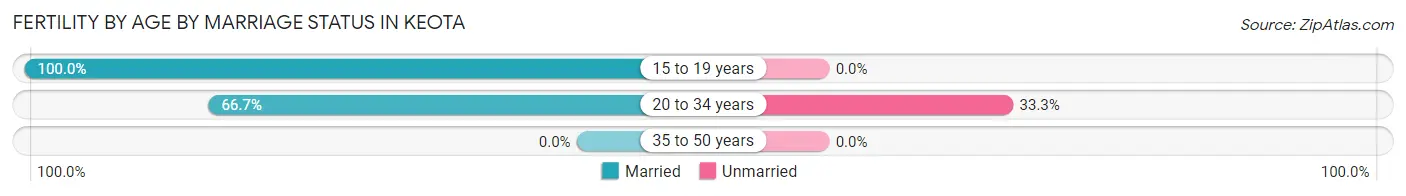
| Age Bracket | Married | Unmarried |
| 15 to 19 years | 2 (100.0%) | 0 (0.0%) |
| 20 to 34 years | 6 (66.7%) | 3 (33.3%) |
| 35 to 50 years | 0 (0.0%) | 0 (0.0%) |
| Total | 8 (72.7%) | 3 (27.3%) |
Fertility by Education in Keota
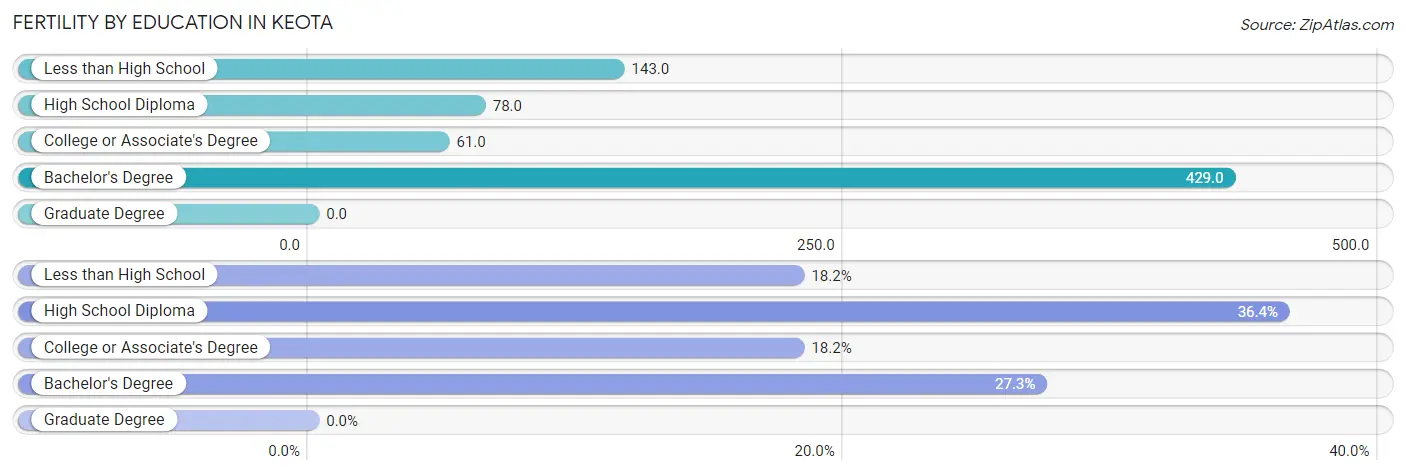
| Educational Attainment | Women with Births | Births / 1,000 Women |
| Less than High School | 2 (18.2%) | 143.0 |
| High School Diploma | 4 (36.4%) | 78.0 |
| College or Associate's Degree | 2 (18.2%) | 61.0 |
| Bachelor's Degree | 3 (27.3%) | 429.0 |
| Graduate Degree | 0 (0.0%) | 0.0 |
| Total | 11 (100.0%) | 103.0 |
Fertility by Education by Marriage Status in Keota
27.3% of women with births in Keota are unmarried. Women with the educational attainment of less than high school are most likely to be married with 100.0% of them married at childbirth, while women with the educational attainment of bachelor's degree are least likely to be married with 100.0% of them unmarried at childbirth.
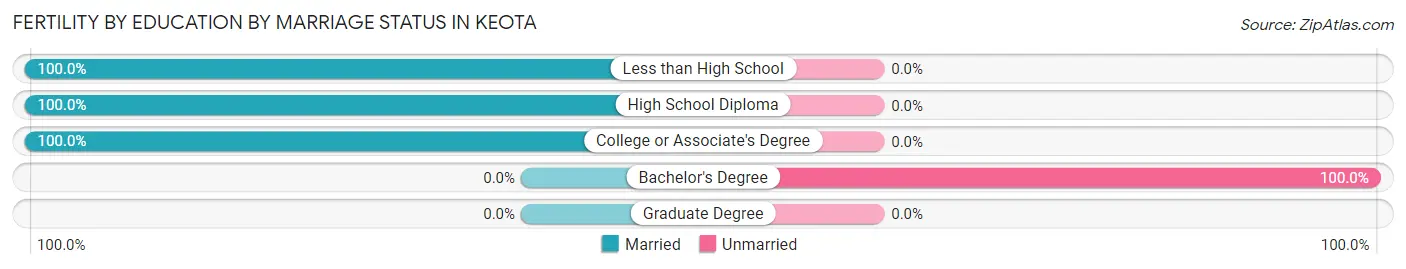
| Educational Attainment | Married | Unmarried |
| Less than High School | 2 (100.0%) | 0 (0.0%) |
| High School Diploma | 4 (100.0%) | 0 (0.0%) |
| College or Associate's Degree | 2 (100.0%) | 0 (0.0%) |
| Bachelor's Degree | 0 (0.0%) | 3 (100.0%) |
| Graduate Degree | 0 (0.0%) | 0 (0.0%) |
| Total | 8 (72.7%) | 3 (27.3%) |
Employment Characteristics in Keota
Employment by Class of Employer in Keota
Among the 169 employed individuals in Keota, private company employees (91 | 53.8%), self-employed (not incorporated) (37 | 21.9%), and federal government employees (17 | 10.1%) make up the most common classes of employment.
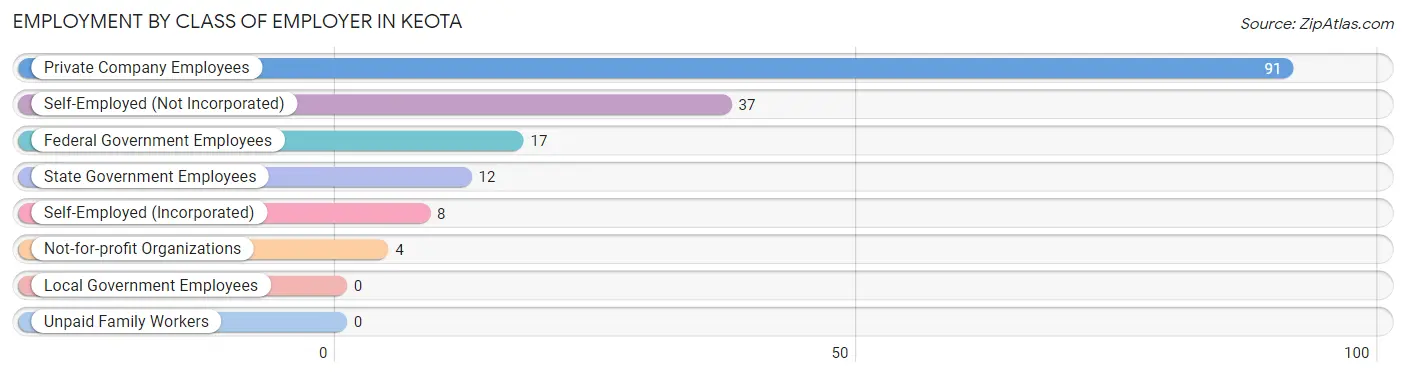
| Employer Class | # Employees | % Employees |
| Private Company Employees | 91 | 53.8% |
| Self-Employed (Incorporated) | 8 | 4.7% |
| Self-Employed (Not Incorporated) | 37 | 21.9% |
| Not-for-profit Organizations | 4 | 2.4% |
| Local Government Employees | 0 | 0.0% |
| State Government Employees | 12 | 7.1% |
| Federal Government Employees | 17 | 10.1% |
| Unpaid Family Workers | 0 | 0.0% |
| Total | 169 | 100.0% |
Employment Status by Age in Keota
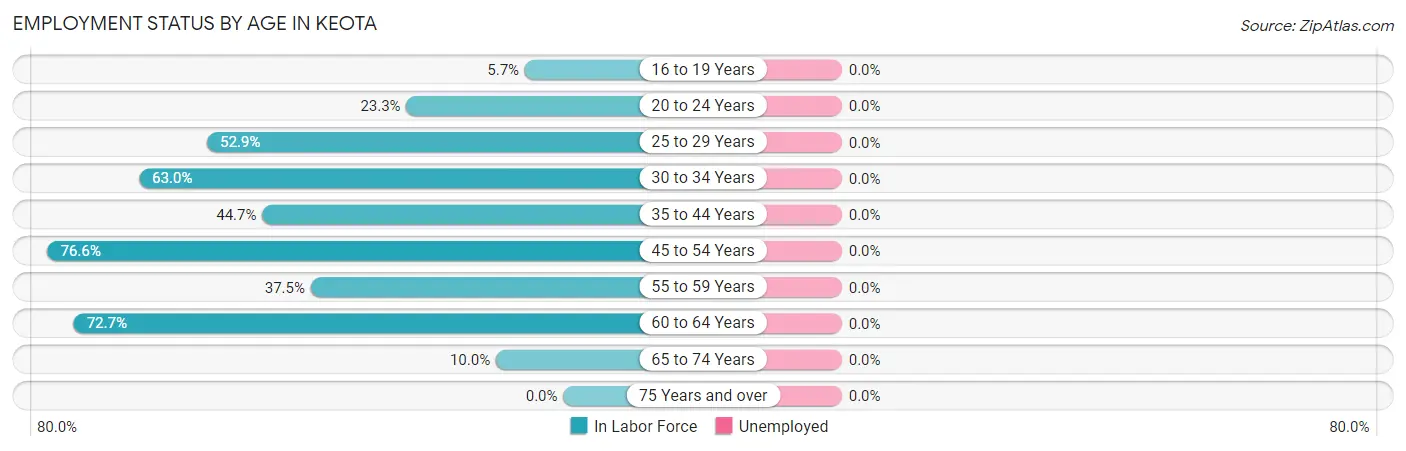
| Age Bracket | In Labor Force | Unemployed |
| 16 to 19 Years | 2 (5.7%) | 0 (0.0%) |
| 20 to 24 Years | 10 (23.3%) | 0 (0.0%) |
| 25 to 29 Years | 18 (52.9%) | 0 (0.0%) |
| 30 to 34 Years | 17 (63.0%) | 0 (0.0%) |
| 35 to 44 Years | 17 (44.7%) | 0 (0.0%) |
| 45 to 54 Years | 49 (76.6%) | 0 (0.0%) |
| 55 to 59 Years | 12 (37.5%) | 0 (0.0%) |
| 60 to 64 Years | 40 (72.7%) | 0 (0.0%) |
| 65 to 74 Years | 4 (10.0%) | 0 (0.0%) |
| 75 Years and over | 0 (0.0%) | 0 (0.0%) |
| Total | 169 (40.3%) | 0 (0.0%) |
Employment Status by Educational Attainment in Keota
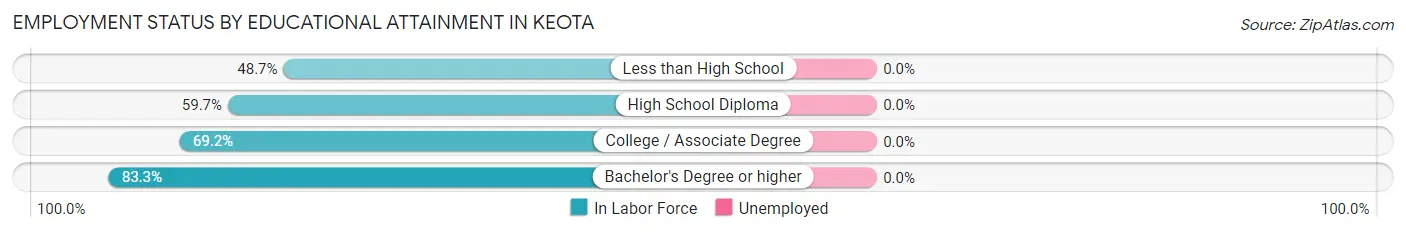
| Educational Attainment | In Labor Force | Unemployed |
| Less than High School | 19 (48.7%) | 0 (0.0%) |
| High School Diploma | 92 (59.7%) | 0 (0.0%) |
| College / Associate Degree | 27 (69.2%) | 0 (0.0%) |
| Bachelor's Degree or higher | 15 (83.3%) | 0 (0.0%) |
| Total | 153 (61.2%) | 0 (0.0%) |
Employment Occupations by Sex in Keota
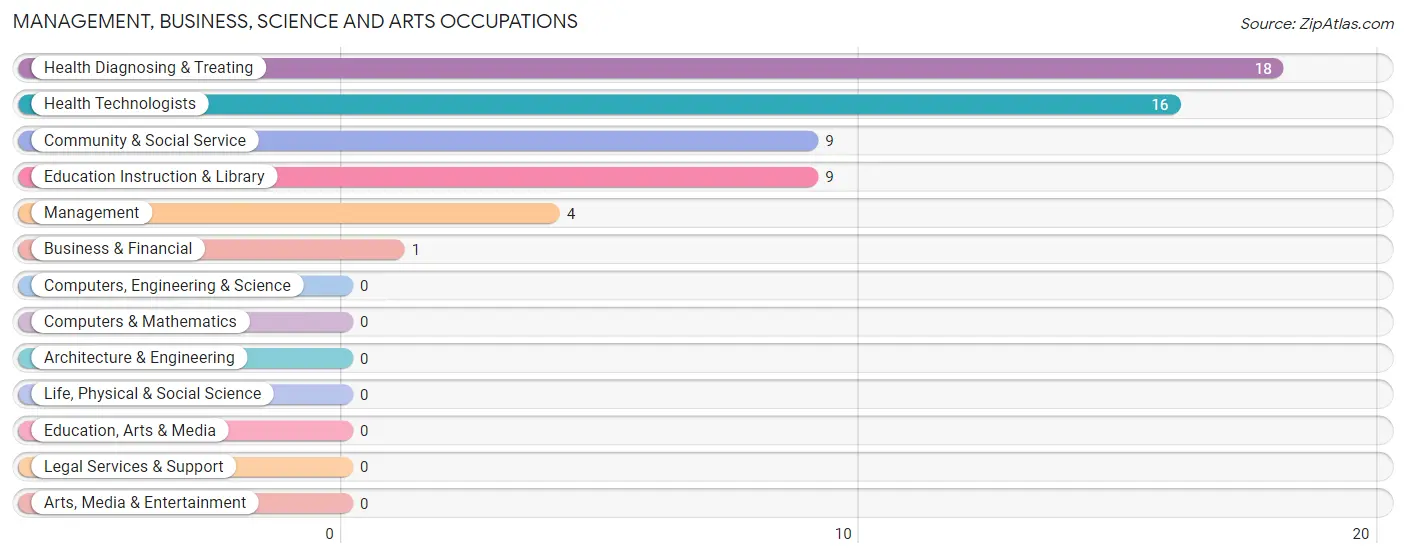
Management, Business, Science and Arts Occupations
The most common Management, Business, Science and Arts occupations in Keota are Health Diagnosing & Treating (18 | 10.6%), Health Technologists (16 | 9.5%), Community & Social Service (9 | 5.3%), Education Instruction & Library (9 | 5.3%), and Management (4 | 2.4%).
Management, Business, Science and Arts Occupations by Sex
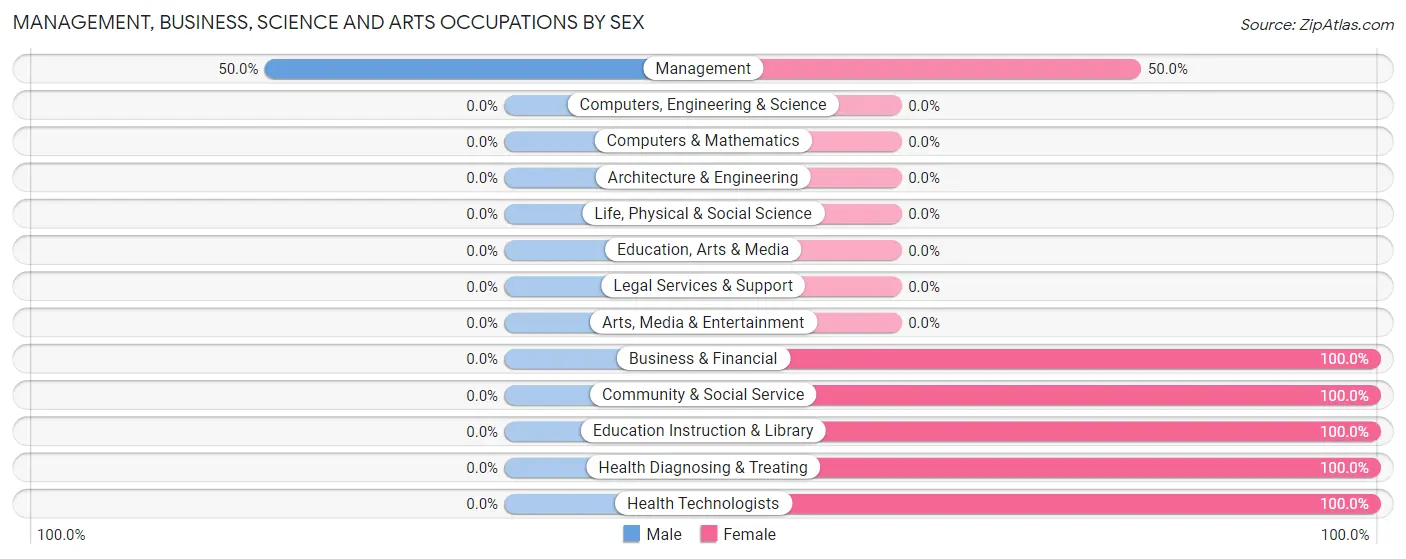
| Occupation | Male | Female |
| Management | 2 (50.0%) | 2 (50.0%) |
| Business & Financial | 0 (0.0%) | 1 (100.0%) |
| Computers, Engineering & Science | 0 (0.0%) | 0 (0.0%) |
| Computers & Mathematics | 0 (0.0%) | 0 (0.0%) |
| Architecture & Engineering | 0 (0.0%) | 0 (0.0%) |
| Life, Physical & Social Science | 0 (0.0%) | 0 (0.0%) |
| Community & Social Service | 0 (0.0%) | 9 (100.0%) |
| Education, Arts & Media | 0 (0.0%) | 0 (0.0%) |
| Legal Services & Support | 0 (0.0%) | 0 (0.0%) |
| Education Instruction & Library | 0 (0.0%) | 9 (100.0%) |
| Arts, Media & Entertainment | 0 (0.0%) | 0 (0.0%) |
| Health Diagnosing & Treating | 0 (0.0%) | 18 (100.0%) |
| Health Technologists | 0 (0.0%) | 16 (100.0%) |
| Total (Category) | 2 (6.2%) | 30 (93.8%) |
| Total (Overall) | 93 (55.0%) | 76 (45.0%) |
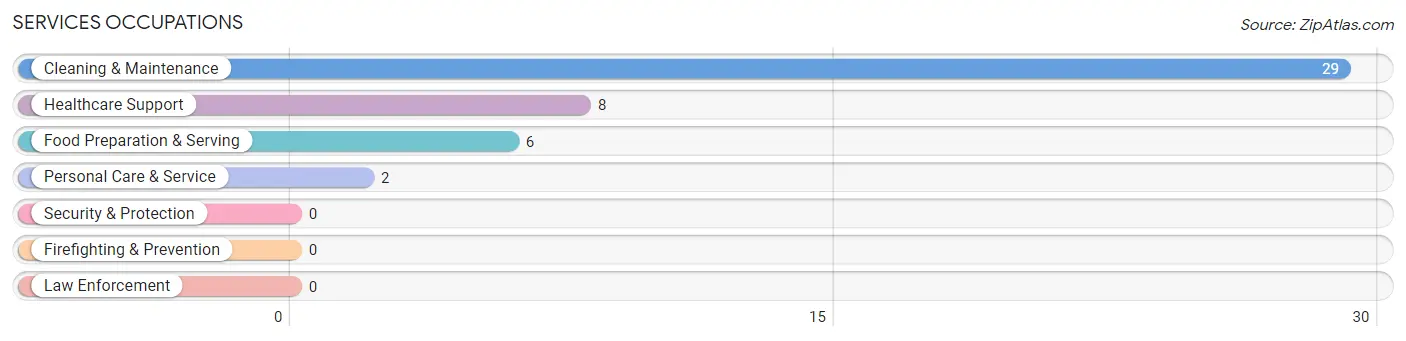
Services Occupations
The most common Services occupations in Keota are Cleaning & Maintenance (29 | 17.2%), Healthcare Support (8 | 4.7%), Food Preparation & Serving (6 | 3.5%), and Personal Care & Service (2 | 1.2%).
Services Occupations by Sex
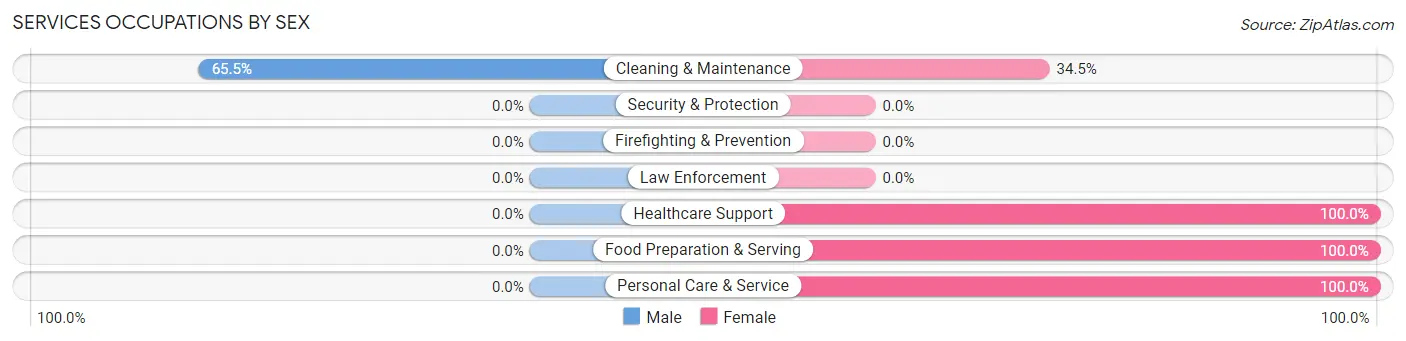
| Occupation | Male | Female |
| Healthcare Support | 0 (0.0%) | 8 (100.0%) |
| Security & Protection | 0 (0.0%) | 0 (0.0%) |
| Firefighting & Prevention | 0 (0.0%) | 0 (0.0%) |
| Law Enforcement | 0 (0.0%) | 0 (0.0%) |
| Food Preparation & Serving | 0 (0.0%) | 6 (100.0%) |
| Cleaning & Maintenance | 19 (65.5%) | 10 (34.5%) |
| Personal Care & Service | 0 (0.0%) | 2 (100.0%) |
| Total (Category) | 19 (42.2%) | 26 (57.8%) |
| Total (Overall) | 93 (55.0%) | 76 (45.0%) |
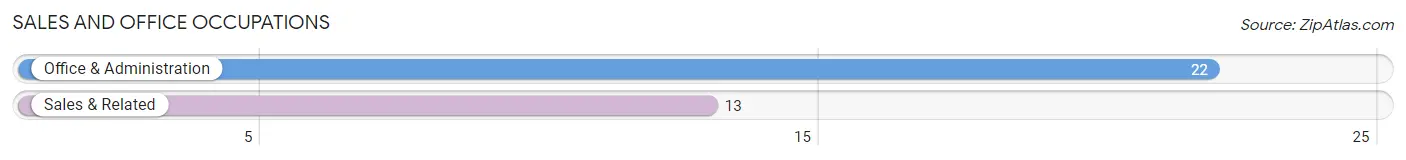
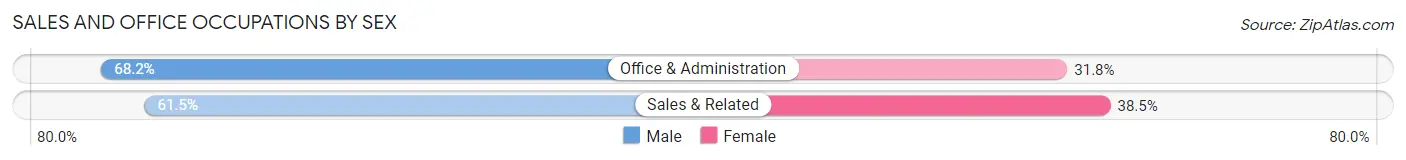
Sales and Office Occupations
The most common Sales and Office occupations in Keota are Office & Administration (22 | 13.0%), and Sales & Related (13 | 7.7%).
Sales and Office Occupations by Sex
| Occupation | Male | Female |
| Sales & Related | 8 (61.5%) | 5 (38.5%) |
| Office & Administration | 15 (68.2%) | 7 (31.8%) |
| Total (Category) | 23 (65.7%) | 12 (34.3%) |
| Total (Overall) | 93 (55.0%) | 76 (45.0%) |
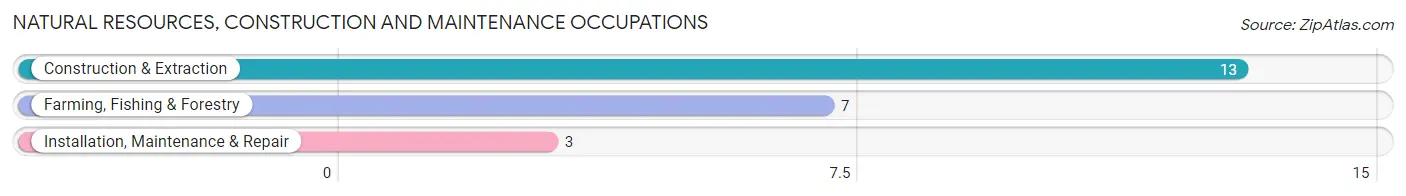
Natural Resources, Construction and Maintenance Occupations
The most common Natural Resources, Construction and Maintenance occupations in Keota are Construction & Extraction (13 | 7.7%), Farming, Fishing & Forestry (7 | 4.1%), and Installation, Maintenance & Repair (3 | 1.8%).
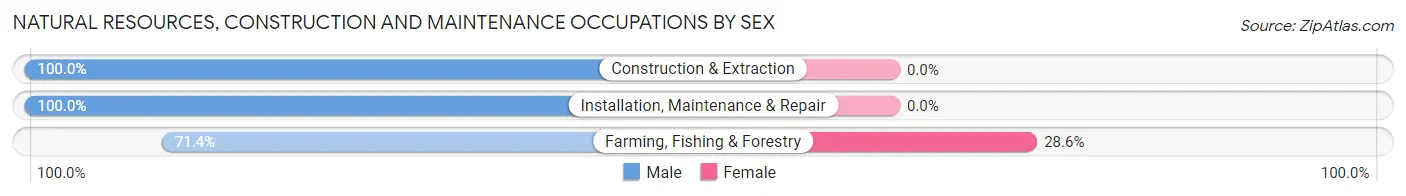
Natural Resources, Construction and Maintenance Occupations by Sex
| Occupation | Male | Female |
| Farming, Fishing & Forestry | 5 (71.4%) | 2 (28.6%) |
| Construction & Extraction | 13 (100.0%) | 0 (0.0%) |
| Installation, Maintenance & Repair | 3 (100.0%) | 0 (0.0%) |
| Total (Category) | 21 (91.3%) | 2 (8.7%) |
| Total (Overall) | 93 (55.0%) | 76 (45.0%) |
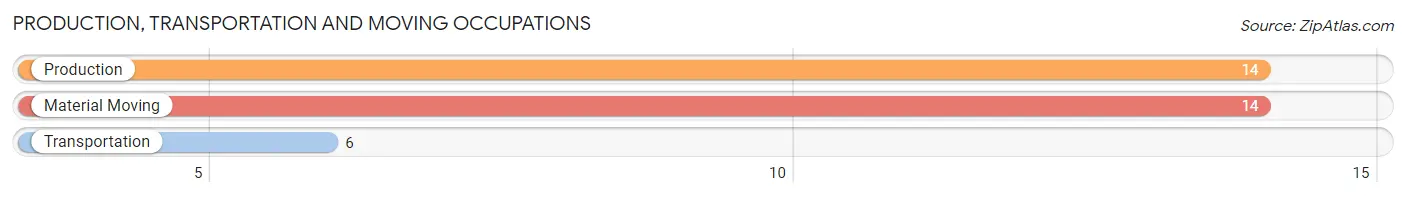
Production, Transportation and Moving Occupations
The most common Production, Transportation and Moving occupations in Keota are Production (14 | 8.3%), Material Moving (14 | 8.3%), and Transportation (6 | 3.5%).
Production, Transportation and Moving Occupations by Sex
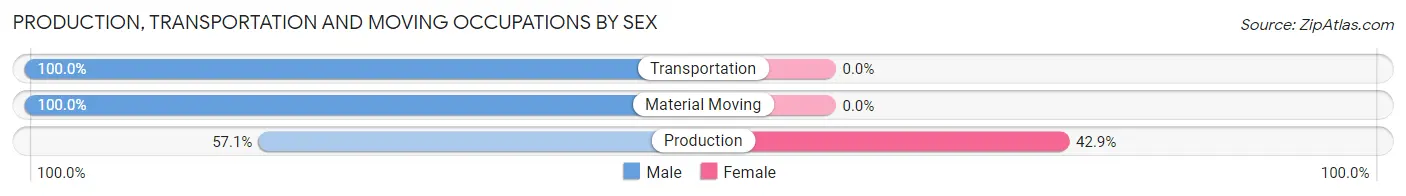
| Occupation | Male | Female |
| Production | 8 (57.1%) | 6 (42.9%) |
| Transportation | 6 (100.0%) | 0 (0.0%) |
| Material Moving | 14 (100.0%) | 0 (0.0%) |
| Total (Category) | 28 (82.4%) | 6 (17.6%) |
| Total (Overall) | 93 (55.0%) | 76 (45.0%) |
Employment Industries by Sex in Keota
Employment Industries in Keota
The major employment industries in Keota include Health Care & Social Assistance (28 | 16.6%), Manufacturing (22 | 13.0%), Retail Trade (17 | 10.1%), Transportation & Warehousing (15 | 8.9%), and Administrative & Support (14 | 8.3%).
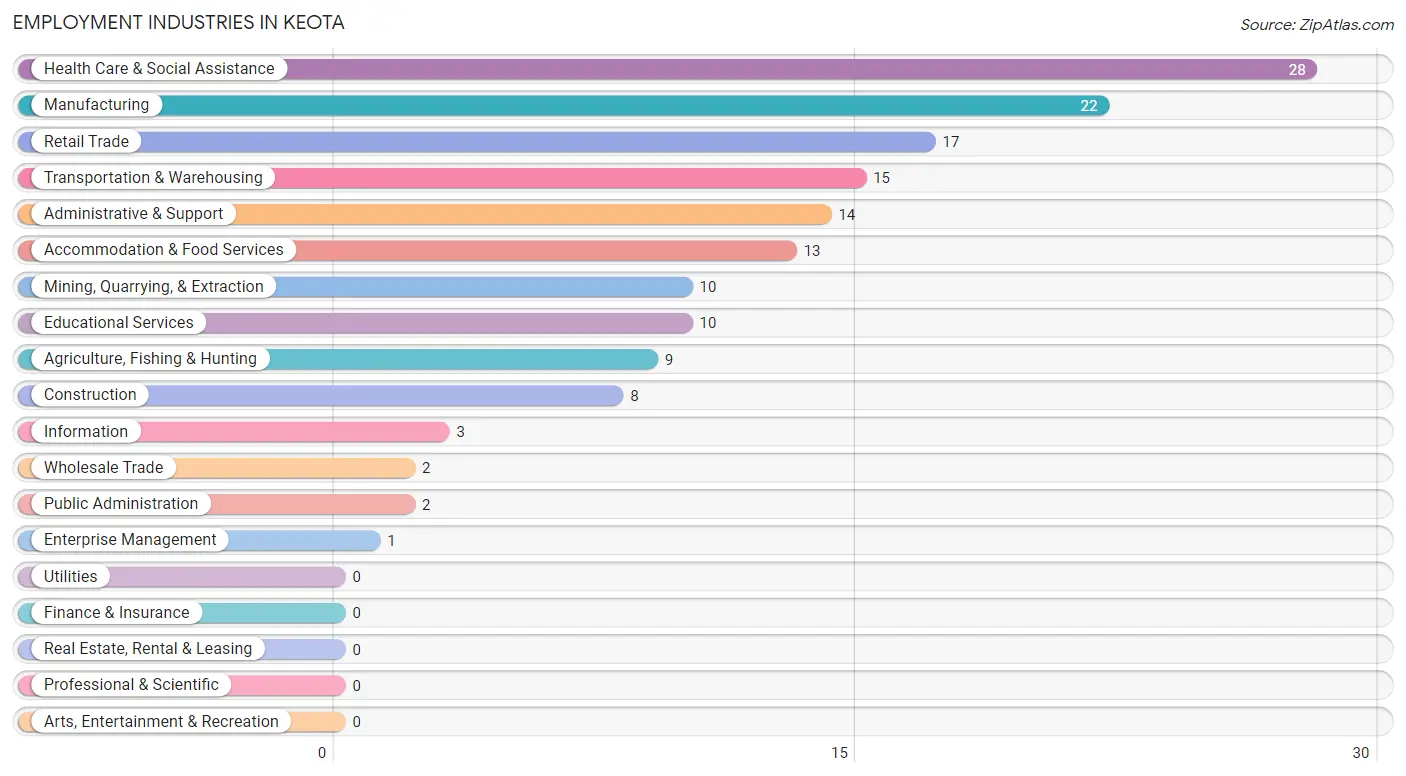
Employment Industries by Sex in Keota
The Keota industries that see more men than women are Mining, Quarrying, & Extraction (100.0%), Construction (100.0%), and Wholesale Trade (100.0%), whereas the industries that tend to have a higher number of women are Information (100.0%), Enterprise Management (100.0%), and Educational Services (100.0%).

| Industry | Male | Female |
| Agriculture, Fishing & Hunting | 7 (77.8%) | 2 (22.2%) |
| Mining, Quarrying, & Extraction | 10 (100.0%) | 0 (0.0%) |
| Construction | 8 (100.0%) | 0 (0.0%) |
| Manufacturing | 18 (81.8%) | 4 (18.2%) |
| Wholesale Trade | 2 (100.0%) | 0 (0.0%) |
| Retail Trade | 10 (58.8%) | 7 (41.2%) |
| Transportation & Warehousing | 15 (100.0%) | 0 (0.0%) |
| Utilities | 0 (0.0%) | 0 (0.0%) |
| Information | 0 (0.0%) | 3 (100.0%) |
| Finance & Insurance | 0 (0.0%) | 0 (0.0%) |
| Real Estate, Rental & Leasing | 0 (0.0%) | 0 (0.0%) |
| Professional & Scientific | 0 (0.0%) | 0 (0.0%) |
| Enterprise Management | 0 (0.0%) | 1 (100.0%) |
| Administrative & Support | 14 (100.0%) | 0 (0.0%) |
| Educational Services | 0 (0.0%) | 10 (100.0%) |
| Health Care & Social Assistance | 0 (0.0%) | 28 (100.0%) |
| Arts, Entertainment & Recreation | 0 (0.0%) | 0 (0.0%) |
| Accommodation & Food Services | 5 (38.5%) | 8 (61.5%) |
| Public Administration | 2 (100.0%) | 0 (0.0%) |
| Total | 93 (55.0%) | 76 (45.0%) |
Education in Keota
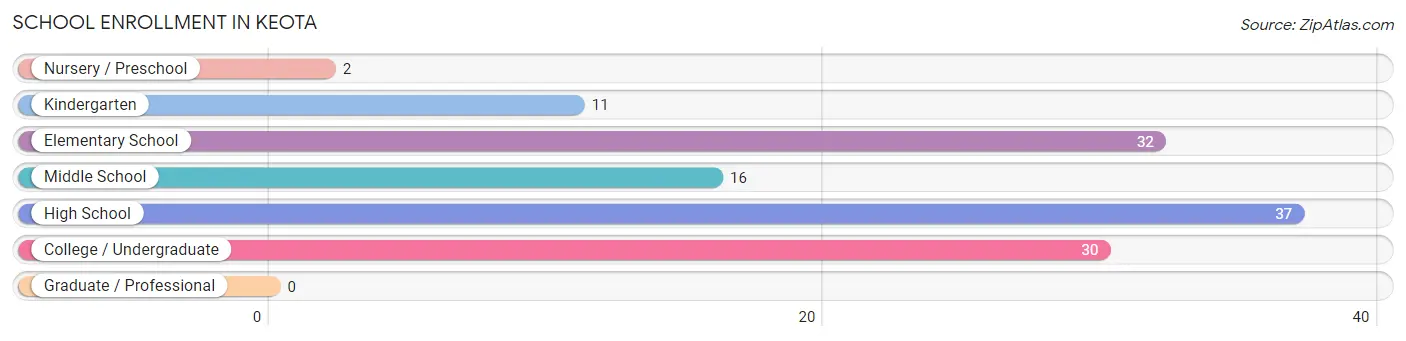
School Enrollment in Keota
The most common levels of schooling among the 128 students in Keota are high school (37 | 28.9%), elementary school (32 | 25.0%), and college / undergraduate (30 | 23.4%).
| School Level | # Students | % Students |
| Nursery / Preschool | 2 | 1.6% |
| Kindergarten | 11 | 8.6% |
| Elementary School | 32 | 25.0% |
| Middle School | 16 | 12.5% |
| High School | 37 | 28.9% |
| College / Undergraduate | 30 | 23.4% |
| Graduate / Professional | 0 | 0.0% |
| Total | 128 | 100.0% |
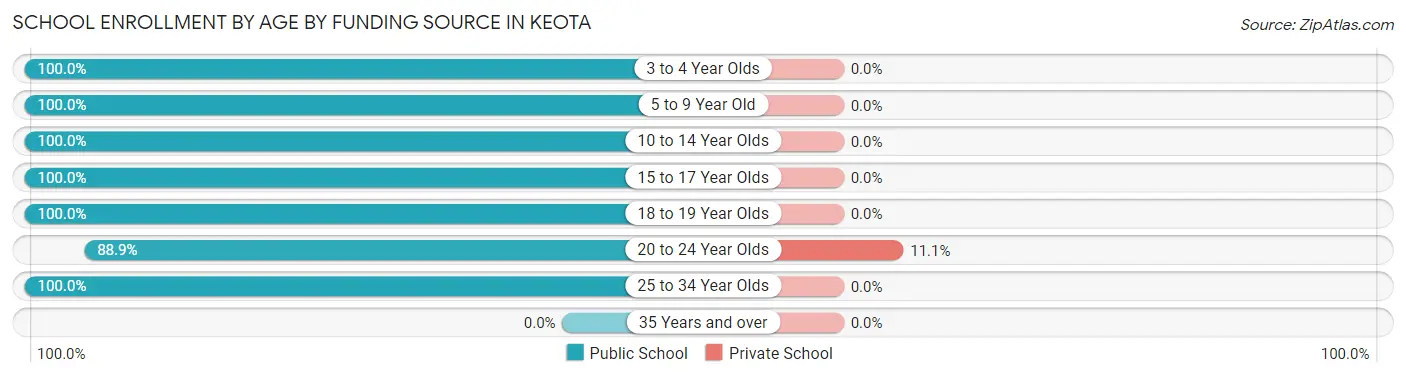
School Enrollment by Age by Funding Source in Keota
Out of a total of 128 students who are enrolled in schools in Keota, 3 (2.3%) attend a private institution, while the remaining 125 (97.7%) are enrolled in public schools. The age group of 20 to 24 year olds has the highest likelihood of being enrolled in private schools, with 3 (11.1% in the age bracket) enrolled. Conversely, the age group of 3 to 4 year olds has the lowest likelihood of being enrolled in a private school, with 2 (100.0% in the age bracket) attending a public institution.
| Age Bracket | Public School | Private School |
| 3 to 4 Year Olds | 2 (100.0%) | 0 (0.0%) |
| 5 to 9 Year Old | 40 (100.0%) | 0 (0.0%) |
| 10 to 14 Year Olds | 24 (100.0%) | 0 (0.0%) |
| 15 to 17 Year Olds | 21 (100.0%) | 0 (0.0%) |
| 18 to 19 Year Olds | 11 (100.0%) | 0 (0.0%) |
| 20 to 24 Year Olds | 24 (88.9%) | 3 (11.1%) |
| 25 to 34 Year Olds | 3 (100.0%) | 0 (0.0%) |
| 35 Years and over | 0 (0.0%) | 0 (0.0%) |
| Total | 125 (97.7%) | 3 (2.3%) |
Educational Attainment by Field of Study in Keota
Education (20 | 46.5%), business (9 | 20.9%), bio, nature & agricultural (6 | 14.0%), psychology (3 | 7.0%), and arts & humanities (3 | 7.0%) are the most common fields of study among 43 individuals in Keota who have obtained a bachelor's degree or higher.
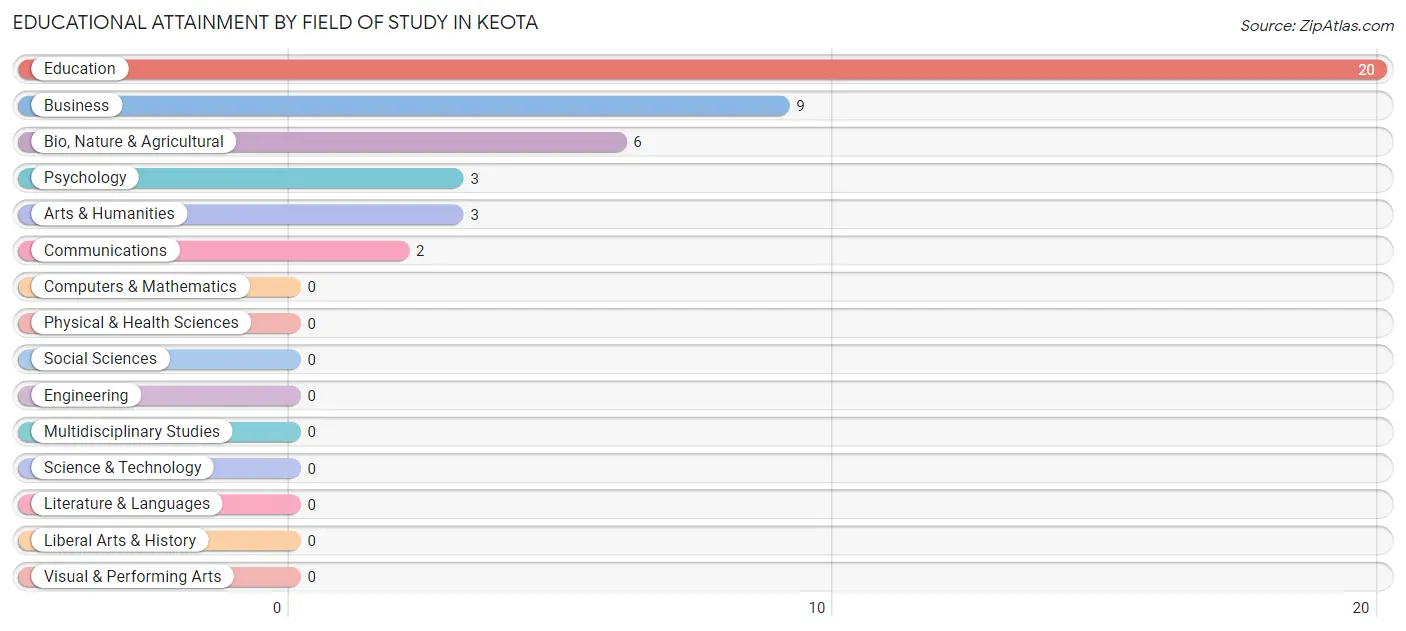
| Field of Study | # Graduates | % Graduates |
| Computers & Mathematics | 0 | 0.0% |
| Bio, Nature & Agricultural | 6 | 14.0% |
| Physical & Health Sciences | 0 | 0.0% |
| Psychology | 3 | 7.0% |
| Social Sciences | 0 | 0.0% |
| Engineering | 0 | 0.0% |
| Multidisciplinary Studies | 0 | 0.0% |
| Science & Technology | 0 | 0.0% |
| Business | 9 | 20.9% |
| Education | 20 | 46.5% |
| Literature & Languages | 0 | 0.0% |
| Liberal Arts & History | 0 | 0.0% |
| Visual & Performing Arts | 0 | 0.0% |
| Communications | 2 | 4.6% |
| Arts & Humanities | 3 | 7.0% |
| Total | 43 | 100.0% |
Transportation & Commute in Keota
Vehicle Availability by Sex in Keota
The most prevalent vehicle ownership categories in Keota are males with 3 vehicles (35, accounting for 37.6%) and females with 3 vehicles (25, making up 46.1%).
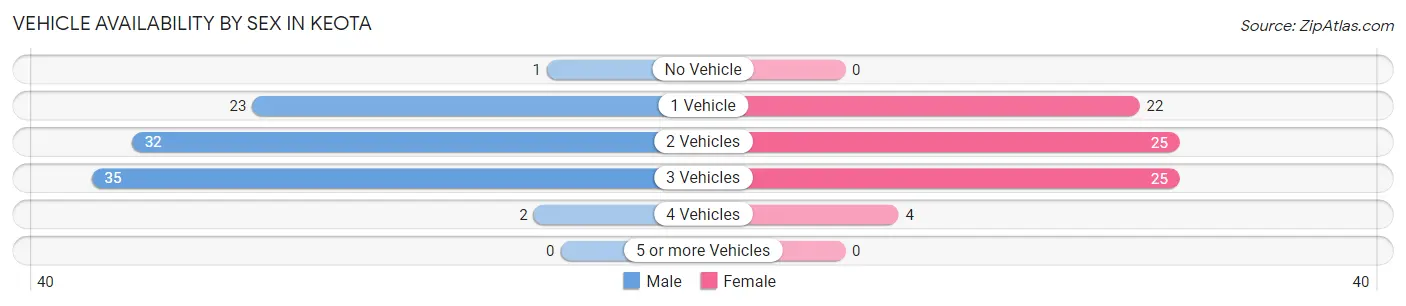
| Vehicles Available | Male | Female |
| No Vehicle | 1 (1.1%) | 0 (0.0%) |
| 1 Vehicle | 23 (24.7%) | 22 (28.9%) |
| 2 Vehicles | 32 (34.4%) | 25 (32.9%) |
| 3 Vehicles | 35 (37.6%) | 25 (32.9%) |
| 4 Vehicles | 2 (2.1%) | 4 (5.3%) |
| 5 or more Vehicles | 0 (0.0%) | 0 (0.0%) |
| Total | 93 (100.0%) | 76 (100.0%) |
Commute Time in Keota
The most frequently occuring commute durations in Keota are less than 5 minutes (43 commuters, 25.8%), 5 to 9 minutes (24 commuters, 14.4%), and 30 to 34 minutes (24 commuters, 14.4%).
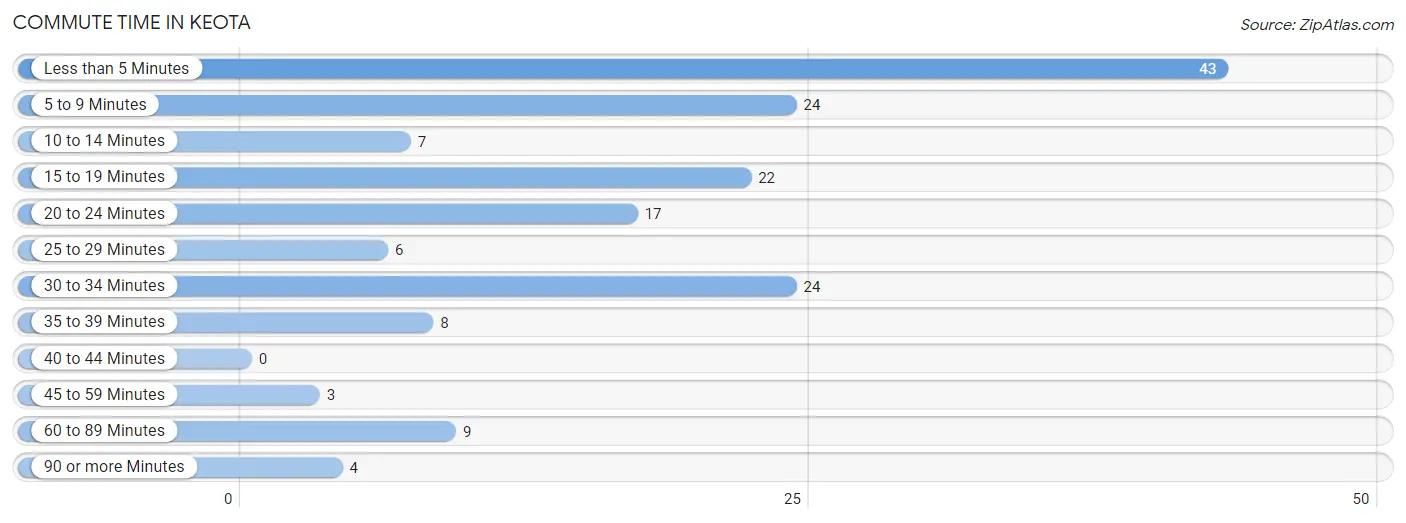
| Commute Time | # Commuters | % Commuters |
| Less than 5 Minutes | 43 | 25.8% |
| 5 to 9 Minutes | 24 | 14.4% |
| 10 to 14 Minutes | 7 | 4.2% |
| 15 to 19 Minutes | 22 | 13.2% |
| 20 to 24 Minutes | 17 | 10.2% |
| 25 to 29 Minutes | 6 | 3.6% |
| 30 to 34 Minutes | 24 | 14.4% |
| 35 to 39 Minutes | 8 | 4.8% |
| 40 to 44 Minutes | 0 | 0.0% |
| 45 to 59 Minutes | 3 | 1.8% |
| 60 to 89 Minutes | 9 | 5.4% |
| 90 or more Minutes | 4 | 2.4% |
Commute Time by Sex in Keota
The most common commute times in Keota are less than 5 minutes (36 commuters, 38.7%) for males and 30 to 34 minutes (19 commuters, 25.7%) for females.
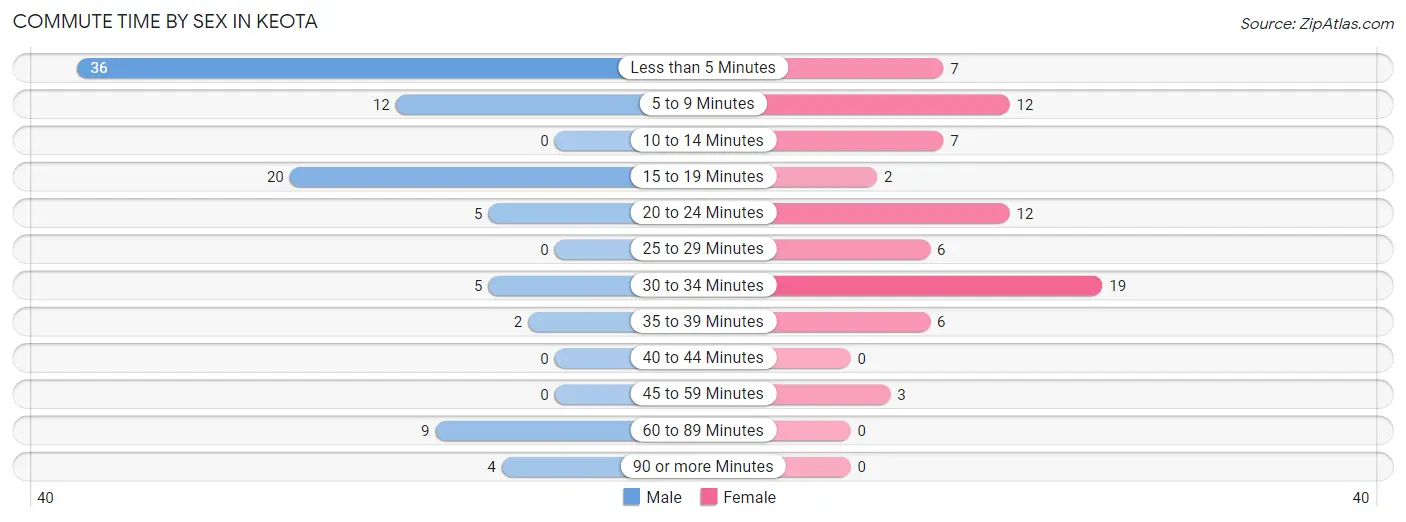
| Commute Time | Male | Female |
| Less than 5 Minutes | 36 (38.7%) | 7 (9.5%) |
| 5 to 9 Minutes | 12 (12.9%) | 12 (16.2%) |
| 10 to 14 Minutes | 0 (0.0%) | 7 (9.5%) |
| 15 to 19 Minutes | 20 (21.5%) | 2 (2.7%) |
| 20 to 24 Minutes | 5 (5.4%) | 12 (16.2%) |
| 25 to 29 Minutes | 0 (0.0%) | 6 (8.1%) |
| 30 to 34 Minutes | 5 (5.4%) | 19 (25.7%) |
| 35 to 39 Minutes | 2 (2.1%) | 6 (8.1%) |
| 40 to 44 Minutes | 0 (0.0%) | 0 (0.0%) |
| 45 to 59 Minutes | 0 (0.0%) | 3 (4.1%) |
| 60 to 89 Minutes | 9 (9.7%) | 0 (0.0%) |
| 90 or more Minutes | 4 (4.3%) | 0 (0.0%) |
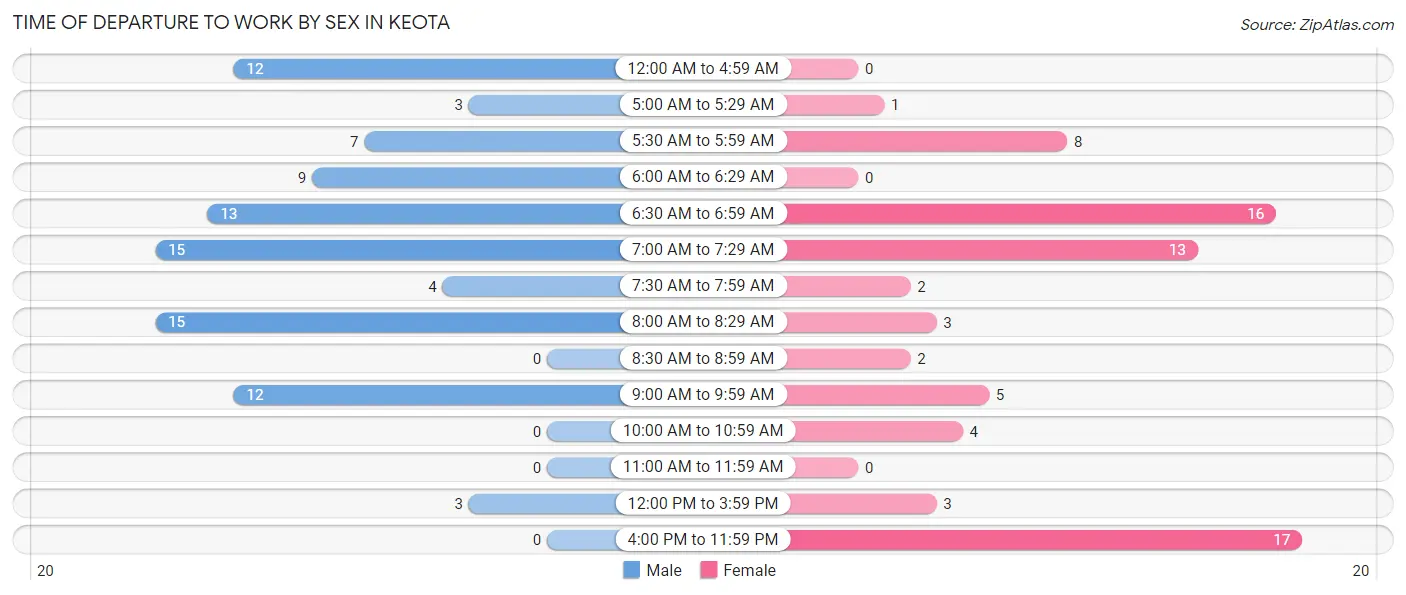
Time of Departure to Work by Sex in Keota
The most frequent times of departure to work in Keota are 7:00 AM to 7:29 AM (15, 16.1%) for males and 4:00 PM to 11:59 PM (17, 23.0%) for females.
| Time of Departure | Male | Female |
| 12:00 AM to 4:59 AM | 12 (12.9%) | 0 (0.0%) |
| 5:00 AM to 5:29 AM | 3 (3.2%) | 1 (1.3%) |
| 5:30 AM to 5:59 AM | 7 (7.5%) | 8 (10.8%) |
| 6:00 AM to 6:29 AM | 9 (9.7%) | 0 (0.0%) |
| 6:30 AM to 6:59 AM | 13 (14.0%) | 16 (21.6%) |
| 7:00 AM to 7:29 AM | 15 (16.1%) | 13 (17.6%) |
| 7:30 AM to 7:59 AM | 4 (4.3%) | 2 (2.7%) |
| 8:00 AM to 8:29 AM | 15 (16.1%) | 3 (4.1%) |
| 8:30 AM to 8:59 AM | 0 (0.0%) | 2 (2.7%) |
| 9:00 AM to 9:59 AM | 12 (12.9%) | 5 (6.8%) |
| 10:00 AM to 10:59 AM | 0 (0.0%) | 4 (5.4%) |
| 11:00 AM to 11:59 AM | 0 (0.0%) | 0 (0.0%) |
| 12:00 PM to 3:59 PM | 3 (3.2%) | 3 (4.1%) |
| 4:00 PM to 11:59 PM | 0 (0.0%) | 17 (23.0%) |
| Total | 93 (100.0%) | 74 (100.0%) |
Housing Occupancy in Keota
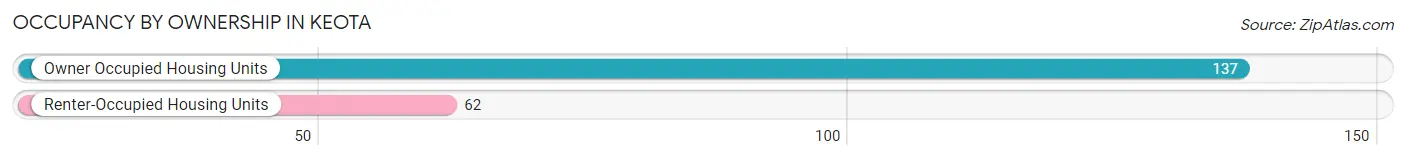
Occupancy by Ownership in Keota
Of the total 199 dwellings in Keota, owner-occupied units account for 137 (68.8%), while renter-occupied units make up 62 (31.2%).
| Occupancy | # Housing Units | % Housing Units |
| Owner Occupied Housing Units | 137 | 68.8% |
| Renter-Occupied Housing Units | 62 | 31.2% |
| Total Occupied Housing Units | 199 | 100.0% |
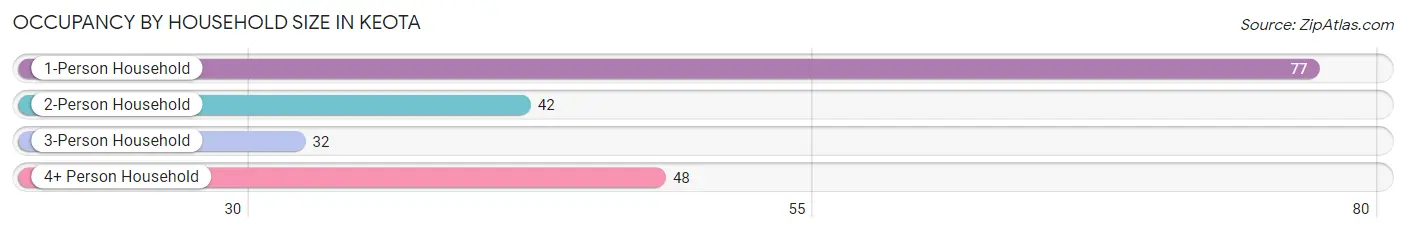
Occupancy by Household Size in Keota
| Household Size | # Housing Units | % Housing Units |
| 1-Person Household | 77 | 38.7% |
| 2-Person Household | 42 | 21.1% |
| 3-Person Household | 32 | 16.1% |
| 4+ Person Household | 48 | 24.1% |
| Total Housing Units | 199 | 100.0% |
Occupancy by Ownership by Household Size in Keota
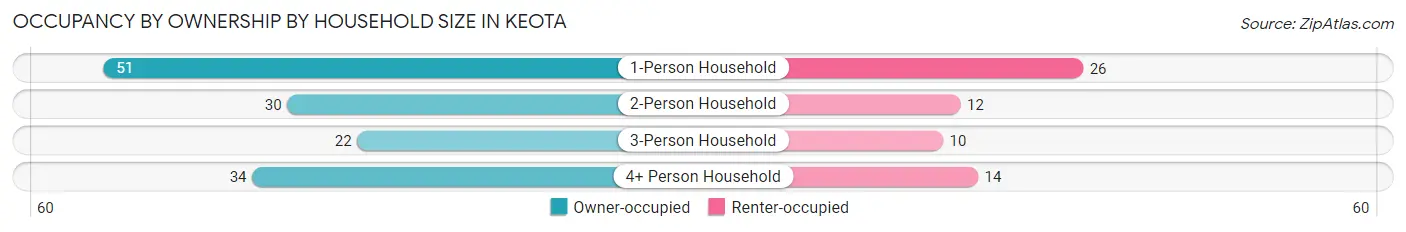
| Household Size | Owner-occupied | Renter-occupied |
| 1-Person Household | 51 (66.2%) | 26 (33.8%) |
| 2-Person Household | 30 (71.4%) | 12 (28.6%) |
| 3-Person Household | 22 (68.8%) | 10 (31.2%) |
| 4+ Person Household | 34 (70.8%) | 14 (29.2%) |
| Total Housing Units | 137 (68.8%) | 62 (31.2%) |
Occupancy by Educational Attainment in Keota
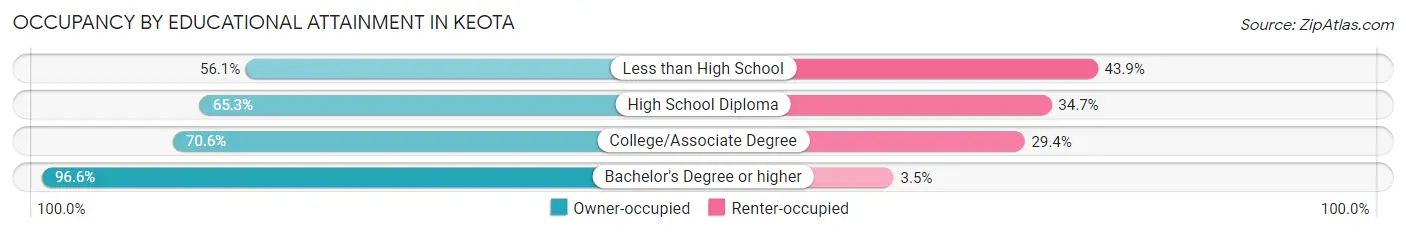
| Household Size | Owner-occupied | Renter-occupied |
| Less than High School | 23 (56.1%) | 18 (43.9%) |
| High School Diploma | 62 (65.3%) | 33 (34.7%) |
| College/Associate Degree | 24 (70.6%) | 10 (29.4%) |
| Bachelor's Degree or higher | 28 (96.6%) | 1 (3.5%) |
Occupancy by Age of Householder in Keota
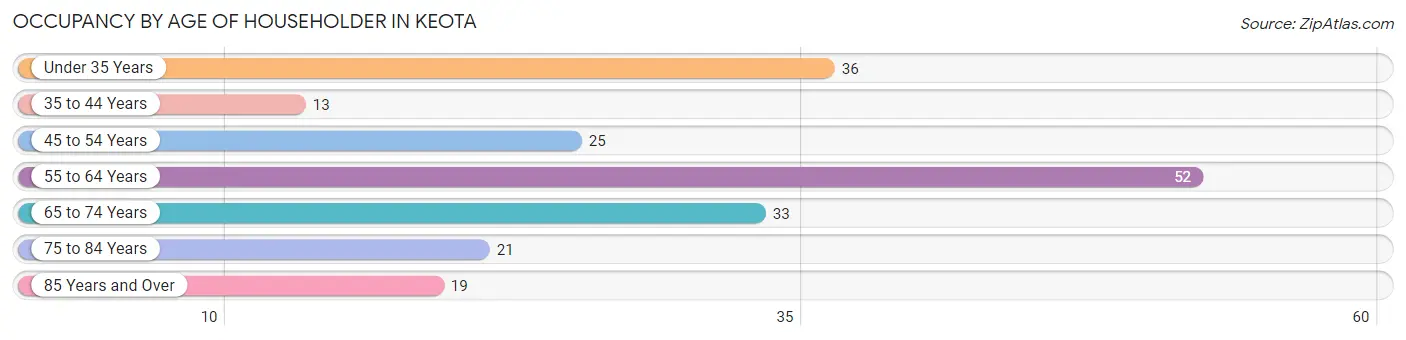
| Age Bracket | # Households | % Households |
| Under 35 Years | 36 | 18.1% |
| 35 to 44 Years | 13 | 6.5% |
| 45 to 54 Years | 25 | 12.6% |
| 55 to 64 Years | 52 | 26.1% |
| 65 to 74 Years | 33 | 16.6% |
| 75 to 84 Years | 21 | 10.5% |
| 85 Years and Over | 19 | 9.6% |
| Total | 199 | 100.0% |
Housing Finances in Keota
Median Income by Occupancy in Keota
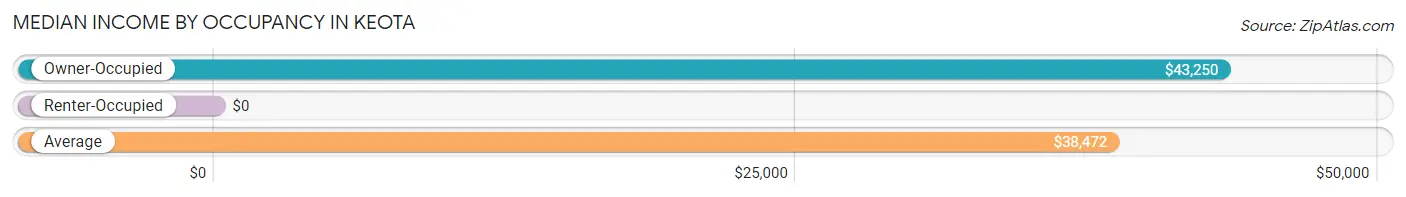
| Occupancy Type | # Households | Median Income |
| Owner-Occupied | 137 (68.8%) | $43,250 |
| Renter-Occupied | 62 (31.2%) | $0 |
| Average | 199 (100.0%) | $38,472 |
Occupancy by Householder Income Bracket in Keota
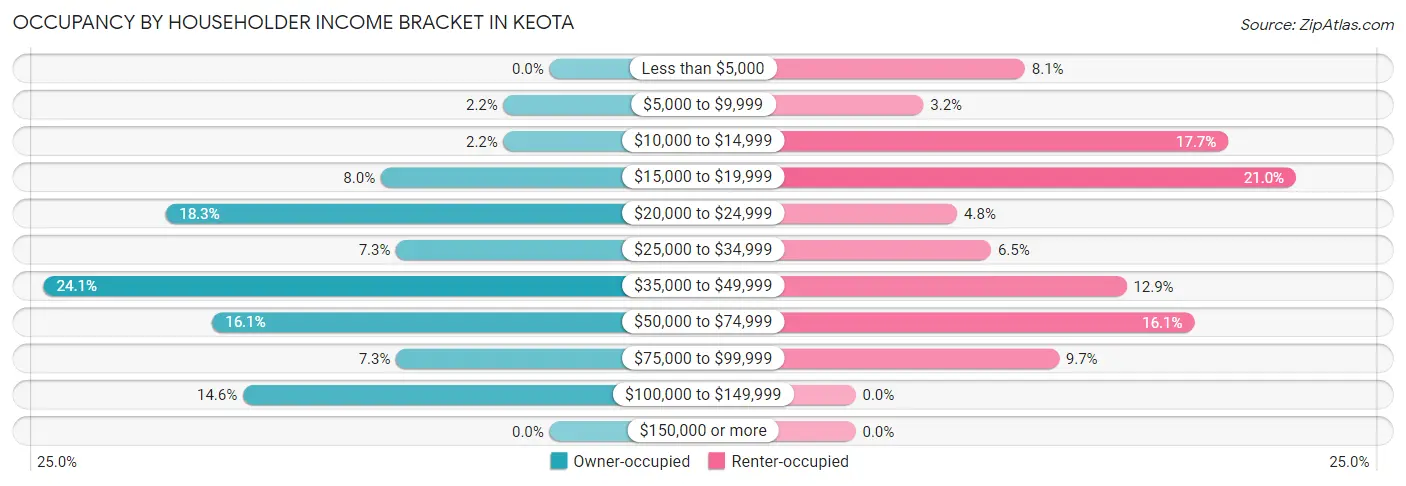
| Income Bracket | Owner-occupied | Renter-occupied |
| Less than $5,000 | 0 (0.0%) | 5 (8.1%) |
| $5,000 to $9,999 | 3 (2.2%) | 2 (3.2%) |
| $10,000 to $14,999 | 3 (2.2%) | 11 (17.7%) |
| $15,000 to $19,999 | 11 (8.0%) | 13 (21.0%) |
| $20,000 to $24,999 | 25 (18.2%) | 3 (4.8%) |
| $25,000 to $34,999 | 10 (7.3%) | 4 (6.5%) |
| $35,000 to $49,999 | 33 (24.1%) | 8 (12.9%) |
| $50,000 to $74,999 | 22 (16.1%) | 10 (16.1%) |
| $75,000 to $99,999 | 10 (7.3%) | 6 (9.7%) |
| $100,000 to $149,999 | 20 (14.6%) | 0 (0.0%) |
| $150,000 or more | 0 (0.0%) | 0 (0.0%) |
| Total | 137 (100.0%) | 62 (100.0%) |
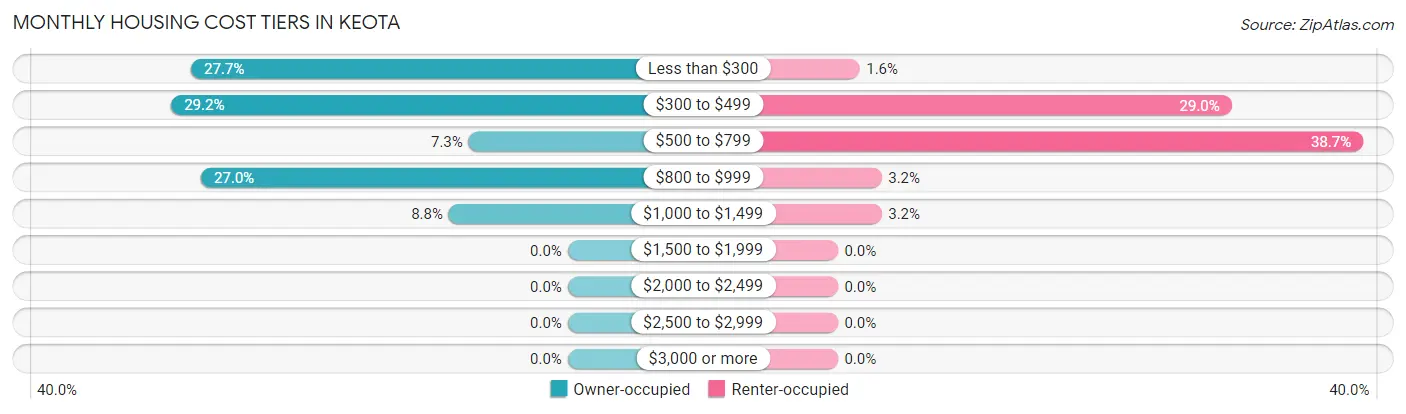
Monthly Housing Cost Tiers in Keota
| Monthly Cost | Owner-occupied | Renter-occupied |
| Less than $300 | 38 (27.7%) | 1 (1.6%) |
| $300 to $499 | 40 (29.2%) | 18 (29.0%) |
| $500 to $799 | 10 (7.3%) | 24 (38.7%) |
| $800 to $999 | 37 (27.0%) | 2 (3.2%) |
| $1,000 to $1,499 | 12 (8.8%) | 2 (3.2%) |
| $1,500 to $1,999 | 0 (0.0%) | 0 (0.0%) |
| $2,000 to $2,499 | 0 (0.0%) | 0 (0.0%) |
| $2,500 to $2,999 | 0 (0.0%) | 0 (0.0%) |
| $3,000 or more | 0 (0.0%) | 0 (0.0%) |
| Total | 137 (100.0%) | 62 (100.0%) |
Physical Housing Characteristics in Keota
Housing Structures in Keota
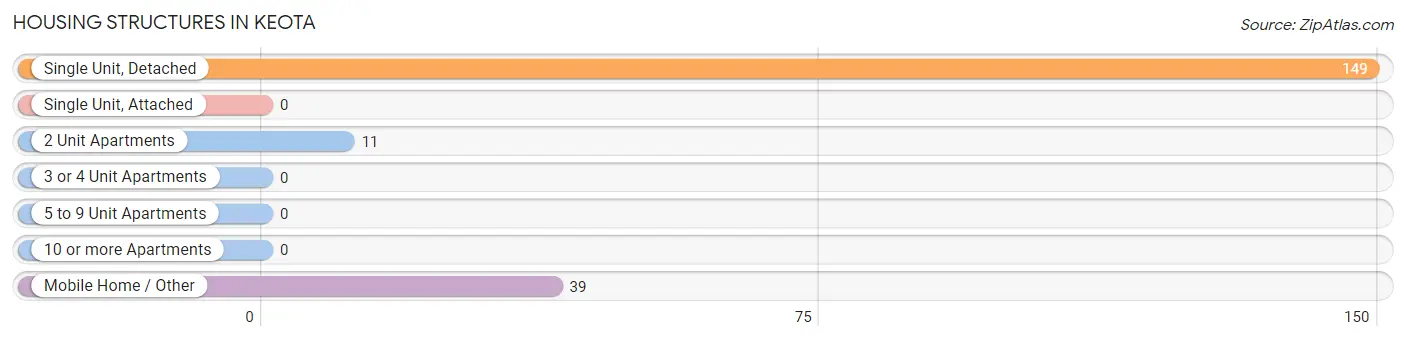
| Structure Type | # Housing Units | % Housing Units |
| Single Unit, Detached | 149 | 74.9% |
| Single Unit, Attached | 0 | 0.0% |
| 2 Unit Apartments | 11 | 5.5% |
| 3 or 4 Unit Apartments | 0 | 0.0% |
| 5 to 9 Unit Apartments | 0 | 0.0% |
| 10 or more Apartments | 0 | 0.0% |
| Mobile Home / Other | 39 | 19.6% |
| Total | 199 | 100.0% |
Housing Structures by Occupancy in Keota
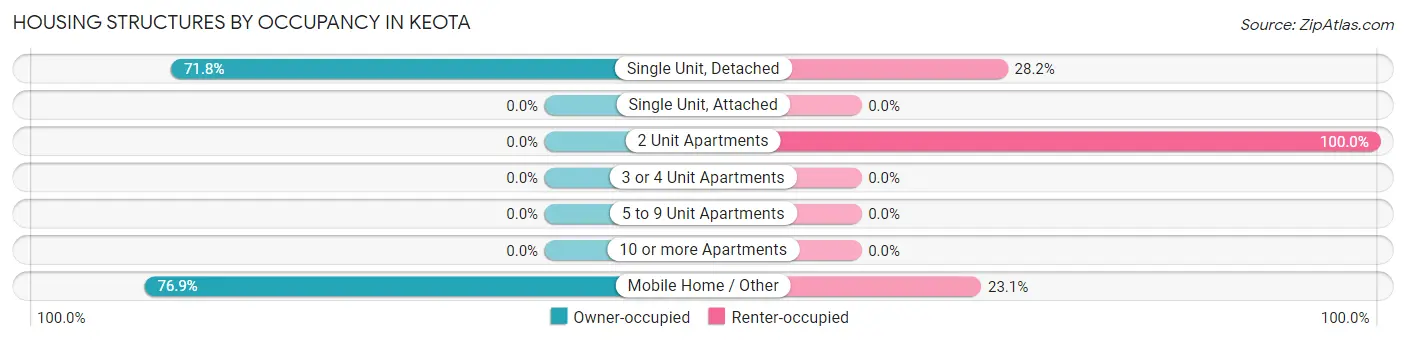
| Structure Type | Owner-occupied | Renter-occupied |
| Single Unit, Detached | 107 (71.8%) | 42 (28.2%) |
| Single Unit, Attached | 0 (0.0%) | 0 (0.0%) |
| 2 Unit Apartments | 0 (0.0%) | 11 (100.0%) |
| 3 or 4 Unit Apartments | 0 (0.0%) | 0 (0.0%) |
| 5 to 9 Unit Apartments | 0 (0.0%) | 0 (0.0%) |
| 10 or more Apartments | 0 (0.0%) | 0 (0.0%) |
| Mobile Home / Other | 30 (76.9%) | 9 (23.1%) |
| Total | 137 (68.8%) | 62 (31.2%) |
Housing Structures by Number of Rooms in Keota
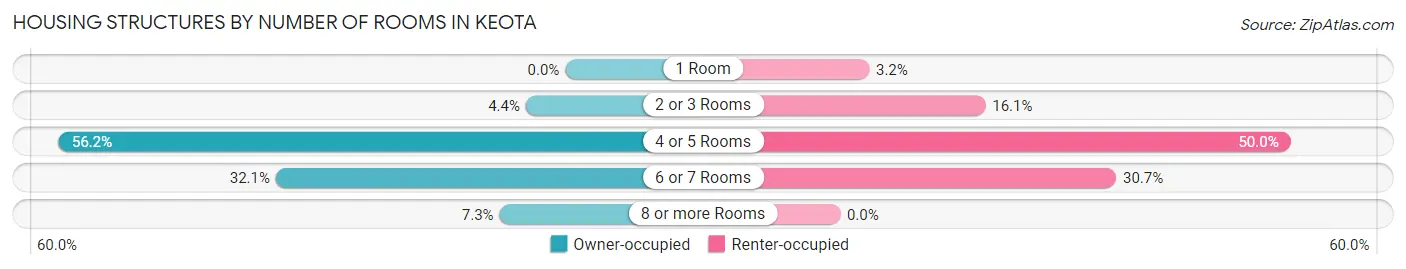
| Number of Rooms | Owner-occupied | Renter-occupied |
| 1 Room | 0 (0.0%) | 2 (3.2%) |
| 2 or 3 Rooms | 6 (4.4%) | 10 (16.1%) |
| 4 or 5 Rooms | 77 (56.2%) | 31 (50.0%) |
| 6 or 7 Rooms | 44 (32.1%) | 19 (30.6%) |
| 8 or more Rooms | 10 (7.3%) | 0 (0.0%) |
| Total | 137 (100.0%) | 62 (100.0%) |
Housing Structure by Heating Type in Keota
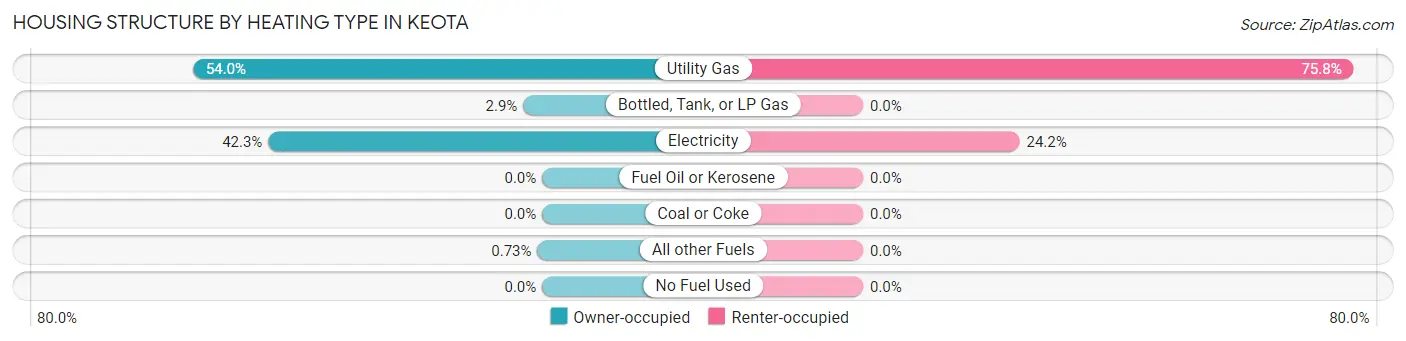
| Heating Type | Owner-occupied | Renter-occupied |
| Utility Gas | 74 (54.0%) | 47 (75.8%) |
| Bottled, Tank, or LP Gas | 4 (2.9%) | 0 (0.0%) |
| Electricity | 58 (42.3%) | 15 (24.2%) |
| Fuel Oil or Kerosene | 0 (0.0%) | 0 (0.0%) |
| Coal or Coke | 0 (0.0%) | 0 (0.0%) |
| All other Fuels | 1 (0.7%) | 0 (0.0%) |
| No Fuel Used | 0 (0.0%) | 0 (0.0%) |
| Total | 137 (100.0%) | 62 (100.0%) |
Household Vehicle Usage in Keota
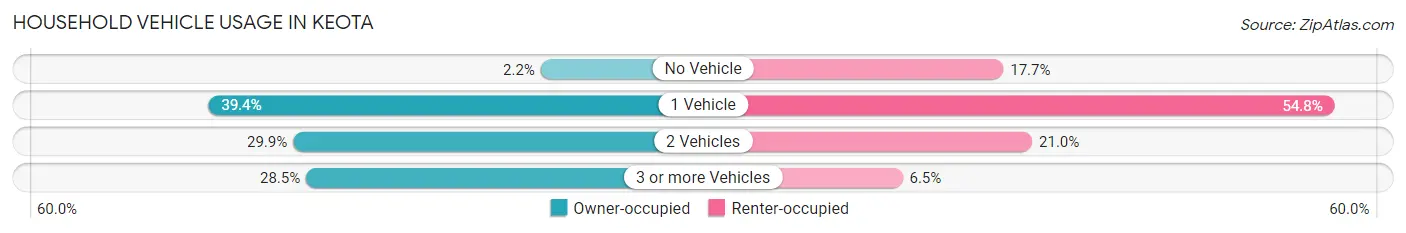
| Vehicles per Household | Owner-occupied | Renter-occupied |
| No Vehicle | 3 (2.2%) | 11 (17.7%) |
| 1 Vehicle | 54 (39.4%) | 34 (54.8%) |
| 2 Vehicles | 41 (29.9%) | 13 (21.0%) |
| 3 or more Vehicles | 39 (28.5%) | 4 (6.5%) |
| Total | 137 (100.0%) | 62 (100.0%) |
Real Estate & Mortgages in Keota
Real Estate and Mortgage Overview in Keota
| Characteristic | Without Mortgage | With Mortgage |
| Housing Units | 78 | 59 |
| Median Property Value | $37,500 | $62,500 |
| Median Household Income | $31,250 | $0 |
| Monthly Housing Costs | $304 | $0 |
| Real Estate Taxes | $199 | $0 |
Property Value by Mortgage Status in Keota
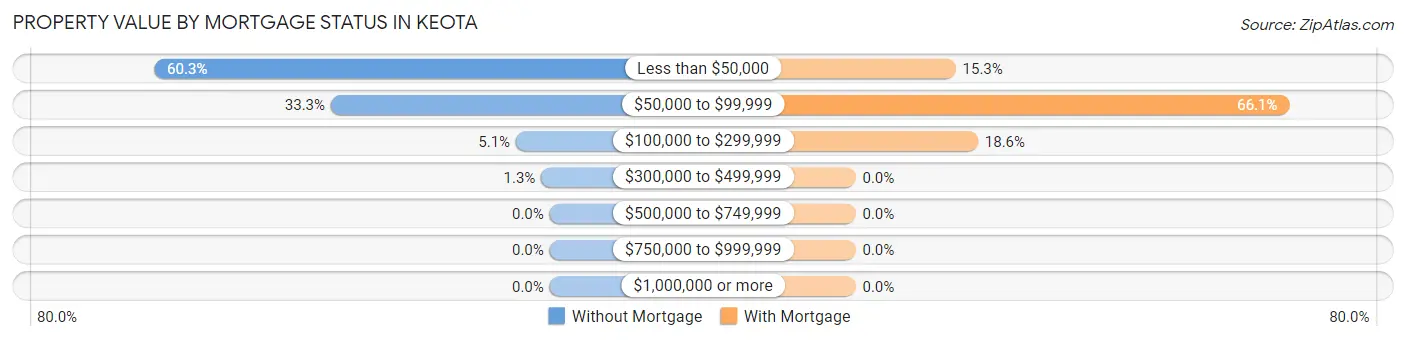
| Property Value | Without Mortgage | With Mortgage |
| Less than $50,000 | 47 (60.3%) | 9 (15.2%) |
| $50,000 to $99,999 | 26 (33.3%) | 39 (66.1%) |
| $100,000 to $299,999 | 4 (5.1%) | 11 (18.6%) |
| $300,000 to $499,999 | 1 (1.3%) | 0 (0.0%) |
| $500,000 to $749,999 | 0 (0.0%) | 0 (0.0%) |
| $750,000 to $999,999 | 0 (0.0%) | 0 (0.0%) |
| $1,000,000 or more | 0 (0.0%) | 0 (0.0%) |
| Total | 78 (100.0%) | 59 (100.0%) |
Household Income by Mortgage Status in Keota
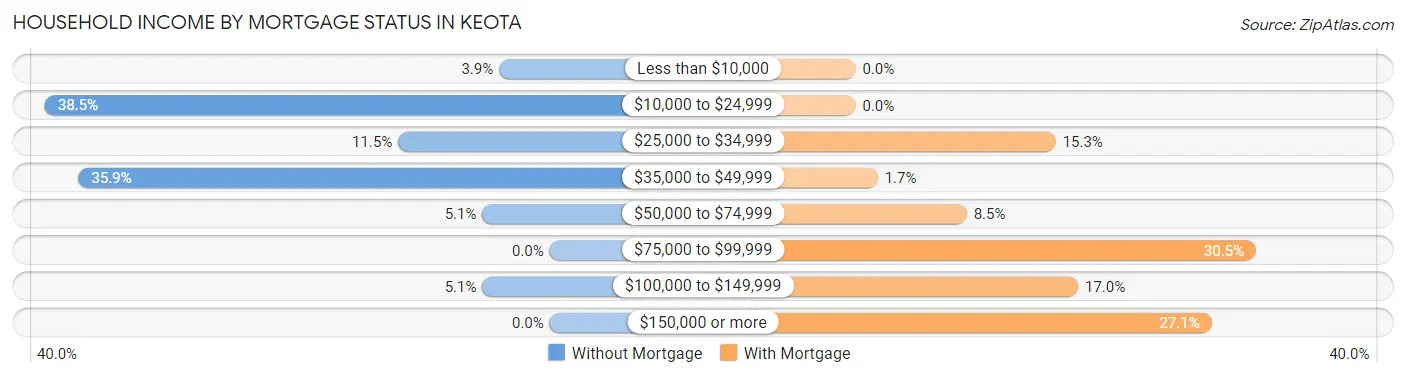
| Household Income | Without Mortgage | With Mortgage |
| Less than $10,000 | 3 (3.8%) | 0 (0.0%) |
| $10,000 to $24,999 | 30 (38.5%) | 0 (0.0%) |
| $25,000 to $34,999 | 9 (11.5%) | 9 (15.2%) |
| $35,000 to $49,999 | 28 (35.9%) | 1 (1.7%) |
| $50,000 to $74,999 | 4 (5.1%) | 5 (8.5%) |
| $75,000 to $99,999 | 0 (0.0%) | 18 (30.5%) |
| $100,000 to $149,999 | 4 (5.1%) | 10 (17.0%) |
| $150,000 or more | 0 (0.0%) | 16 (27.1%) |
| Total | 78 (100.0%) | 59 (100.0%) |
Property Value to Household Income Ratio in Keota
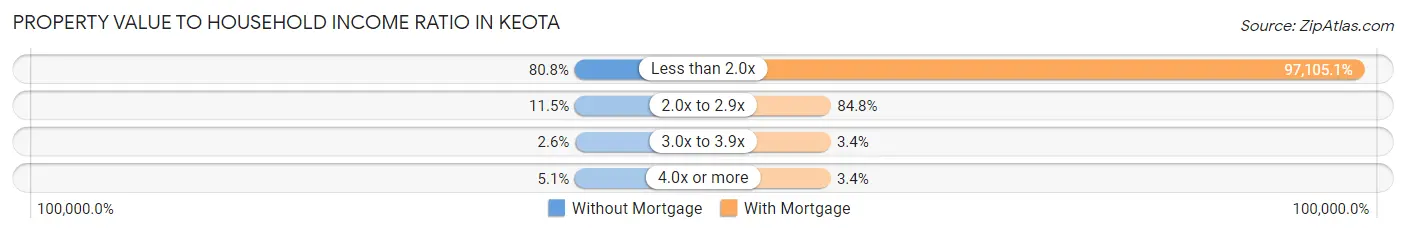
| Value-to-Income Ratio | Without Mortgage | With Mortgage |
| Less than 2.0x | 63 (80.8%) | 57,292 (97,105.1%) |
| 2.0x to 2.9x | 9 (11.5%) | 50 (84.8%) |
| 3.0x to 3.9x | 2 (2.6%) | 2 (3.4%) |
| 4.0x or more | 4 (5.1%) | 2 (3.4%) |
| Total | 78 (100.0%) | 59 (100.0%) |
Real Estate Taxes by Mortgage Status in Keota
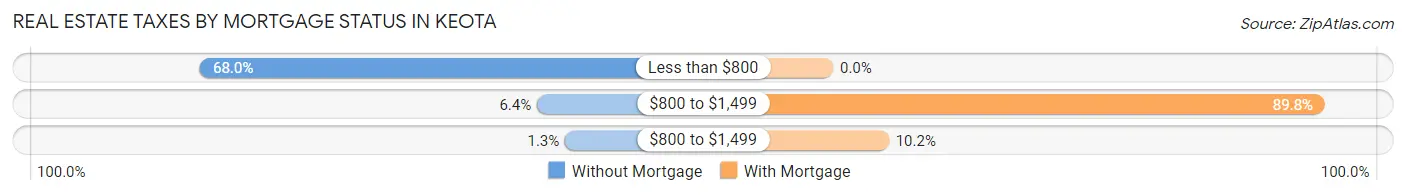
| Property Taxes | Without Mortgage | With Mortgage |
| Less than $800 | 53 (67.9%) | 0 (0.0%) |
| $800 to $1,499 | 5 (6.4%) | 53 (89.8%) |
| $800 to $1,499 | 1 (1.3%) | 6 (10.2%) |
| Total | 78 (100.0%) | 59 (100.0%) |
Health & Disability in Keota
Health Insurance Coverage by Age in Keota
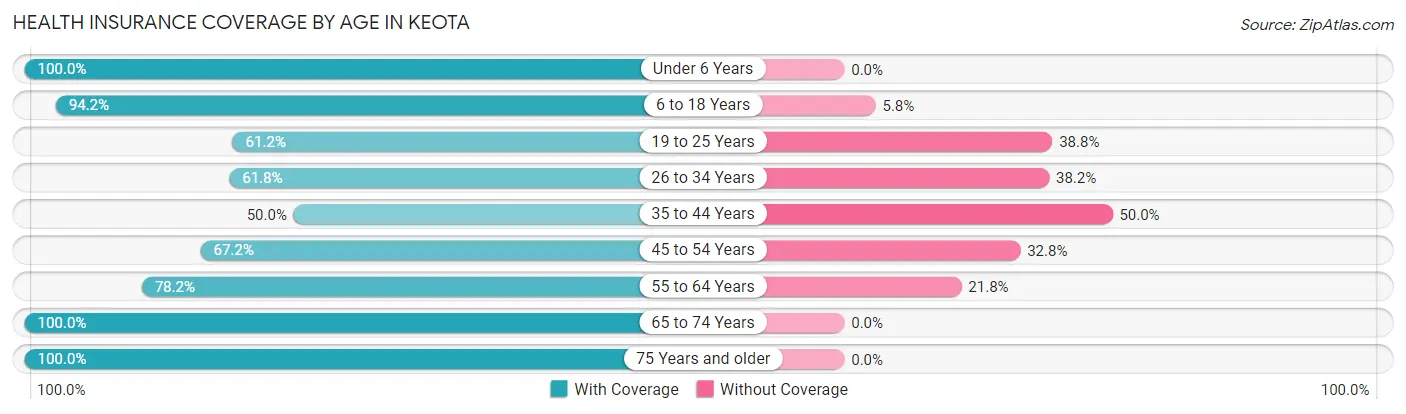
| Age Bracket | With Coverage | Without Coverage |
| Under 6 Years | 21 (100.0%) | 0 (0.0%) |
| 6 to 18 Years | 113 (94.2%) | 7 (5.8%) |
| 19 to 25 Years | 30 (61.2%) | 19 (38.8%) |
| 26 to 34 Years | 34 (61.8%) | 21 (38.2%) |
| 35 to 44 Years | 19 (50.0%) | 19 (50.0%) |
| 45 to 54 Years | 43 (67.2%) | 21 (32.8%) |
| 55 to 64 Years | 68 (78.2%) | 19 (21.8%) |
| 65 to 74 Years | 40 (100.0%) | 0 (0.0%) |
| 75 Years and older | 51 (100.0%) | 0 (0.0%) |
| Total | 419 (79.8%) | 106 (20.2%) |
Health Insurance Coverage by Citizenship Status in Keota
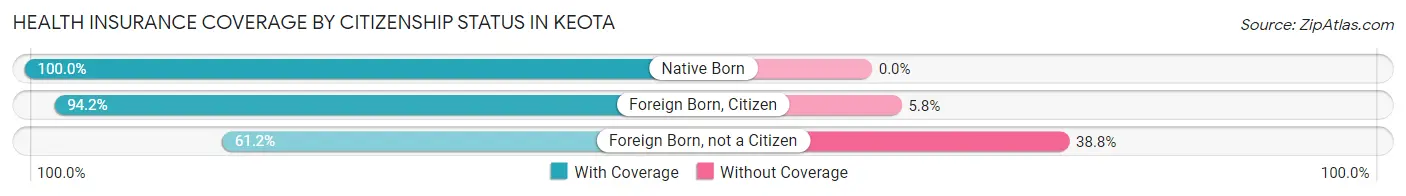
| Citizenship Status | With Coverage | Without Coverage |
| Native Born | 21 (100.0%) | 0 (0.0%) |
| Foreign Born, Citizen | 113 (94.2%) | 7 (5.8%) |
| Foreign Born, not a Citizen | 30 (61.2%) | 19 (38.8%) |
Health Insurance Coverage by Household Income in Keota
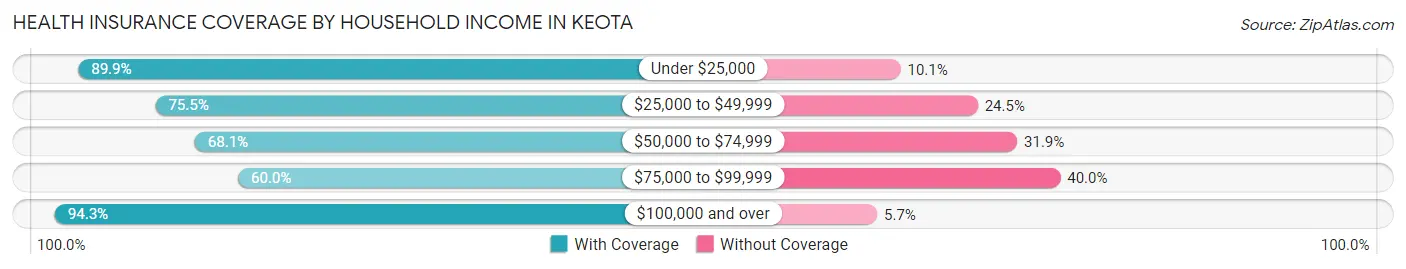
| Household Income | With Coverage | Without Coverage |
| Under $25,000 | 125 (89.9%) | 14 (10.1%) |
| $25,000 to $49,999 | 120 (75.5%) | 39 (24.5%) |
| $50,000 to $74,999 | 64 (68.1%) | 30 (31.9%) |
| $75,000 to $99,999 | 27 (60.0%) | 18 (40.0%) |
| $100,000 and over | 83 (94.3%) | 5 (5.7%) |
Public vs Private Health Insurance Coverage by Age in Keota
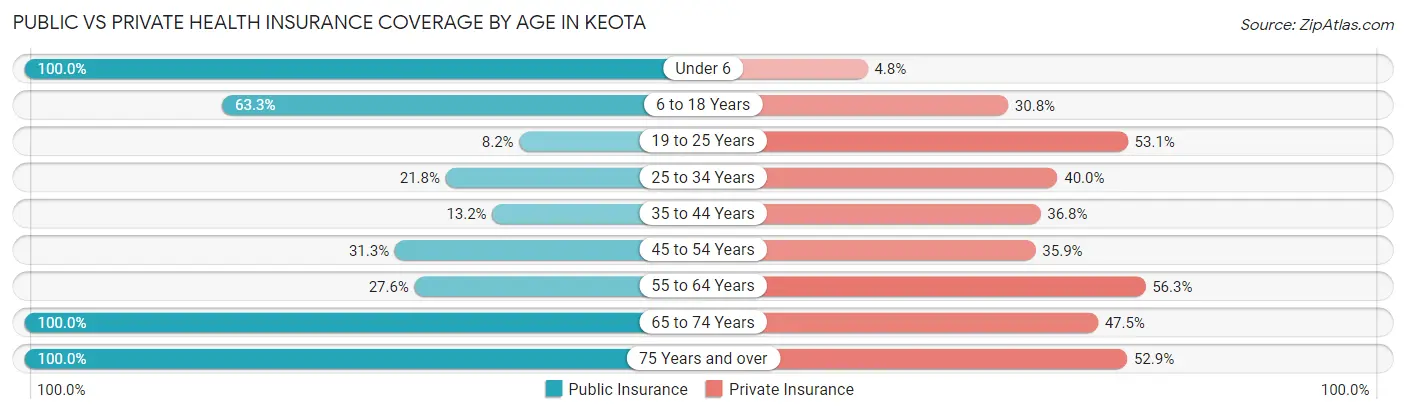
| Age Bracket | Public Insurance | Private Insurance |
| Under 6 | 21 (100.0%) | 1 (4.8%) |
| 6 to 18 Years | 76 (63.3%) | 37 (30.8%) |
| 19 to 25 Years | 4 (8.2%) | 26 (53.1%) |
| 25 to 34 Years | 12 (21.8%) | 22 (40.0%) |
| 35 to 44 Years | 5 (13.2%) | 14 (36.8%) |
| 45 to 54 Years | 20 (31.2%) | 23 (35.9%) |
| 55 to 64 Years | 24 (27.6%) | 49 (56.3%) |
| 65 to 74 Years | 40 (100.0%) | 19 (47.5%) |
| 75 Years and over | 51 (100.0%) | 27 (52.9%) |
| Total | 253 (48.2%) | 218 (41.5%) |
Disability Status by Sex by Age in Keota
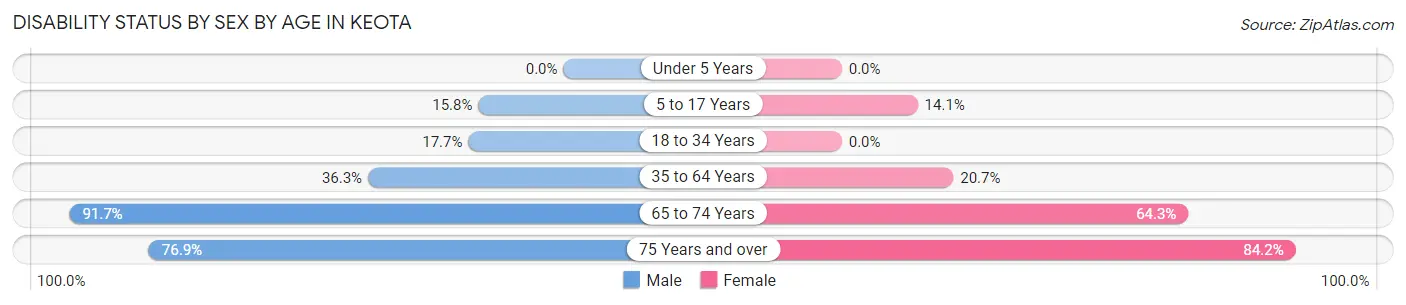
| Age Bracket | Male | Female |
| Under 5 Years | 0 (0.0%) | 0 (0.0%) |
| 5 to 17 Years | 6 (15.8%) | 10 (14.1%) |
| 18 to 34 Years | 9 (17.6%) | 0 (0.0%) |
| 35 to 64 Years | 37 (36.3%) | 18 (20.7%) |
| 65 to 74 Years | 11 (91.7%) | 18 (64.3%) |
| 75 Years and over | 10 (76.9%) | 32 (84.2%) |
Disability Class by Sex by Age in Keota
Disability Class: Hearing Difficulty
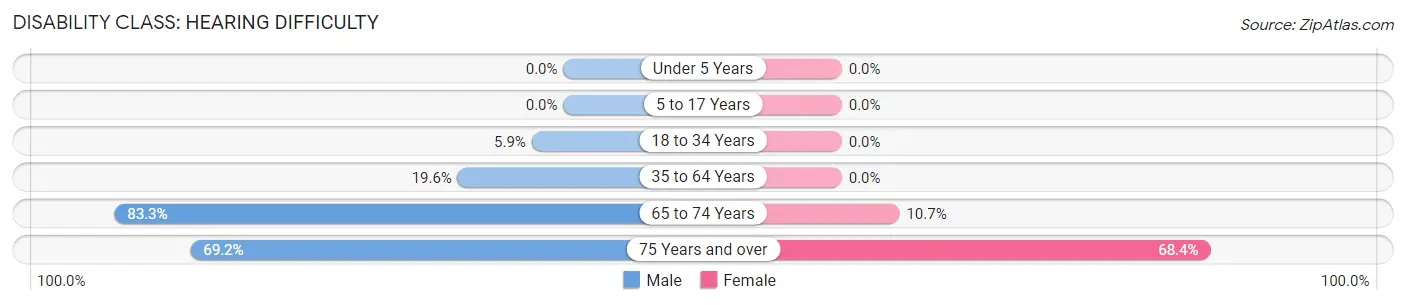
| Age Bracket | Male | Female |
| Under 5 Years | 0 (0.0%) | 0 (0.0%) |
| 5 to 17 Years | 0 (0.0%) | 0 (0.0%) |
| 18 to 34 Years | 3 (5.9%) | 0 (0.0%) |
| 35 to 64 Years | 20 (19.6%) | 0 (0.0%) |
| 65 to 74 Years | 10 (83.3%) | 3 (10.7%) |
| 75 Years and over | 9 (69.2%) | 26 (68.4%) |
Disability Class: Vision Difficulty
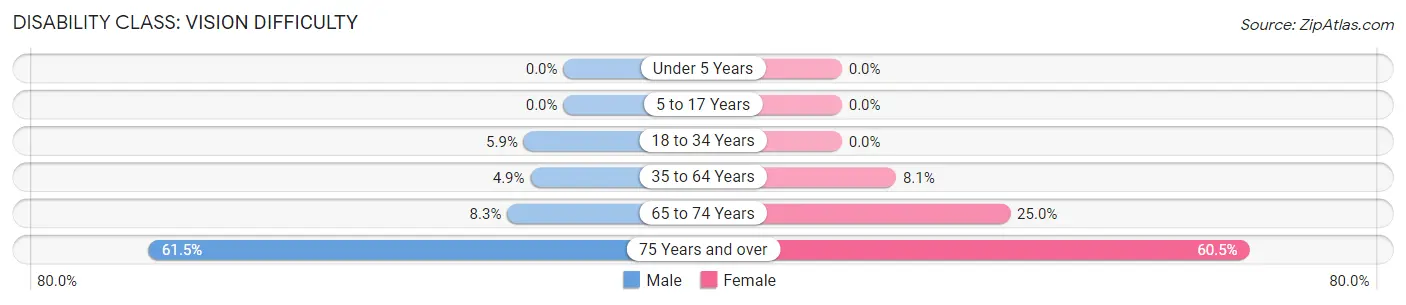
| Age Bracket | Male | Female |
| Under 5 Years | 0 (0.0%) | 0 (0.0%) |
| 5 to 17 Years | 0 (0.0%) | 0 (0.0%) |
| 18 to 34 Years | 3 (5.9%) | 0 (0.0%) |
| 35 to 64 Years | 5 (4.9%) | 7 (8.1%) |
| 65 to 74 Years | 1 (8.3%) | 7 (25.0%) |
| 75 Years and over | 8 (61.5%) | 23 (60.5%) |
Disability Class: Cognitive Difficulty
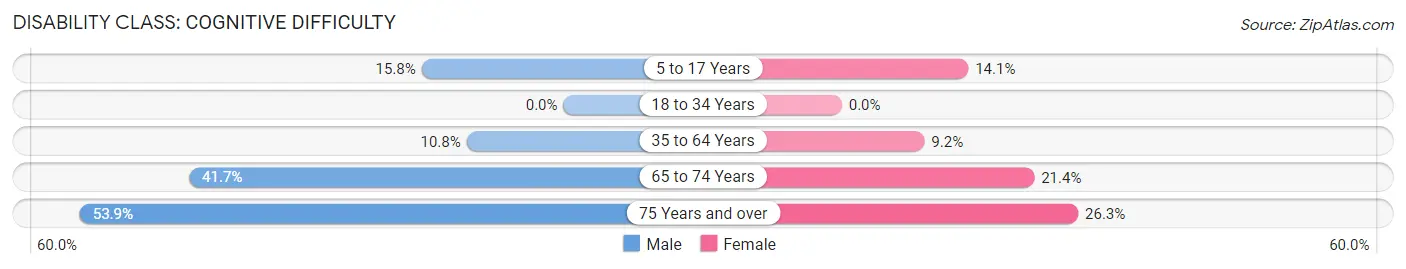
| Age Bracket | Male | Female |
| 5 to 17 Years | 6 (15.8%) | 10 (14.1%) |
| 18 to 34 Years | 0 (0.0%) | 0 (0.0%) |
| 35 to 64 Years | 11 (10.8%) | 8 (9.2%) |
| 65 to 74 Years | 5 (41.7%) | 6 (21.4%) |
| 75 Years and over | 7 (53.8%) | 10 (26.3%) |
Disability Class: Ambulatory Difficulty
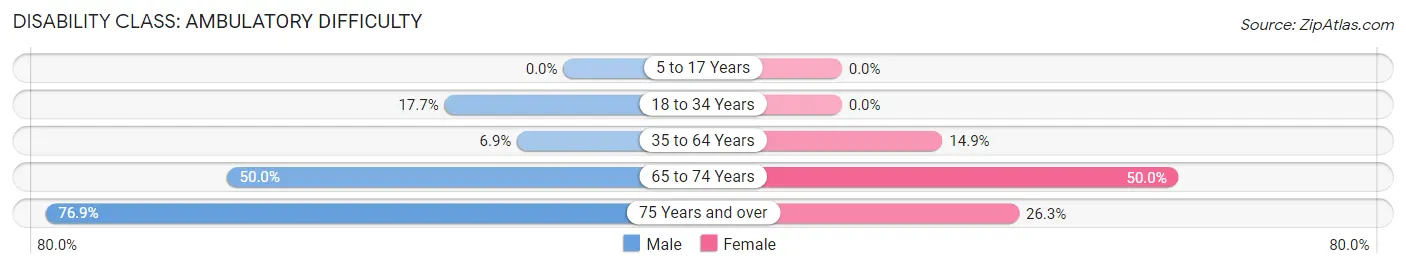
| Age Bracket | Male | Female |
| 5 to 17 Years | 0 (0.0%) | 0 (0.0%) |
| 18 to 34 Years | 9 (17.6%) | 0 (0.0%) |
| 35 to 64 Years | 7 (6.9%) | 13 (14.9%) |
| 65 to 74 Years | 6 (50.0%) | 14 (50.0%) |
| 75 Years and over | 10 (76.9%) | 10 (26.3%) |
Disability Class: Self-Care Difficulty
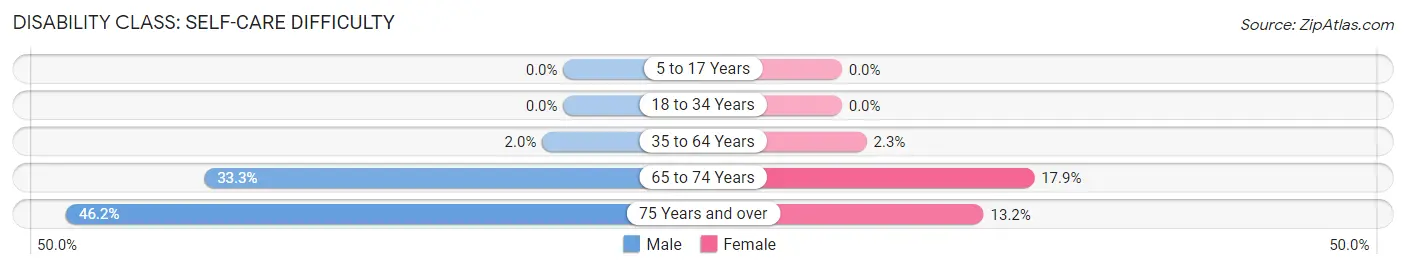
| Age Bracket | Male | Female |
| 5 to 17 Years | 0 (0.0%) | 0 (0.0%) |
| 18 to 34 Years | 0 (0.0%) | 0 (0.0%) |
| 35 to 64 Years | 2 (2.0%) | 2 (2.3%) |
| 65 to 74 Years | 4 (33.3%) | 5 (17.9%) |
| 75 Years and over | 6 (46.2%) | 5 (13.2%) |
Technology Access in Keota
Computing Device Access in Keota
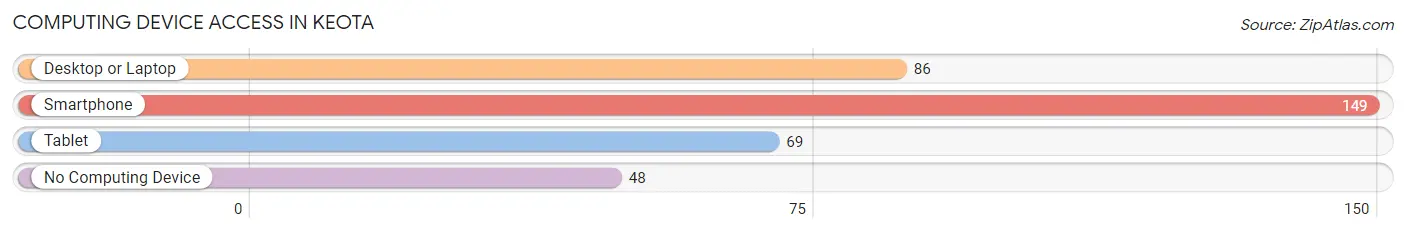
| Device Type | # Households | % Households |
| Desktop or Laptop | 86 | 43.2% |
| Smartphone | 149 | 74.9% |
| Tablet | 69 | 34.7% |
| No Computing Device | 48 | 24.1% |
| Total | 199 | 100.0% |
Internet Access in Keota
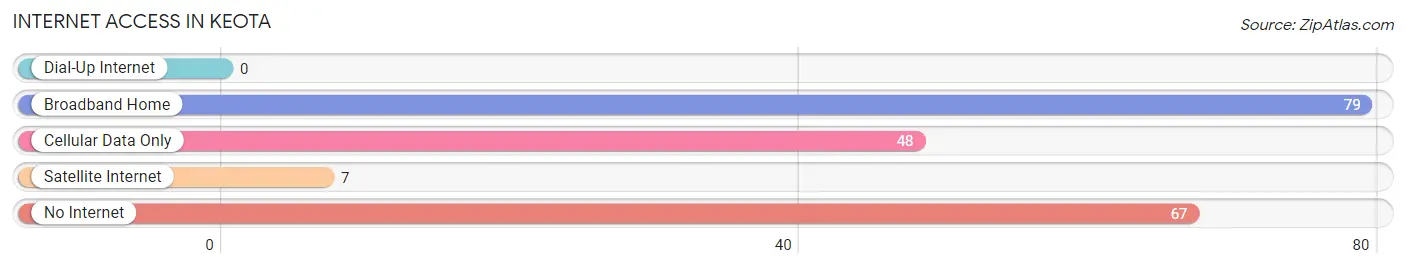
| Internet Type | # Households | % Households |
| Dial-Up Internet | 0 | 0.0% |
| Broadband Home | 79 | 39.7% |
| Cellular Data Only | 48 | 24.1% |
| Satellite Internet | 7 | 3.5% |
| No Internet | 67 | 33.7% |
| Total | 199 | 100.0% |
Keota Summary
Keota is a small town located in the southeastern corner of Oklahoma, in Haskell County. It is situated on the banks of the Arkansas River, and is surrounded by rolling hills and wooded areas. The town has a population of just over 1,000 people, and is known for its rural charm and friendly atmosphere.
Geography
Keota is located in the southeastern corner of Oklahoma, in Haskell County. It is situated on the banks of the Arkansas River, and is surrounded by rolling hills and wooded areas. The town is located at an elevation of 845 feet above sea level, and has an area of 1.2 square miles. The climate in Keota is humid subtropical, with hot summers and mild winters.
History
Keota was founded in 1891 by the Choctaw Nation, and was named after the Choctaw word for “peace.” The town was originally a trading post, and was a popular stop for travelers on the Arkansas River. In the early 1900s, Keota began to grow as a farming community, and the town was incorporated in 1909. In the 1920s, the town experienced a period of growth, and several businesses were established. In the 1950s, the town began to decline, and many of the businesses closed. In the 1970s, the town experienced a resurgence, and several new businesses opened.
Economy
Keota’s economy is largely based on agriculture, with the town’s main crops being cotton, corn, and soybeans. The town also has a small manufacturing sector, with several small businesses producing furniture, clothing, and other goods. The town also has a few retail stores, and a few restaurants.
Demographics
As of the 2010 census, Keota had a population of 1,072 people. The racial makeup of the town was 95.3% White, 0.9% African American, 0.7% Native American, 0.2% Asian, 0.1% Pacific Islander, and 2.8% from other races. The median household income was $30,938, and the median family income was $37,500. The per capita income was $15,945.
Keota is a small town with a rich history and a friendly atmosphere. The town’s economy is largely based on agriculture, and the town has a few small businesses and retail stores. The town has a diverse population, and the median household income is slightly below the national average. Keota is a great place to live, and is a great example of rural Oklahoma life.
Common Questions
What is Per Capita Income in Keota?
Per Capita income in Keota is $18,239.
What is the Median Family Income in Keota?
Median Family Income in Keota is $48,750.
What is the Median Household income in Keota?
Median Household Income in Keota is $38,472.
What is Income or Wage Gap in Keota?
Income or Wage Gap in Keota is 47.6%.
Women in Keota earn 52.4 cents for every dollar earned by a man.
What is Inequality or Gini Index in Keota?
Inequality or Gini Index in Keota is 0.39.
What is the Total Population of Keota?
Total Population of Keota is 525.
What is the Total Male Population of Keota?
Total Male Population of Keota is 218.
What is the Total Female Population of Keota?
Total Female Population of Keota is 307.
What is the Ratio of Males per 100 Females in Keota?
There are 71.01 Males per 100 Females in Keota.
What is the Ratio of Females per 100 Males in Keota?
There are 140.83 Females per 100 Males in Keota.
What is the Median Population Age in Keota?
Median Population Age in Keota is 39.6 Years.
What is the Average Family Size in Keota
Average Family Size in Keota is 3.3 People.
What is the Average Household Size in Keota
Average Household Size in Keota is 2.6 People.
How Large is the Labor Force in Keota?
There are 169 People in the Labor Forcein in Keota.
What is the Percentage of People in the Labor Force in Keota?
40.3% of People are in the Labor Force in Keota.