Inola, OK Map & Demographics
Inola Map
Inola Overview
$28,690
PER CAPITA INCOME
$69,688
AVG FAMILY INCOME
$57,679
AVG HOUSEHOLD INCOME
34.6%
WAGE / INCOME GAP [ % ]
65.4¢/ $1
WAGE / INCOME GAP [ $ ]
0.39
INEQUALITY / GINI INDEX
1,879
TOTAL POPULATION
898
MALE POPULATION
981
FEMALE POPULATION
91.54
MALES / 100 FEMALES
109.24
FEMALES / 100 MALES
36.3
MEDIAN AGE
3.1
AVG FAMILY SIZE
2.6
AVG HOUSEHOLD SIZE
931
LABOR FORCE [ PEOPLE ]
61.6%
PERCENT IN LABOR FORCE
9.1%
UNEMPLOYMENT RATE
Inola Zip Codes
Inola Area Codes
Income in Inola
Income Overview in Inola
Per Capita Income in Inola is $28,690, while median incomes of families and households are $69,688 and $57,679 respectively.
| Characteristic | Number | Measure |
| Per Capita Income | 1,879 | $28,690 |
| Median Family Income | 506 | $69,688 |
| Mean Family Income | 506 | $81,546 |
| Median Household Income | 708 | $57,679 |
| Mean Household Income | 708 | $71,706 |
| Income Deficit | 506 | $0 |
| Wage / Income Gap (%) | 1,879 | 34.58% |
| Wage / Income Gap ($) | 1,879 | 65.42¢ per $1 |
| Gini / Inequality Index | 1,879 | 0.39 |
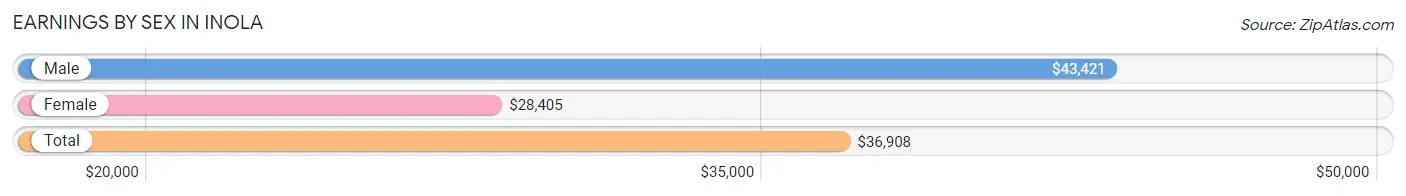
Earnings by Sex in Inola
Average Earnings in Inola are $36,908, $43,421 for men and $28,405 for women, a difference of 34.6%.
| Sex | Number | Average Earnings |
| Male | 512 (52.7%) | $43,421 |
| Female | 459 (47.3%) | $28,405 |
| Total | 971 (100.0%) | $36,908 |
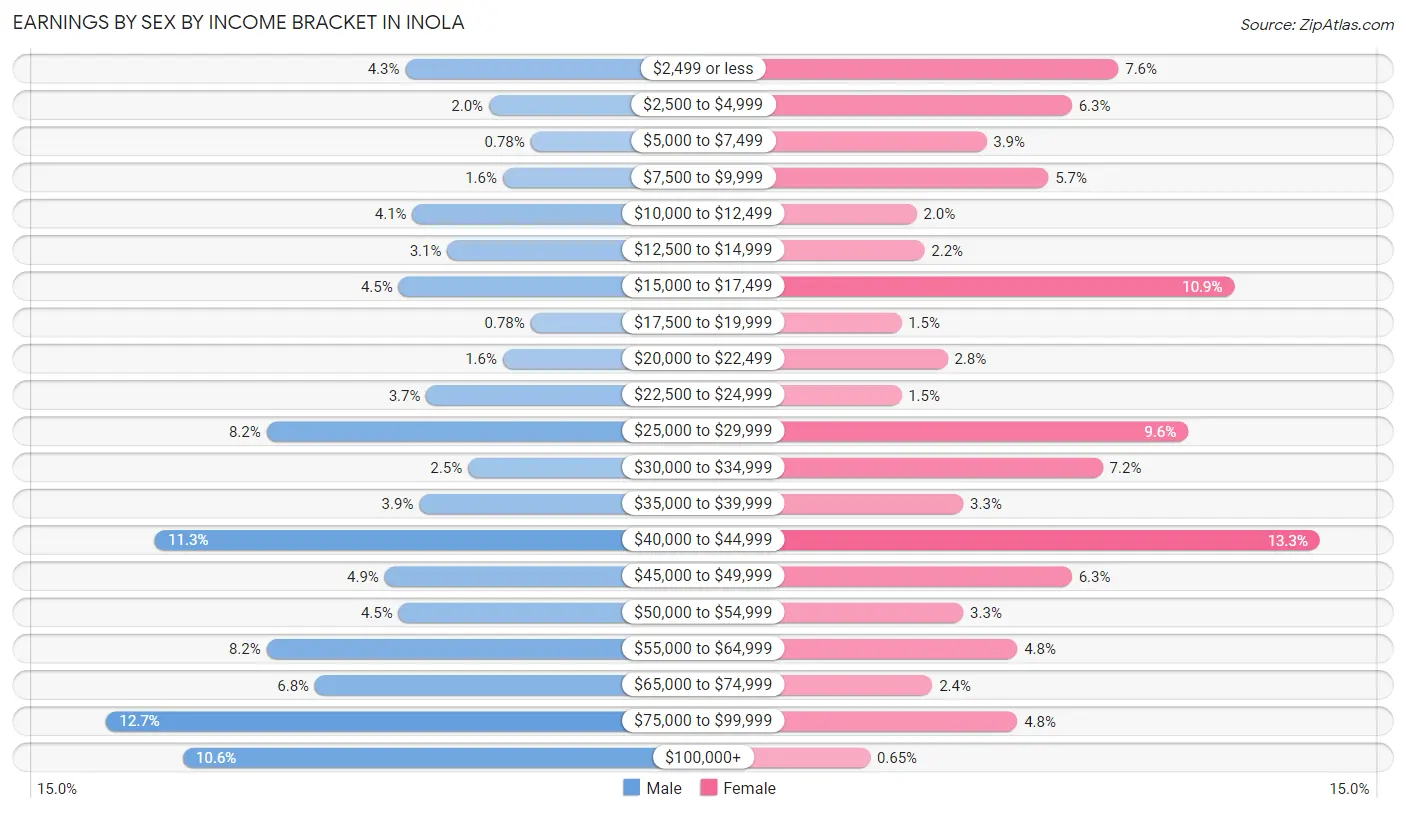
Earnings by Sex by Income Bracket in Inola
The most common earnings brackets in Inola are $75,000 to $99,999 for men (65 | 12.7%) and $40,000 to $44,999 for women (61 | 13.3%).
| Income | Male | Female |
| $2,499 or less | 22 (4.3%) | 35 (7.6%) |
| $2,500 to $4,999 | 10 (1.9%) | 29 (6.3%) |
| $5,000 to $7,499 | 4 (0.8%) | 18 (3.9%) |
| $7,500 to $9,999 | 8 (1.6%) | 26 (5.7%) |
| $10,000 to $12,499 | 21 (4.1%) | 9 (2.0%) |
| $12,500 to $14,999 | 16 (3.1%) | 10 (2.2%) |
| $15,000 to $17,499 | 23 (4.5%) | 50 (10.9%) |
| $17,500 to $19,999 | 4 (0.8%) | 7 (1.5%) |
| $20,000 to $22,499 | 8 (1.6%) | 13 (2.8%) |
| $22,500 to $24,999 | 19 (3.7%) | 7 (1.5%) |
| $25,000 to $29,999 | 42 (8.2%) | 44 (9.6%) |
| $30,000 to $34,999 | 13 (2.5%) | 33 (7.2%) |
| $35,000 to $39,999 | 20 (3.9%) | 15 (3.3%) |
| $40,000 to $44,999 | 58 (11.3%) | 61 (13.3%) |
| $45,000 to $49,999 | 25 (4.9%) | 29 (6.3%) |
| $50,000 to $54,999 | 23 (4.5%) | 15 (3.3%) |
| $55,000 to $64,999 | 42 (8.2%) | 22 (4.8%) |
| $65,000 to $74,999 | 35 (6.8%) | 11 (2.4%) |
| $75,000 to $99,999 | 65 (12.7%) | 22 (4.8%) |
| $100,000+ | 54 (10.5%) | 3 (0.6%) |
| Total | 512 (100.0%) | 459 (100.0%) |
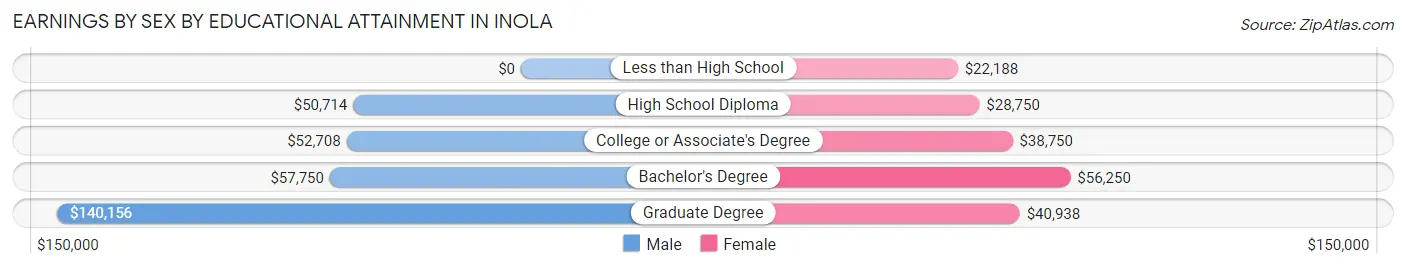
Earnings by Sex by Educational Attainment in Inola
Average earnings in Inola are $51,544 for men and $33,929 for women, a difference of 34.2%. Men with an educational attainment of graduate degree enjoy the highest average annual earnings of $140,156, while those with high school diploma education earn the least with $50,714. Women with an educational attainment of bachelor's degree earn the most with the average annual earnings of $56,250, while those with less than high school education have the smallest earnings of $22,188.
| Educational Attainment | Male Income | Female Income |
| Less than High School | - | - |
| High School Diploma | $50,714 | $28,750 |
| College or Associate's Degree | $52,708 | $38,750 |
| Bachelor's Degree | $57,750 | $56,250 |
| Graduate Degree | $140,156 | $40,938 |
| Total | $51,544 | $33,929 |
Family Income in Inola
Family Income Brackets in Inola
According to the Inola family income data, there are 110 families falling into the $100,000 to $149,999 income range, which is the most common income bracket and makes up 21.7% of all families. Conversely, the $10,000 to $14,999 income bracket is the least frequent group with only 16 families (3.2%) belonging to this category.
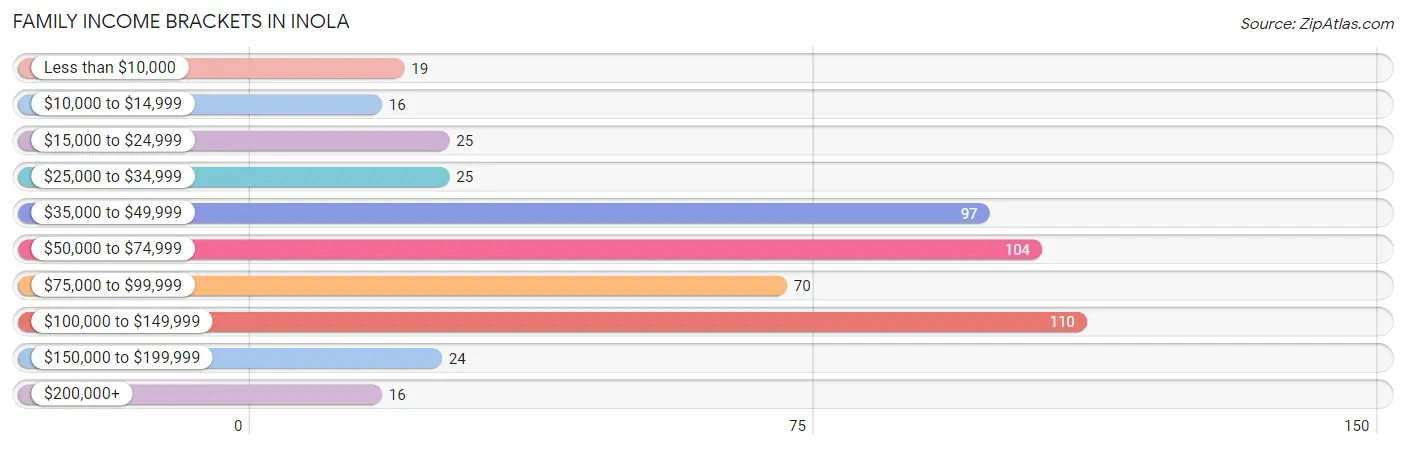
| Income Bracket | # Families | % Families |
| Less than $10,000 | 19 | 3.8% |
| $10,000 to $14,999 | 16 | 3.2% |
| $15,000 to $24,999 | 25 | 4.9% |
| $25,000 to $34,999 | 25 | 4.9% |
| $35,000 to $49,999 | 97 | 19.2% |
| $50,000 to $74,999 | 104 | 20.6% |
| $75,000 to $99,999 | 70 | 13.8% |
| $100,000 to $149,999 | 110 | 21.7% |
| $150,000 to $199,999 | 24 | 4.7% |
| $200,000+ | 16 | 3.2% |
Family Income by Famaliy Size in Inola
4-person families (55 | 10.9%) account for the highest median family income in Inola with $95,417 per family, while 2-person families (238 | 47.0%) have the highest median income of $31,375 per family member.
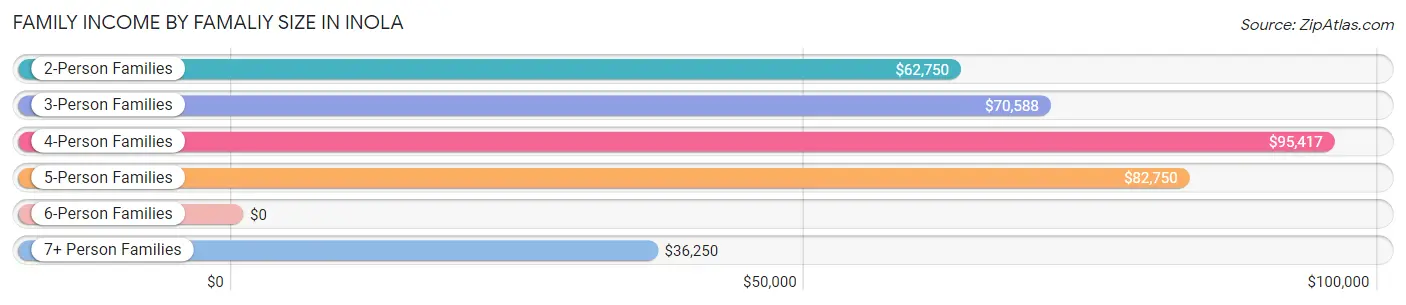
| Income Bracket | # Families | Median Income |
| 2-Person Families | 238 (47.0%) | $62,750 |
| 3-Person Families | 138 (27.3%) | $70,588 |
| 4-Person Families | 55 (10.9%) | $95,417 |
| 5-Person Families | 61 (12.1%) | $82,750 |
| 6-Person Families | 5 (1.0%) | $0 |
| 7+ Person Families | 9 (1.8%) | $36,250 |
| Total | 506 (100.0%) | $69,688 |
Family Income by Number of Earners in Inola
The median family income in Inola is $69,688, with families comprising 3+ earners (56) having the highest median family income of $141,667, while families with no earners (62) have the lowest median family income of $36,250, accounting for 11.1% and 12.2% of families, respectively.
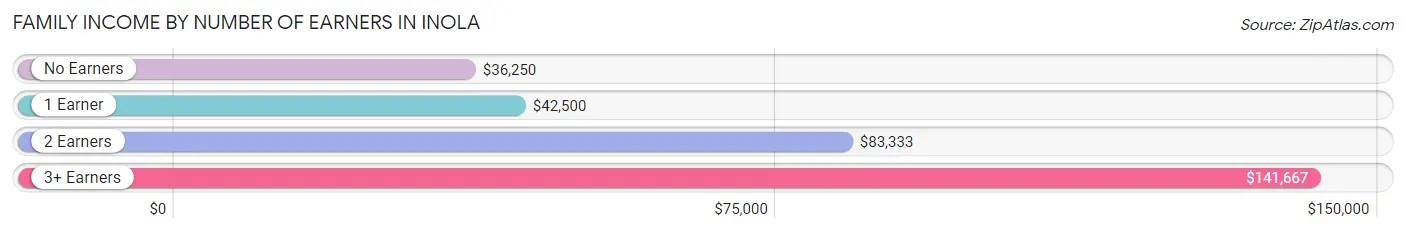
| Number of Earners | # Families | Median Income |
| No Earners | 62 (12.2%) | $36,250 |
| 1 Earner | 174 (34.4%) | $42,500 |
| 2 Earners | 214 (42.3%) | $83,333 |
| 3+ Earners | 56 (11.1%) | $141,667 |
| Total | 506 (100.0%) | $69,688 |
Household Income in Inola
Household Income Brackets in Inola
With 157 households falling in the category, the $50,000 to $74,999 income range is the most frequent in Inola, accounting for 22.2% of all households. In contrast, only 16 households (2.3%) fall into the $200,000+ income bracket, making it the least populous group.
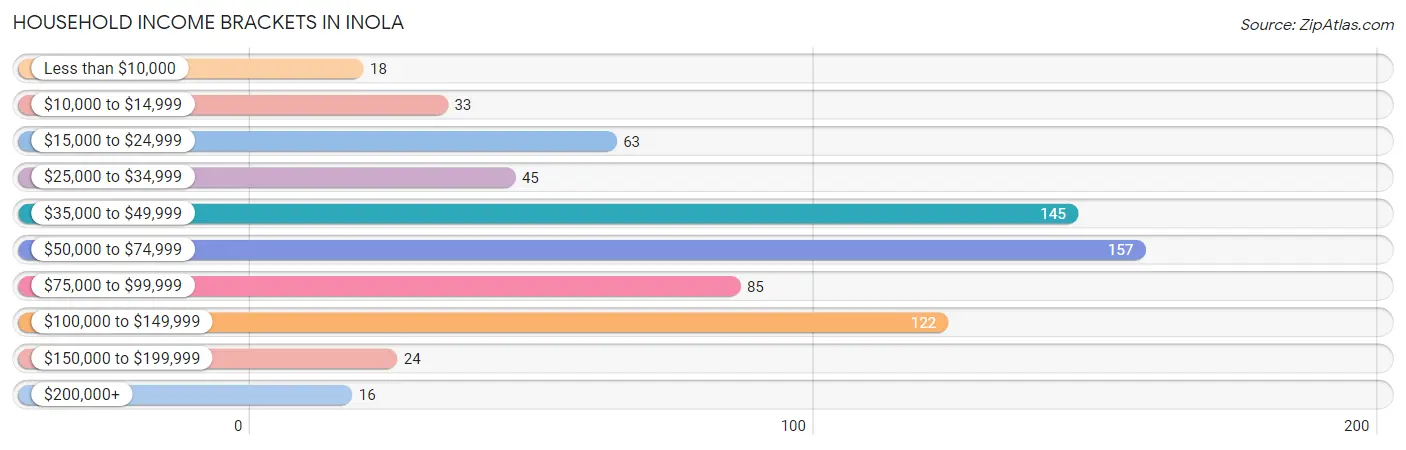
| Income Bracket | # Households | % Households |
| Less than $10,000 | 18 | 2.5% |
| $10,000 to $14,999 | 33 | 4.7% |
| $15,000 to $24,999 | 63 | 8.9% |
| $25,000 to $34,999 | 45 | 6.4% |
| $35,000 to $49,999 | 145 | 20.5% |
| $50,000 to $74,999 | 157 | 22.2% |
| $75,000 to $99,999 | 85 | 12.0% |
| $100,000 to $149,999 | 122 | 17.2% |
| $150,000 to $199,999 | 24 | 3.4% |
| $200,000+ | 16 | 2.3% |
Household Income by Householder Age in Inola
The median household income in Inola is $57,679, with the highest median household income of $71,111 found in the 45 to 64 years age bracket for the primary householder. A total of 284 households (40.1%) fall into this category. Meanwhile, the 65+ years age bracket for the primary householder has the lowest median household income of $41,150, with 201 households (28.4%) in this group.
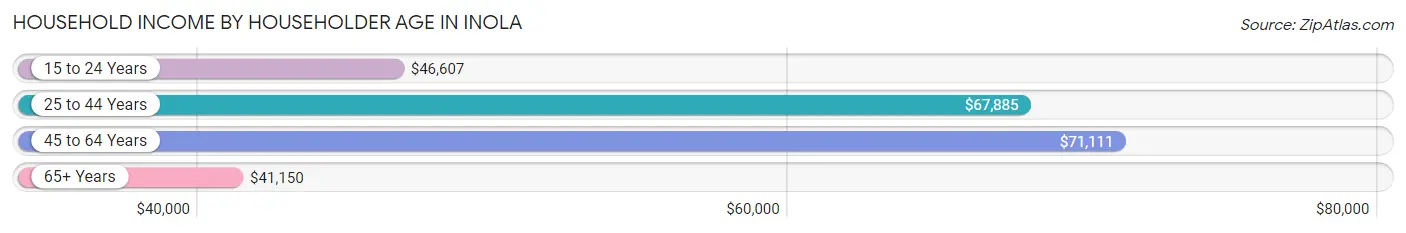
| Income Bracket | # Households | Median Income |
| 15 to 24 Years | 31 (4.4%) | $46,607 |
| 25 to 44 Years | 192 (27.1%) | $67,885 |
| 45 to 64 Years | 284 (40.1%) | $71,111 |
| 65+ Years | 201 (28.4%) | $41,150 |
| Total | 708 (100.0%) | $57,679 |
Poverty in Inola
Income Below Poverty by Sex and Age in Inola
With 9.2% poverty level for males and 10.3% for females among the residents of Inola, under 5 year old males and 5 year old females are the most vulnerable to poverty, with 14 males (28.6%) and 7 females (63.6%) in their respective age groups living below the poverty level.
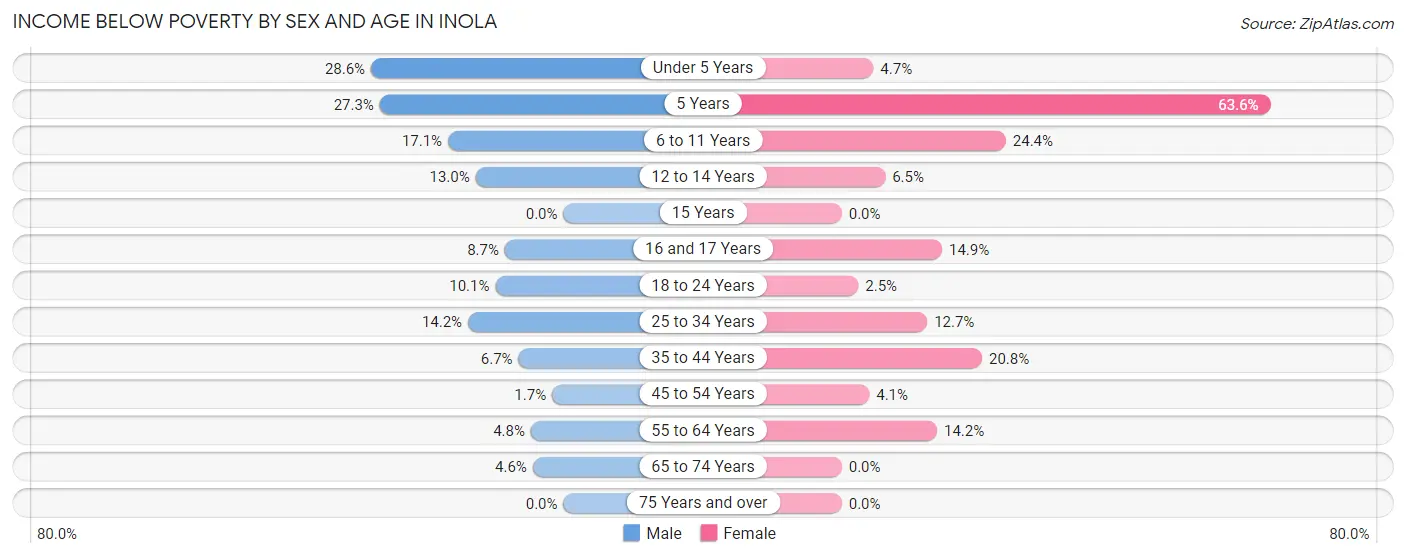
| Age Bracket | Male | Female |
| Under 5 Years | 14 (28.6%) | 3 (4.7%) |
| 5 Years | 6 (27.3%) | 7 (63.6%) |
| 6 to 11 Years | 12 (17.1%) | 19 (24.4%) |
| 12 to 14 Years | 3 (13.0%) | 2 (6.5%) |
| 15 Years | 0 (0.0%) | 0 (0.0%) |
| 16 and 17 Years | 2 (8.7%) | 7 (14.9%) |
| 18 to 24 Years | 10 (10.1%) | 3 (2.5%) |
| 25 to 34 Years | 17 (14.2%) | 18 (12.7%) |
| 35 to 44 Years | 5 (6.7%) | 20 (20.8%) |
| 45 to 54 Years | 2 (1.7%) | 4 (4.1%) |
| 55 to 64 Years | 6 (4.8%) | 15 (14.1%) |
| 65 to 74 Years | 3 (4.5%) | 0 (0.0%) |
| 75 Years and over | 0 (0.0%) | 0 (0.0%) |
| Total | 80 (9.2%) | 98 (10.3%) |
Income Above Poverty by Sex and Age in Inola
According to the poverty statistics in Inola, males aged 15 years and females aged 15 years are the age groups that are most secure financially, with 100.0% of males and 100.0% of females in these age groups living above the poverty line.
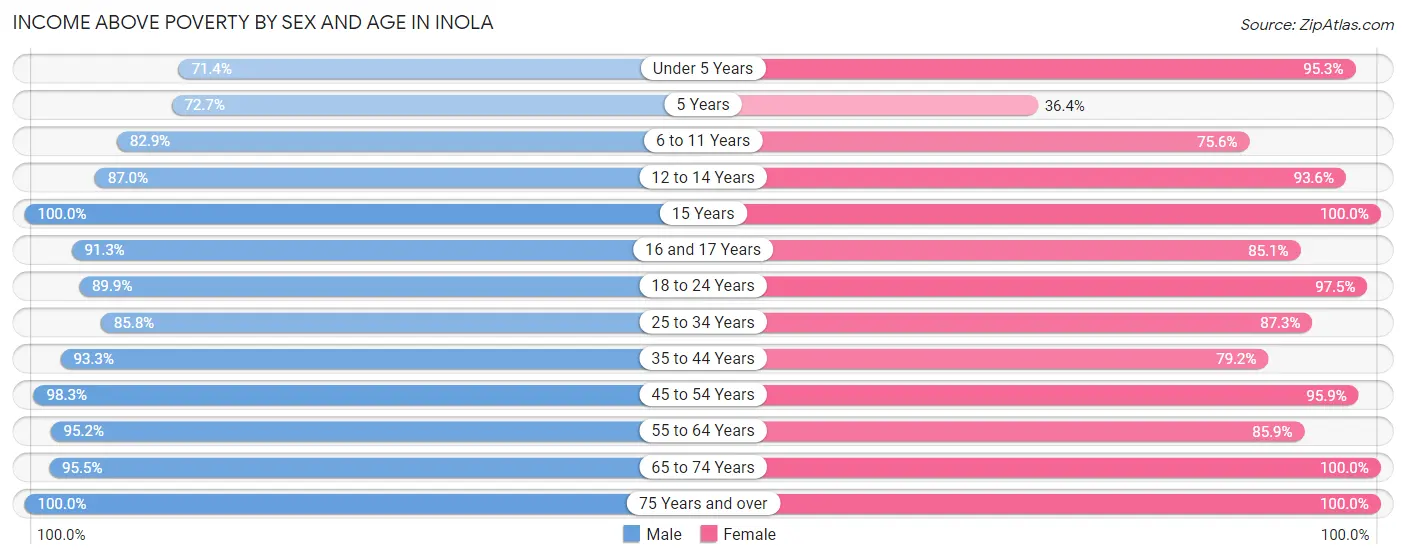
| Age Bracket | Male | Female |
| Under 5 Years | 35 (71.4%) | 61 (95.3%) |
| 5 Years | 16 (72.7%) | 4 (36.4%) |
| 6 to 11 Years | 58 (82.9%) | 59 (75.6%) |
| 12 to 14 Years | 20 (87.0%) | 29 (93.5%) |
| 15 Years | 11 (100.0%) | 6 (100.0%) |
| 16 and 17 Years | 21 (91.3%) | 40 (85.1%) |
| 18 to 24 Years | 89 (89.9%) | 119 (97.5%) |
| 25 to 34 Years | 103 (85.8%) | 124 (87.3%) |
| 35 to 44 Years | 70 (93.3%) | 76 (79.2%) |
| 45 to 54 Years | 116 (98.3%) | 94 (95.9%) |
| 55 to 64 Years | 118 (95.2%) | 91 (85.9%) |
| 65 to 74 Years | 63 (95.5%) | 95 (100.0%) |
| 75 Years and over | 68 (100.0%) | 57 (100.0%) |
| Total | 788 (90.8%) | 855 (89.7%) |
Income Below Poverty Among Married-Couple Families in Inola
The poverty statistics for married-couple families in Inola show that 4.2% or 16 of the total 379 families live below the poverty line. Families with 5 or more children have the highest poverty rate of 100.0%, comprising of 6 families. On the other hand, families with 3 or 4 children have the lowest poverty rate of 0.0%, which includes 0 families.
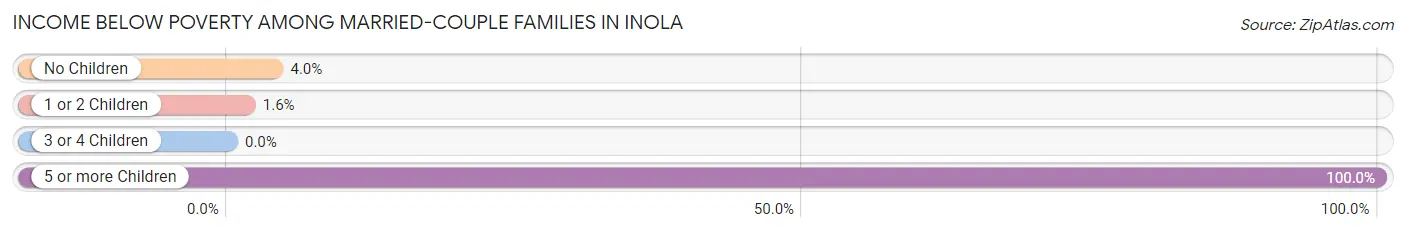
| Children | Above Poverty | Below Poverty |
| No Children | 194 (96.0%) | 8 (4.0%) |
| 1 or 2 Children | 127 (98.5%) | 2 (1.5%) |
| 3 or 4 Children | 42 (100.0%) | 0 (0.0%) |
| 5 or more Children | 0 (0.0%) | 6 (100.0%) |
| Total | 363 (95.8%) | 16 (4.2%) |
Income Below Poverty Among Single-Parent Households in Inola
According to the poverty data in Inola, 14.7% or 5 single-father households and 24.7% or 23 single-mother households are living below the poverty line. Among single-father households, those with no children have the highest poverty rate, with 3 households (21.4%) experiencing poverty. Likewise, among single-mother households, those with 1 or 2 children have the highest poverty rate, with 23 households (48.9%) falling below the poverty line.
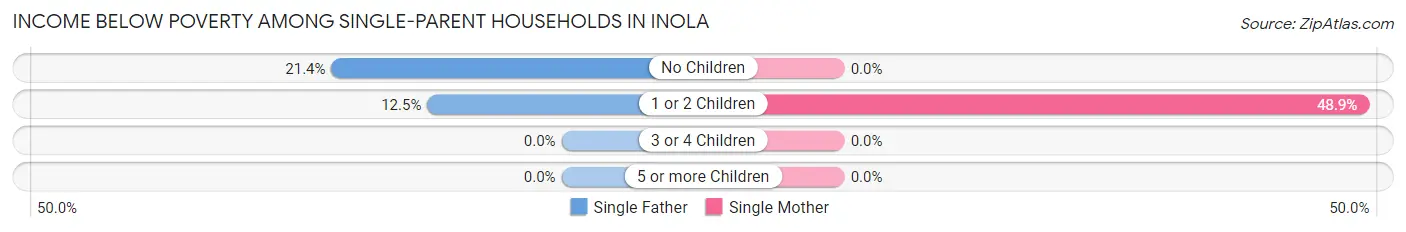
| Children | Single Father | Single Mother |
| No Children | 3 (21.4%) | 0 (0.0%) |
| 1 or 2 Children | 2 (12.5%) | 23 (48.9%) |
| 3 or 4 Children | 0 (0.0%) | 0 (0.0%) |
| 5 or more Children | 0 (0.0%) | 0 (0.0%) |
| Total | 5 (14.7%) | 23 (24.7%) |
Income Below Poverty Among Married-Couple vs Single-Parent Households in Inola
The poverty data for Inola shows that 16 of the married-couple family households (4.2%) and 28 of the single-parent households (22.1%) are living below the poverty level. Within the married-couple family households, those with 5 or more children have the highest poverty rate, with 6 households (100.0%) falling below the poverty line. Among the single-parent households, those with 1 or 2 children have the highest poverty rate, with 25 household (39.7%) living below poverty.
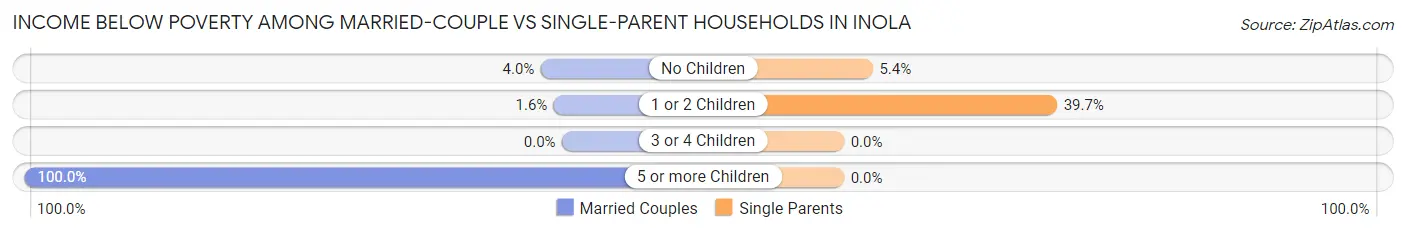
| Children | Married-Couple Families | Single-Parent Households |
| No Children | 8 (4.0%) | 3 (5.4%) |
| 1 or 2 Children | 2 (1.5%) | 25 (39.7%) |
| 3 or 4 Children | 0 (0.0%) | 0 (0.0%) |
| 5 or more Children | 6 (100.0%) | 0 (0.0%) |
| Total | 16 (4.2%) | 28 (22.1%) |
Race in Inola
The most populous races in Inola are White / Caucasian (1,399 | 74.5%), Two or more Races (243 | 12.9%), and Native / Alaskan (193 | 10.3%).
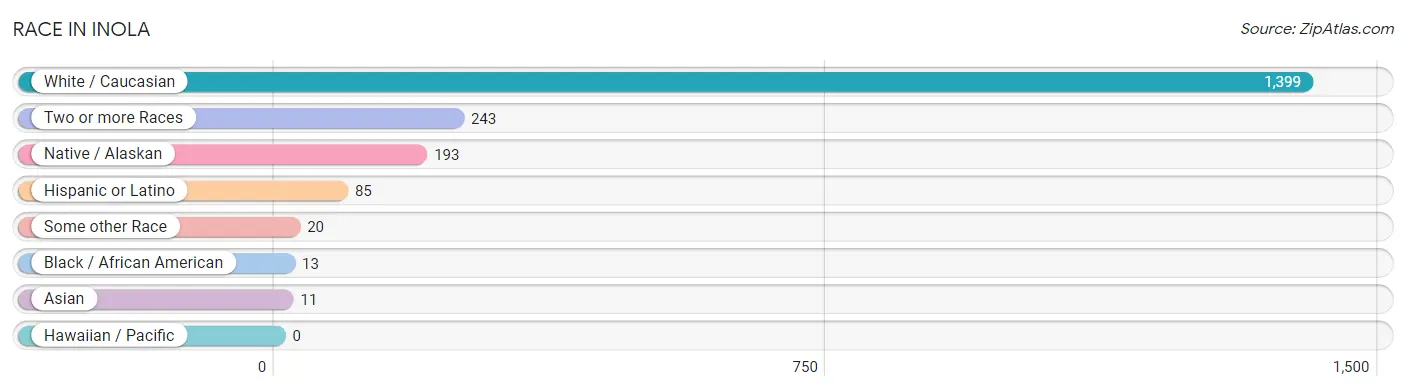
| Race | # Population | % Population |
| Asian | 11 | 0.6% |
| Black / African American | 13 | 0.7% |
| Hawaiian / Pacific | 0 | 0.0% |
| Hispanic or Latino | 85 | 4.5% |
| Native / Alaskan | 193 | 10.3% |
| White / Caucasian | 1,399 | 74.5% |
| Two or more Races | 243 | 12.9% |
| Some other Race | 20 | 1.1% |
| Total | 1,879 | 100.0% |
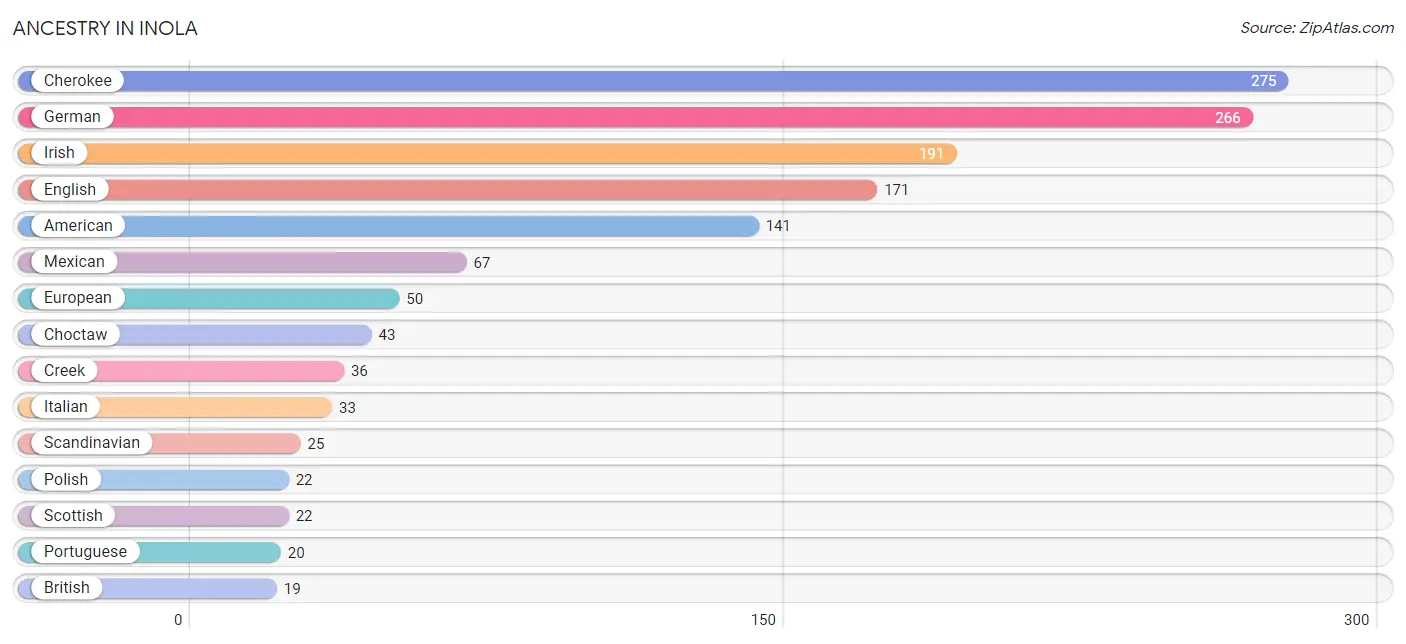
Ancestry in Inola
The most populous ancestries reported in Inola are Cherokee (275 | 14.6%), German (266 | 14.2%), Irish (191 | 10.2%), English (171 | 9.1%), and American (141 | 7.5%), together accounting for 55.6% of all Inola residents.
| Ancestry | # Population | % Population |
| American | 141 | 7.5% |
| British | 19 | 1.0% |
| Burmese | 3 | 0.2% |
| Cajun | 3 | 0.2% |
| Central American | 4 | 0.2% |
| Cherokee | 275 | 14.6% |
| Chickasaw | 3 | 0.2% |
| Choctaw | 43 | 2.3% |
| Creek | 36 | 1.9% |
| Czechoslovakian | 2 | 0.1% |
| Danish | 7 | 0.4% |
| Dutch | 9 | 0.5% |
| Dutch West Indian | 8 | 0.4% |
| Eastern European | 3 | 0.2% |
| English | 171 | 9.1% |
| European | 50 | 2.7% |
| French | 11 | 0.6% |
| French Canadian | 6 | 0.3% |
| German | 266 | 14.2% |
| Guatemalan | 4 | 0.2% |
| Irish | 191 | 10.2% |
| Italian | 33 | 1.8% |
| Korean | 7 | 0.4% |
| Laotian | 4 | 0.2% |
| Liberian | 4 | 0.2% |
| Mexican | 67 | 3.6% |
| Northern European | 3 | 0.2% |
| Norwegian | 9 | 0.5% |
| Osage | 12 | 0.6% |
| Polish | 22 | 1.2% |
| Portuguese | 20 | 1.1% |
| Puerto Rican | 4 | 0.2% |
| Scandinavian | 25 | 1.3% |
| Scotch-Irish | 15 | 0.8% |
| Scottish | 22 | 1.2% |
| Slavic | 7 | 0.4% |
| Slovak | 7 | 0.4% |
| Spaniard | 4 | 0.2% |
| Subsaharan African | 4 | 0.2% |
| Swedish | 8 | 0.4% | View All 40 Rows |
Immigrants in Inola
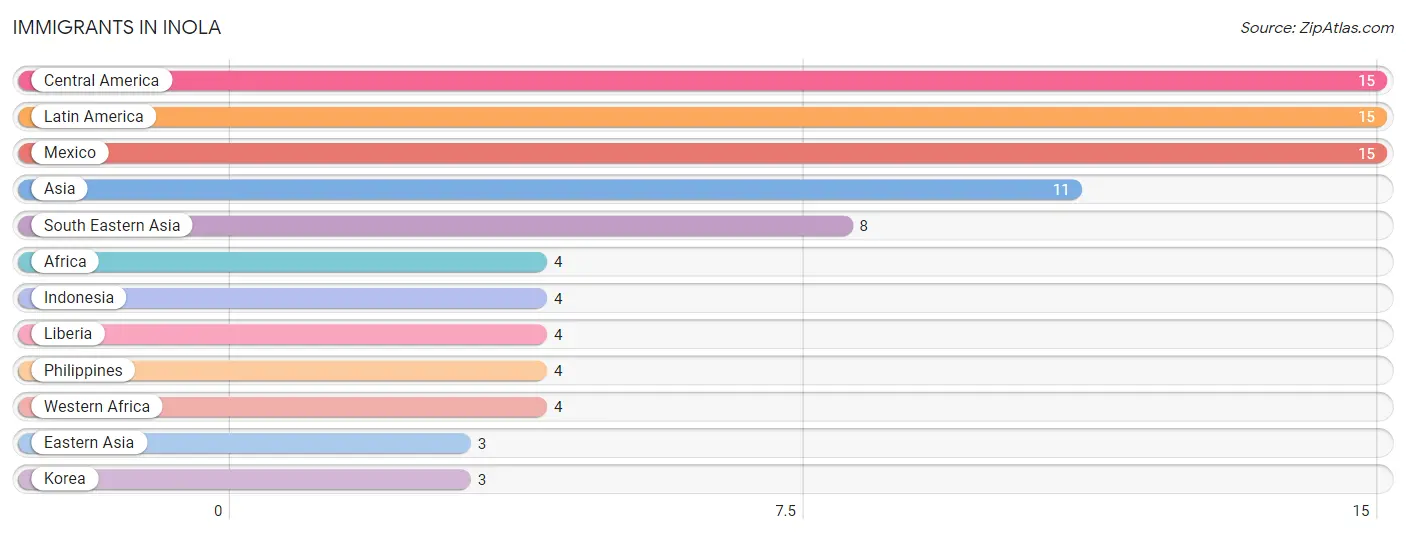
The most numerous immigrant groups reported in Inola came from Central America (15 | 0.8%), Latin America (15 | 0.8%), Mexico (15 | 0.8%), Asia (11 | 0.6%), and South Eastern Asia (8 | 0.4%), together accounting for 3.4% of all Inola residents.
| Immigration Origin | # Population | % Population |
| Africa | 4 | 0.2% |
| Asia | 11 | 0.6% |
| Central America | 15 | 0.8% |
| Eastern Asia | 3 | 0.2% |
| Indonesia | 4 | 0.2% |
| Korea | 3 | 0.2% |
| Latin America | 15 | 0.8% |
| Liberia | 4 | 0.2% |
| Mexico | 15 | 0.8% |
| Philippines | 4 | 0.2% |
| South Eastern Asia | 8 | 0.4% |
| Western Africa | 4 | 0.2% | View All 12 Rows |
Sex and Age in Inola
Sex and Age in Inola
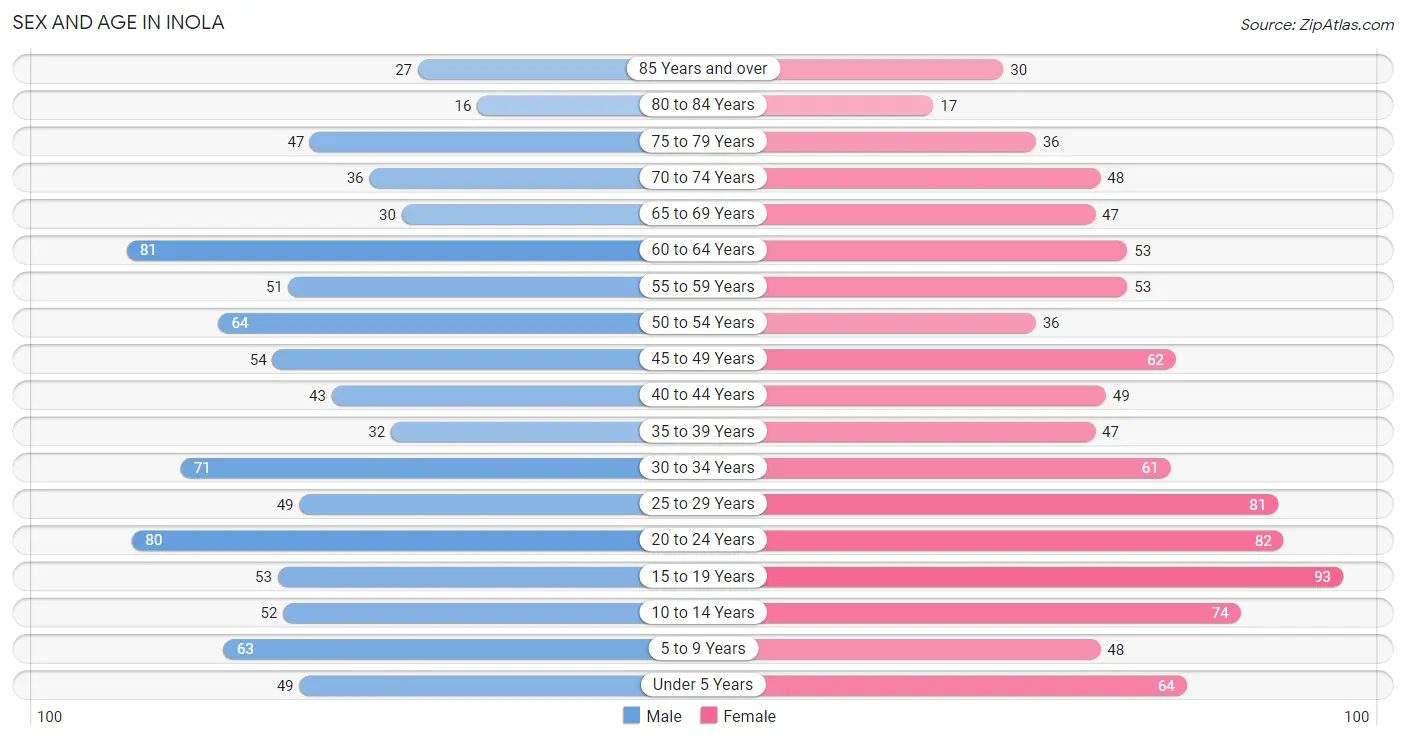
The most populous age groups in Inola are 60 to 64 Years (81 | 9.0%) for men and 15 to 19 Years (93 | 9.5%) for women.
| Age Bracket | Male | Female |
| Under 5 Years | 49 (5.5%) | 64 (6.5%) |
| 5 to 9 Years | 63 (7.0%) | 48 (4.9%) |
| 10 to 14 Years | 52 (5.8%) | 74 (7.5%) |
| 15 to 19 Years | 53 (5.9%) | 93 (9.5%) |
| 20 to 24 Years | 80 (8.9%) | 82 (8.4%) |
| 25 to 29 Years | 49 (5.5%) | 81 (8.3%) |
| 30 to 34 Years | 71 (7.9%) | 61 (6.2%) |
| 35 to 39 Years | 32 (3.6%) | 47 (4.8%) |
| 40 to 44 Years | 43 (4.8%) | 49 (5.0%) |
| 45 to 49 Years | 54 (6.0%) | 62 (6.3%) |
| 50 to 54 Years | 64 (7.1%) | 36 (3.7%) |
| 55 to 59 Years | 51 (5.7%) | 53 (5.4%) |
| 60 to 64 Years | 81 (9.0%) | 53 (5.4%) |
| 65 to 69 Years | 30 (3.3%) | 47 (4.8%) |
| 70 to 74 Years | 36 (4.0%) | 48 (4.9%) |
| 75 to 79 Years | 47 (5.2%) | 36 (3.7%) |
| 80 to 84 Years | 16 (1.8%) | 17 (1.7%) |
| 85 Years and over | 27 (3.0%) | 30 (3.1%) |
| Total | 898 (100.0%) | 981 (100.0%) |
Families and Households in Inola
Median Family Size in Inola
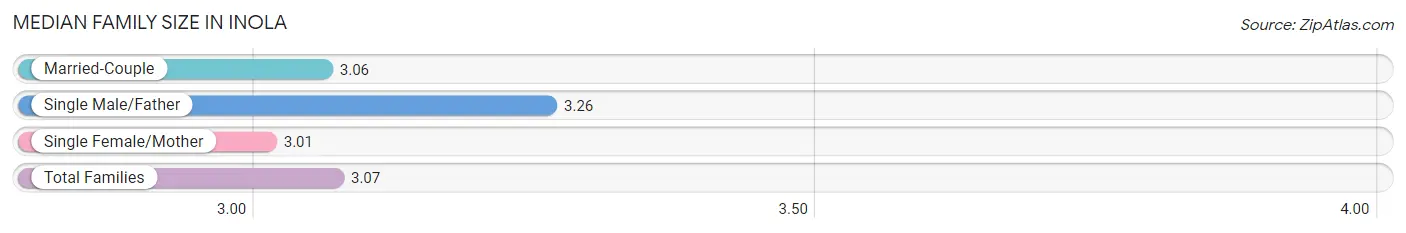
The median family size in Inola is 3.07 persons per family, with single male/father families (34 | 6.7%) accounting for the largest median family size of 3.26 persons per family. On the other hand, single female/mother families (93 | 18.4%) represent the smallest median family size with 3.01 persons per family.
| Family Type | # Families | Family Size |
| Married-Couple | 379 (74.9%) | 3.06 |
| Single Male/Father | 34 (6.7%) | 3.26 |
| Single Female/Mother | 93 (18.4%) | 3.01 |
| Total Families | 506 (100.0%) | 3.07 |
Median Household Size in Inola
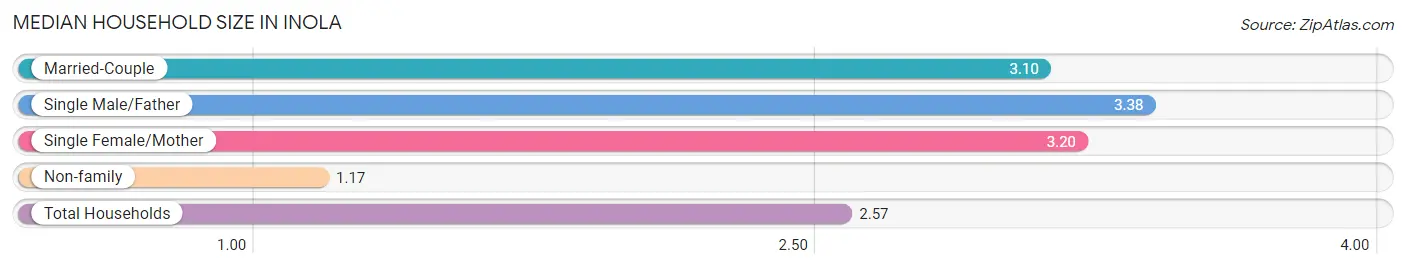
The median household size in Inola is 2.57 persons per household, with single male/father households (34 | 4.8%) accounting for the largest median household size of 3.38 persons per household. non-family households (202 | 28.5%) represent the smallest median household size with 1.17 persons per household.
| Household Type | # Households | Household Size |
| Married-Couple | 379 (53.5%) | 3.10 |
| Single Male/Father | 34 (4.8%) | 3.38 |
| Single Female/Mother | 93 (13.1%) | 3.20 |
| Non-family | 202 (28.5%) | 1.17 |
| Total Households | 708 (100.0%) | 2.57 |
Household Size by Marriage Status in Inola
Out of a total of 708 households in Inola, 506 (71.5%) are family households, while 202 (28.5%) are nonfamily households. The most numerous type of family households are 2-person households, comprising 230, and the most common type of nonfamily households are 1-person households, comprising 176.
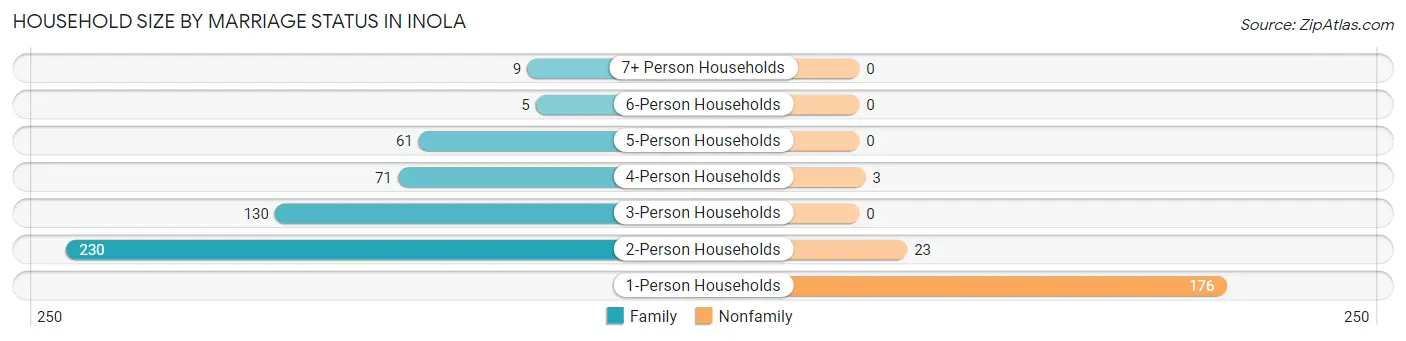
| Household Size | Family Households | Nonfamily Households |
| 1-Person Households | - | 176 (24.9%) |
| 2-Person Households | 230 (32.5%) | 23 (3.3%) |
| 3-Person Households | 130 (18.4%) | 0 (0.0%) |
| 4-Person Households | 71 (10.0%) | 3 (0.4%) |
| 5-Person Households | 61 (8.6%) | 0 (0.0%) |
| 6-Person Households | 5 (0.7%) | 0 (0.0%) |
| 7+ Person Households | 9 (1.3%) | 0 (0.0%) |
| Total | 506 (71.5%) | 202 (28.5%) |
Female Fertility in Inola
Fertility by Age in Inola
Average fertility rate in Inola is 36.0 births per 1,000 women. Women in the age bracket of 20 to 34 years have the highest fertility rate with 71.0 births per 1,000 women. Women in the age bracket of 20 to 34 years acount for 88.9% of all women with births.
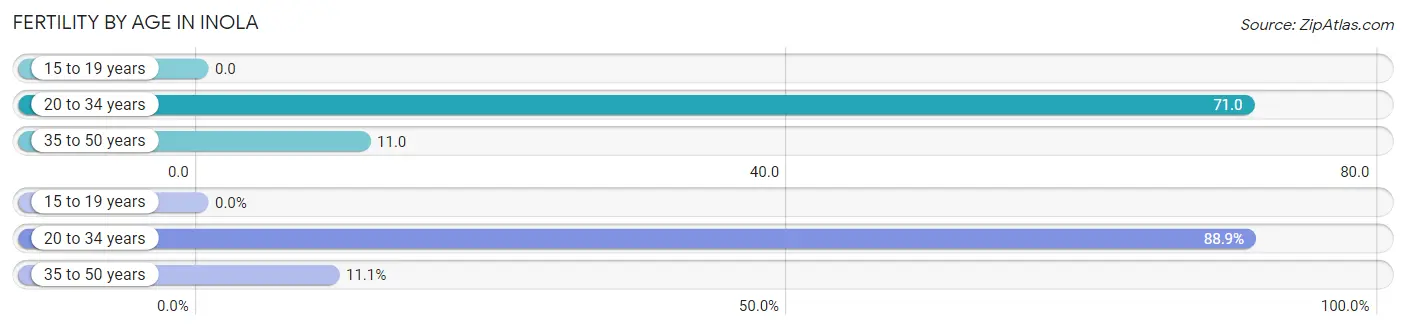
| Age Bracket | Women with Births | Births / 1,000 Women |
| 15 to 19 years | 0 (0.0%) | 0.0 |
| 20 to 34 years | 16 (88.9%) | 71.0 |
| 35 to 50 years | 2 (11.1%) | 11.0 |
| Total | 18 (100.0%) | 36.0 |
Fertility by Age by Marriage Status in Inola
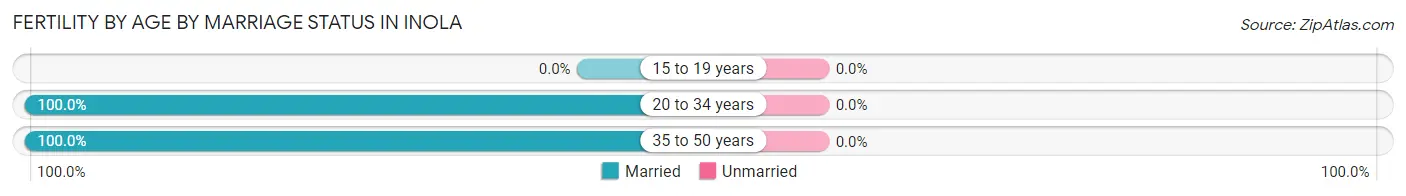
| Age Bracket | Married | Unmarried |
| 15 to 19 years | 0 (0.0%) | 0 (0.0%) |
| 20 to 34 years | 16 (100.0%) | 0 (0.0%) |
| 35 to 50 years | 2 (100.0%) | 0 (0.0%) |
| Total | 18 (100.0%) | 0 (0.0%) |
Fertility by Education in Inola
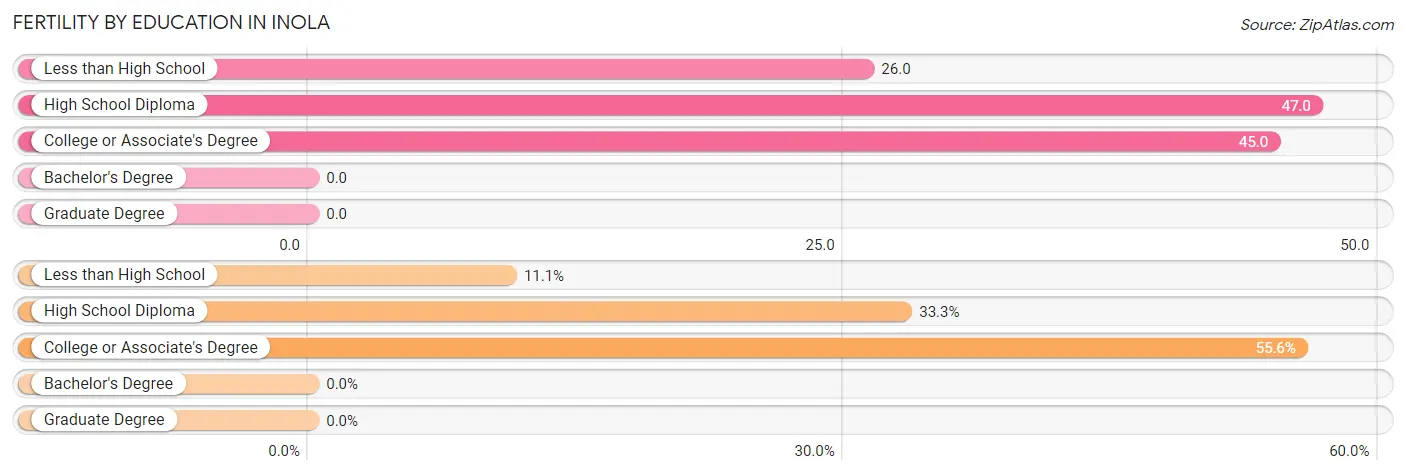
| Educational Attainment | Women with Births | Births / 1,000 Women |
| Less than High School | 2 (11.1%) | 26.0 |
| High School Diploma | 6 (33.3%) | 47.0 |
| College or Associate's Degree | 10 (55.6%) | 45.0 |
| Bachelor's Degree | 0 (0.0%) | 0.0 |
| Graduate Degree | 0 (0.0%) | 0.0 |
| Total | 18 (100.0%) | 36.0 |
Fertility by Education by Marriage Status in Inola
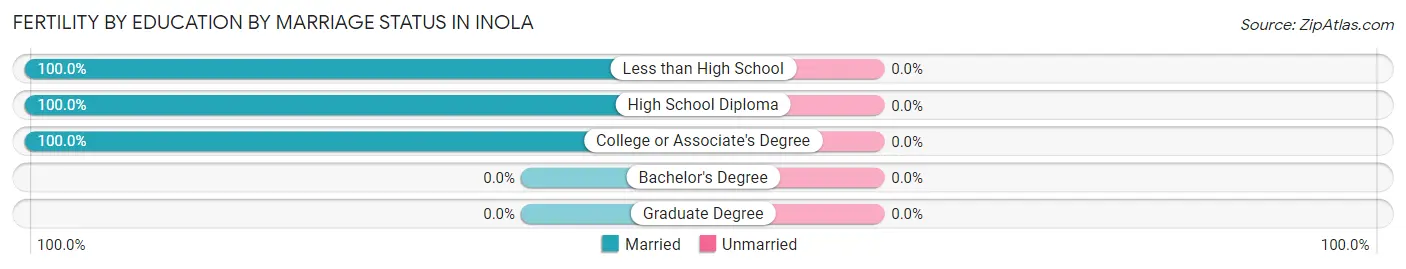
| Educational Attainment | Married | Unmarried |
| Less than High School | 2 (100.0%) | 0 (0.0%) |
| High School Diploma | 6 (100.0%) | 0 (0.0%) |
| College or Associate's Degree | 10 (100.0%) | 0 (0.0%) |
| Bachelor's Degree | 0 (0.0%) | 0 (0.0%) |
| Graduate Degree | 0 (0.0%) | 0 (0.0%) |
| Total | 18 (100.0%) | 0 (0.0%) |
Employment Characteristics in Inola
Employment by Class of Employer in Inola
Among the 840 employed individuals in Inola, private company employees (583 | 69.4%), self-employed (not incorporated) (77 | 9.2%), and not-for-profit organizations (49 | 5.8%) make up the most common classes of employment.
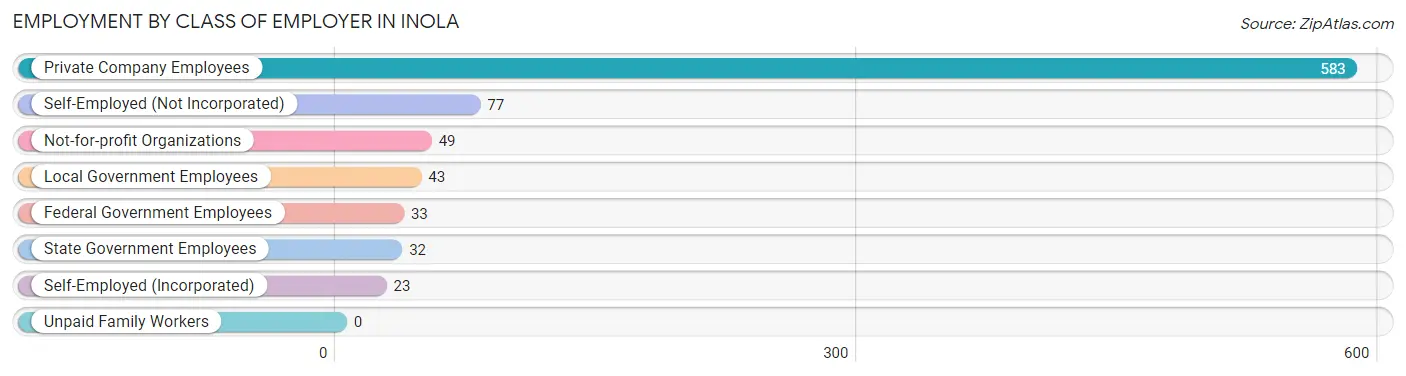
| Employer Class | # Employees | % Employees |
| Private Company Employees | 583 | 69.4% |
| Self-Employed (Incorporated) | 23 | 2.7% |
| Self-Employed (Not Incorporated) | 77 | 9.2% |
| Not-for-profit Organizations | 49 | 5.8% |
| Local Government Employees | 43 | 5.1% |
| State Government Employees | 32 | 3.8% |
| Federal Government Employees | 33 | 3.9% |
| Unpaid Family Workers | 0 | 0.0% |
| Total | 840 | 100.0% |
Employment Status by Age in Inola
According to the labor force statistics for Inola, out of the total population over 16 years of age (1,512), 61.6% or 931 individuals are in the labor force, with 9.1% or 85 of them unemployed. The age group with the highest labor force participation rate is 25 to 29 years, with 88.5% or 115 individuals in the labor force. Within the labor force, the 20 to 24 years age range has the highest percentage of unemployed individuals, with 28.7% or 41 of them being unemployed.
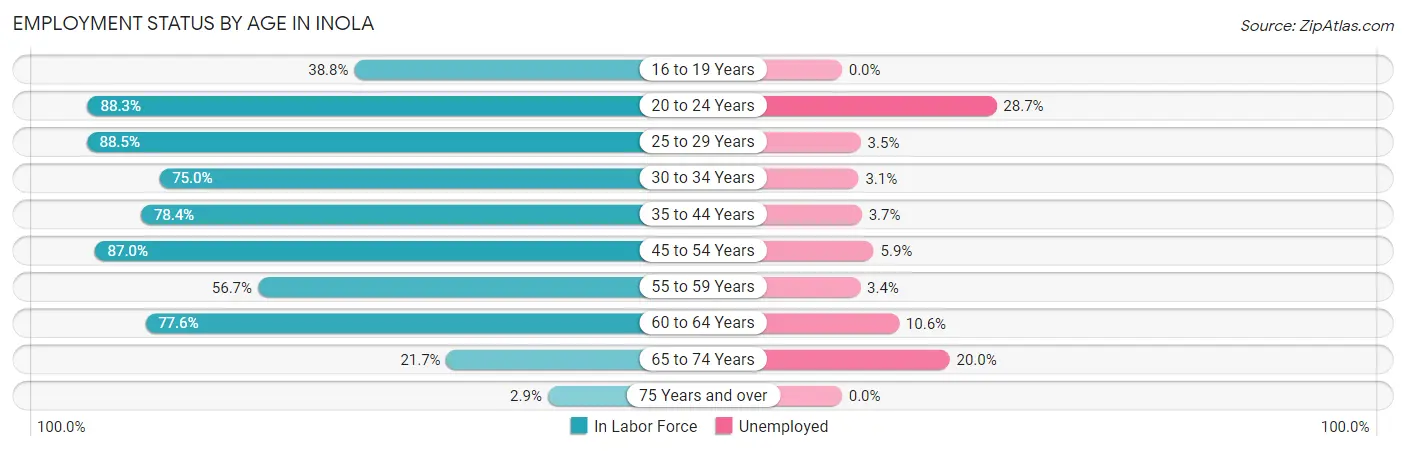
| Age Bracket | In Labor Force | Unemployed |
| 16 to 19 Years | 50 (38.8%) | 0 (0.0%) |
| 20 to 24 Years | 143 (88.3%) | 41 (28.7%) |
| 25 to 29 Years | 115 (88.5%) | 4 (3.5%) |
| 30 to 34 Years | 99 (75.0%) | 3 (3.1%) |
| 35 to 44 Years | 134 (78.4%) | 5 (3.7%) |
| 45 to 54 Years | 188 (87.0%) | 11 (5.9%) |
| 55 to 59 Years | 59 (56.7%) | 2 (3.4%) |
| 60 to 64 Years | 104 (77.6%) | 11 (10.6%) |
| 65 to 74 Years | 35 (21.7%) | 7 (20.0%) |
| 75 Years and over | 5 (2.9%) | 0 (0.0%) |
| Total | 931 (61.6%) | 85 (9.1%) |
Employment Status by Educational Attainment in Inola
According to labor force statistics for Inola, 78.8% of individuals (699) out of the total population between 25 and 64 years of age (887) are in the labor force, with 5.2% or 36 of them being unemployed. The group with the highest labor force participation rate are those with the educational attainment of bachelor's degree or higher, with 92.7% or 140 individuals in the labor force. Within the labor force, individuals with less than high school education have the highest percentage of unemployment, with 36.8% or 14 of them being unemployed.
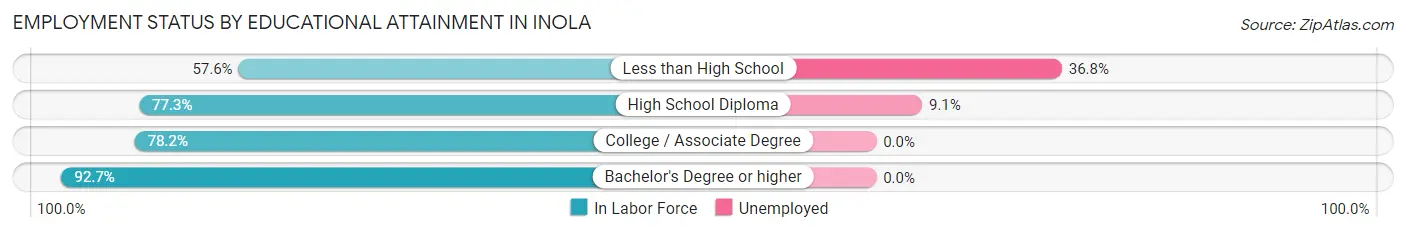
| Educational Attainment | In Labor Force | Unemployed |
| Less than High School | 38 (57.6%) | 24 (36.8%) |
| High School Diploma | 242 (77.3%) | 28 (9.1%) |
| College / Associate Degree | 279 (78.2%) | 0 (0.0%) |
| Bachelor's Degree or higher | 140 (92.7%) | 0 (0.0%) |
| Total | 699 (78.8%) | 46 (5.2%) |
Employment Occupations by Sex in Inola
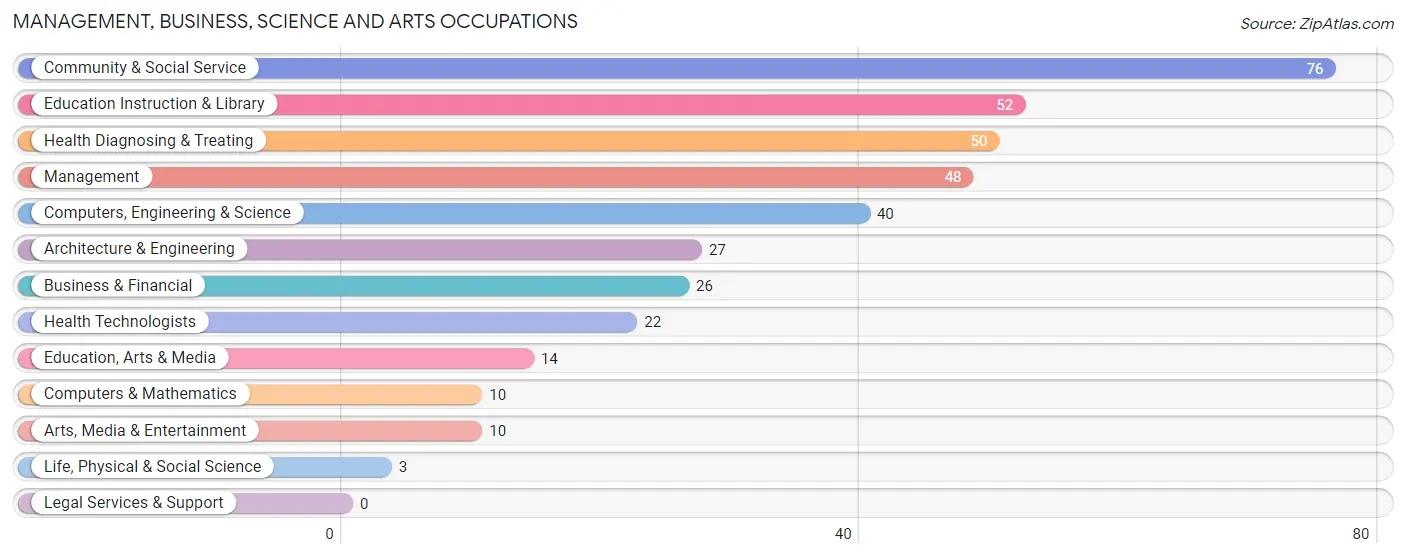
Management, Business, Science and Arts Occupations
The most common Management, Business, Science and Arts occupations in Inola are Community & Social Service (76 | 9.0%), Education Instruction & Library (52 | 6.2%), Health Diagnosing & Treating (50 | 5.9%), Management (48 | 5.7%), and Computers, Engineering & Science (40 | 4.8%).
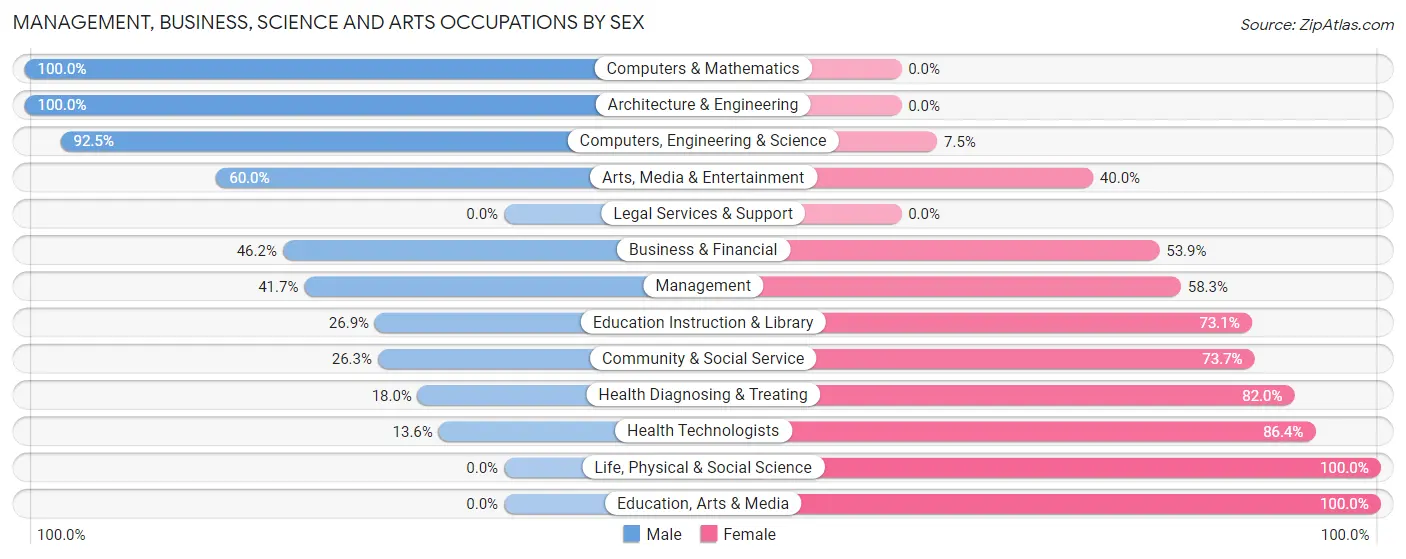
Management, Business, Science and Arts Occupations by Sex
Within the Management, Business, Science and Arts occupations in Inola, the most male-oriented occupations are Computers & Mathematics (100.0%), Architecture & Engineering (100.0%), and Computers, Engineering & Science (92.5%), while the most female-oriented occupations are Life, Physical & Social Science (100.0%), Education, Arts & Media (100.0%), and Health Technologists (86.4%).
| Occupation | Male | Female |
| Management | 20 (41.7%) | 28 (58.3%) |
| Business & Financial | 12 (46.2%) | 14 (53.8%) |
| Computers, Engineering & Science | 37 (92.5%) | 3 (7.5%) |
| Computers & Mathematics | 10 (100.0%) | 0 (0.0%) |
| Architecture & Engineering | 27 (100.0%) | 0 (0.0%) |
| Life, Physical & Social Science | 0 (0.0%) | 3 (100.0%) |
| Community & Social Service | 20 (26.3%) | 56 (73.7%) |
| Education, Arts & Media | 0 (0.0%) | 14 (100.0%) |
| Legal Services & Support | 0 (0.0%) | 0 (0.0%) |
| Education Instruction & Library | 14 (26.9%) | 38 (73.1%) |
| Arts, Media & Entertainment | 6 (60.0%) | 4 (40.0%) |
| Health Diagnosing & Treating | 9 (18.0%) | 41 (82.0%) |
| Health Technologists | 3 (13.6%) | 19 (86.4%) |
| Total (Category) | 98 (40.8%) | 142 (59.2%) |
| Total (Overall) | 455 (54.0%) | 387 (46.0%) |
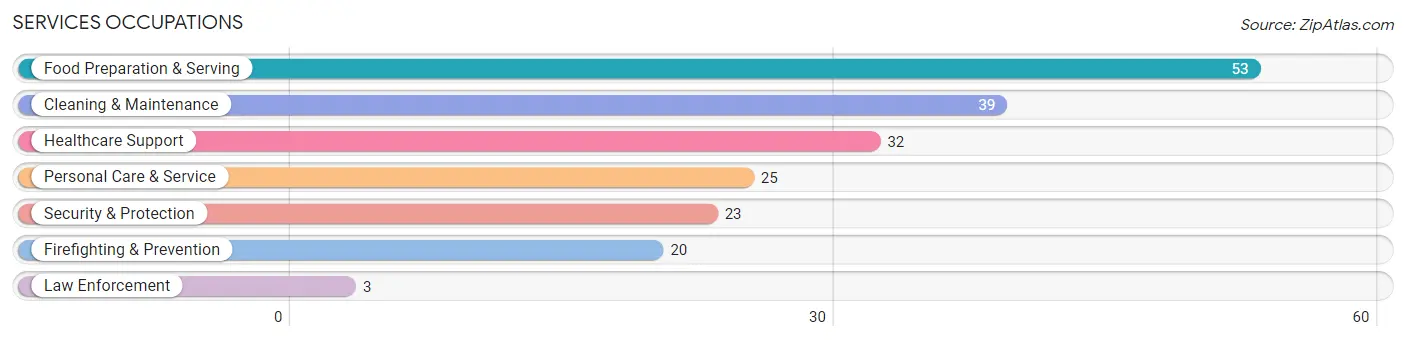
Services Occupations
The most common Services occupations in Inola are Food Preparation & Serving (53 | 6.3%), Cleaning & Maintenance (39 | 4.6%), Healthcare Support (32 | 3.8%), Personal Care & Service (25 | 3.0%), and Security & Protection (23 | 2.7%).
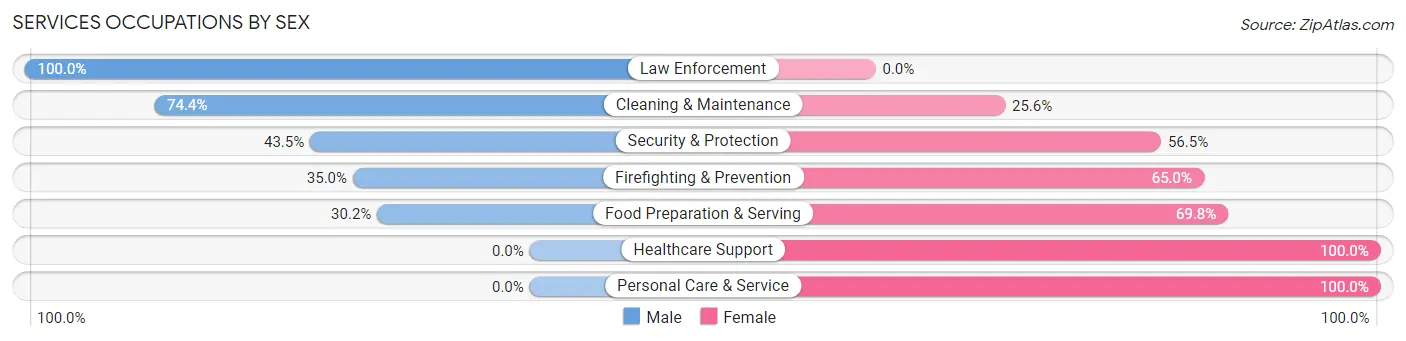
Services Occupations by Sex
Within the Services occupations in Inola, the most male-oriented occupations are Law Enforcement (100.0%), Cleaning & Maintenance (74.4%), and Security & Protection (43.5%), while the most female-oriented occupations are Healthcare Support (100.0%), Personal Care & Service (100.0%), and Food Preparation & Serving (69.8%).
| Occupation | Male | Female |
| Healthcare Support | 0 (0.0%) | 32 (100.0%) |
| Security & Protection | 10 (43.5%) | 13 (56.5%) |
| Firefighting & Prevention | 7 (35.0%) | 13 (65.0%) |
| Law Enforcement | 3 (100.0%) | 0 (0.0%) |
| Food Preparation & Serving | 16 (30.2%) | 37 (69.8%) |
| Cleaning & Maintenance | 29 (74.4%) | 10 (25.6%) |
| Personal Care & Service | 0 (0.0%) | 25 (100.0%) |
| Total (Category) | 55 (32.0%) | 117 (68.0%) |
| Total (Overall) | 455 (54.0%) | 387 (46.0%) |
Sales and Office Occupations
The most common Sales and Office occupations in Inola are Office & Administration (92 | 10.9%), and Sales & Related (54 | 6.4%).
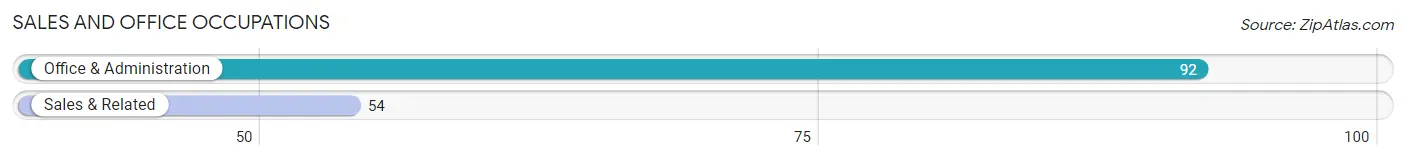
Sales and Office Occupations by Sex
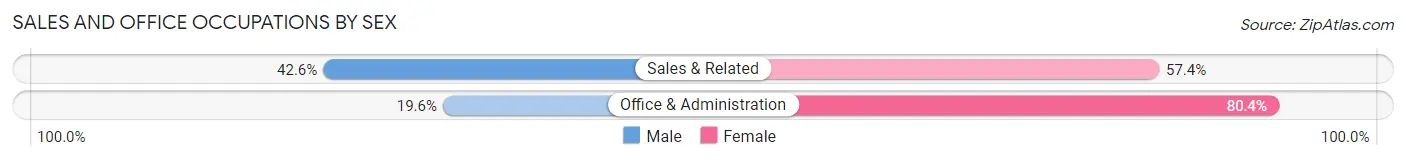
| Occupation | Male | Female |
| Sales & Related | 23 (42.6%) | 31 (57.4%) |
| Office & Administration | 18 (19.6%) | 74 (80.4%) |
| Total (Category) | 41 (28.1%) | 105 (71.9%) |
| Total (Overall) | 455 (54.0%) | 387 (46.0%) |
Natural Resources, Construction and Maintenance Occupations
The most common Natural Resources, Construction and Maintenance occupations in Inola are Installation, Maintenance & Repair (61 | 7.2%), Construction & Extraction (60 | 7.1%), and Farming, Fishing & Forestry (3 | 0.4%).
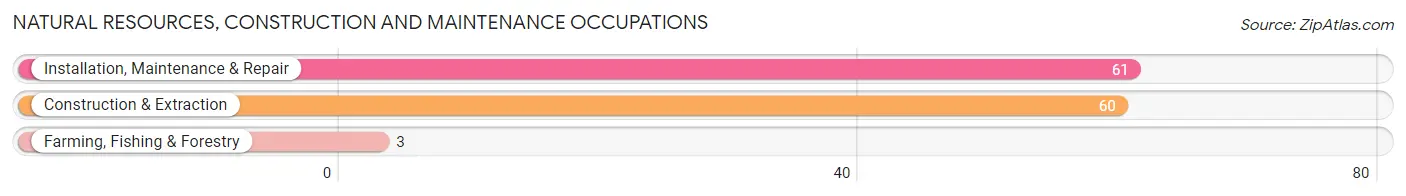
Natural Resources, Construction and Maintenance Occupations by Sex
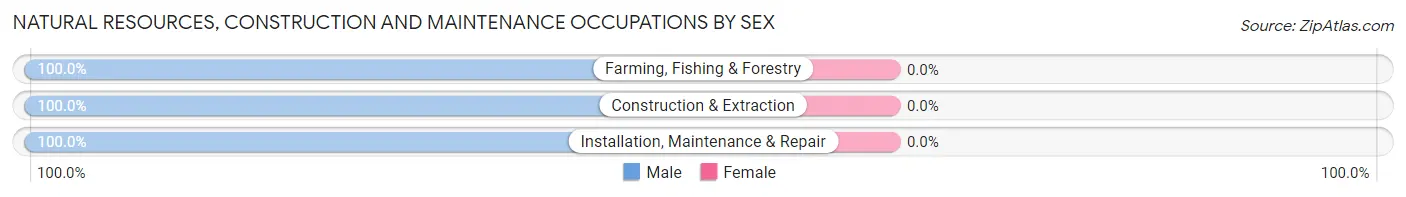
| Occupation | Male | Female |
| Farming, Fishing & Forestry | 3 (100.0%) | 0 (0.0%) |
| Construction & Extraction | 60 (100.0%) | 0 (0.0%) |
| Installation, Maintenance & Repair | 61 (100.0%) | 0 (0.0%) |
| Total (Category) | 124 (100.0%) | 0 (0.0%) |
| Total (Overall) | 455 (54.0%) | 387 (46.0%) |
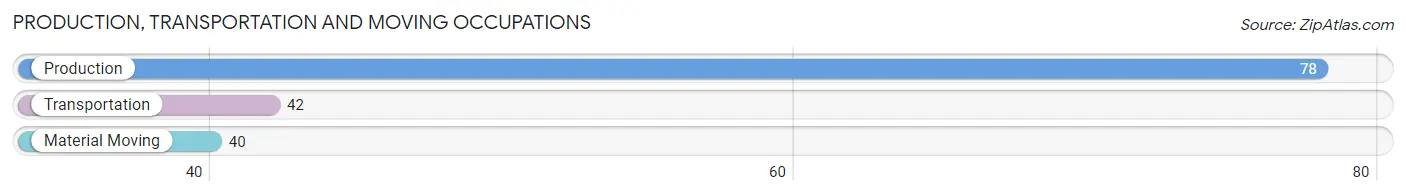
Production, Transportation and Moving Occupations
The most common Production, Transportation and Moving occupations in Inola are Production (78 | 9.3%), Transportation (42 | 5.0%), and Material Moving (40 | 4.8%).
Production, Transportation and Moving Occupations by Sex
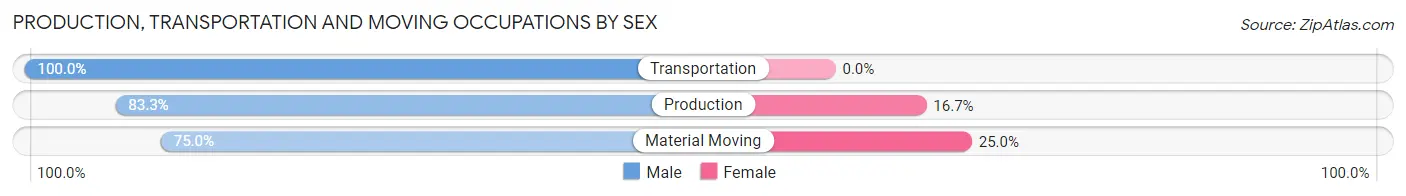
| Occupation | Male | Female |
| Production | 65 (83.3%) | 13 (16.7%) |
| Transportation | 42 (100.0%) | 0 (0.0%) |
| Material Moving | 30 (75.0%) | 10 (25.0%) |
| Total (Category) | 137 (85.6%) | 23 (14.4%) |
| Total (Overall) | 455 (54.0%) | 387 (46.0%) |
Employment Industries by Sex in Inola
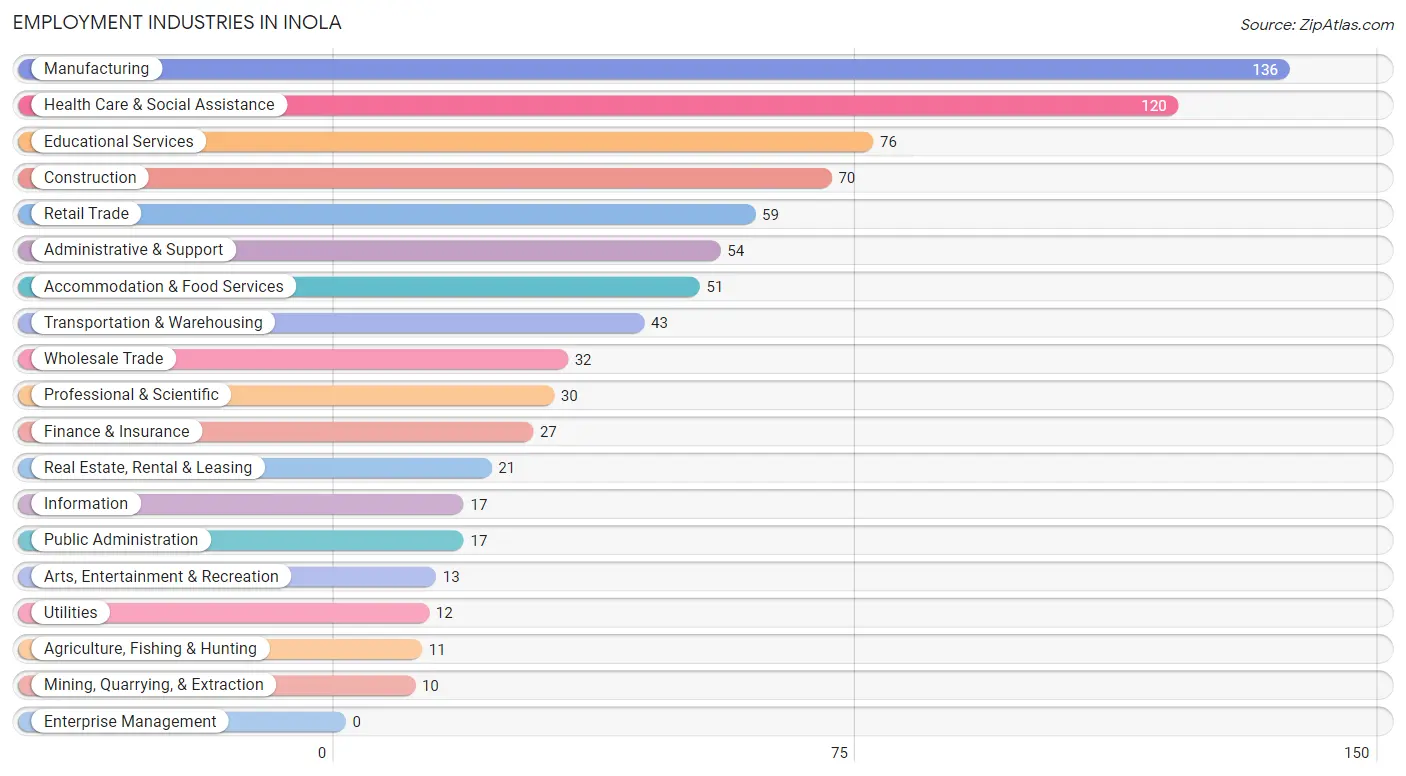
Employment Industries in Inola
The major employment industries in Inola include Manufacturing (136 | 16.2%), Health Care & Social Assistance (120 | 14.2%), Educational Services (76 | 9.0%), Construction (70 | 8.3%), and Retail Trade (59 | 7.0%).
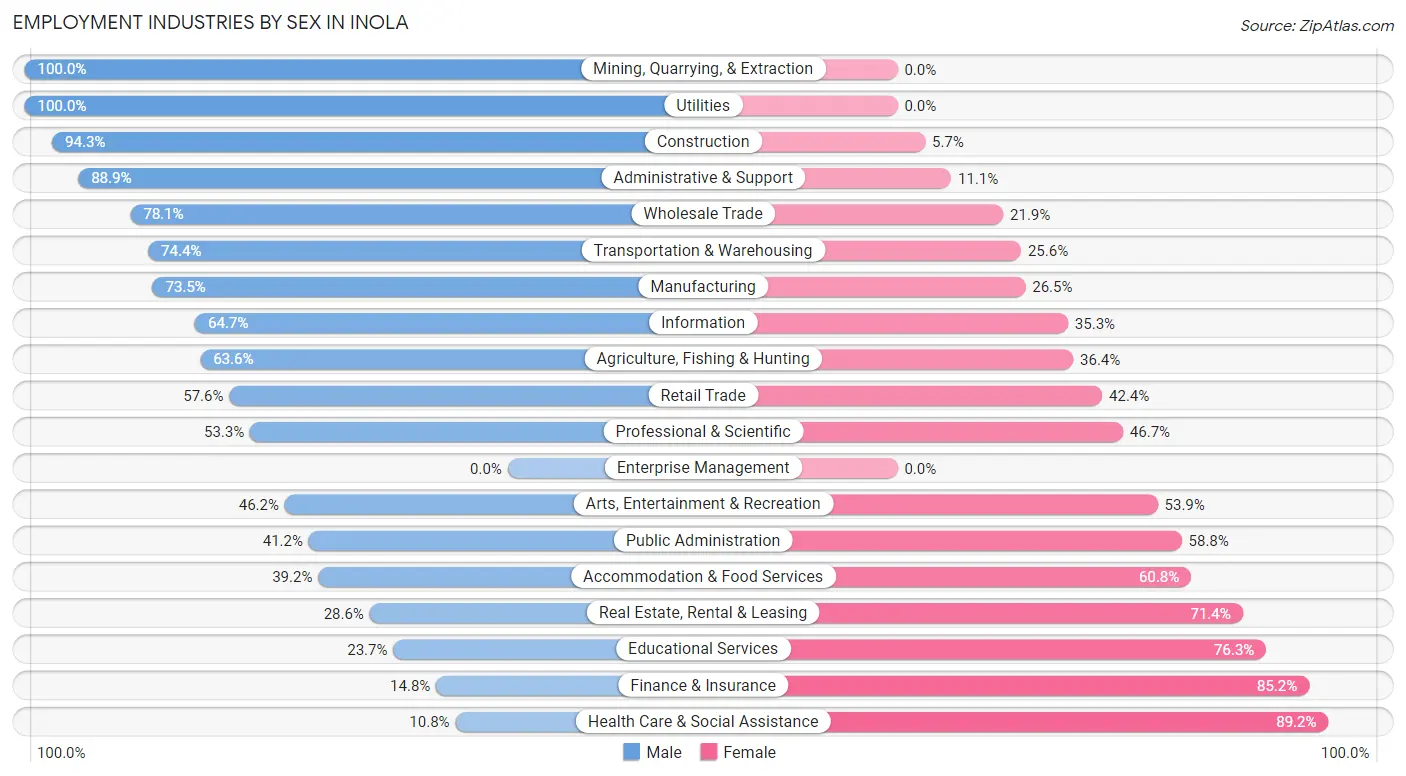
Employment Industries by Sex in Inola
The Inola industries that see more men than women are Mining, Quarrying, & Extraction (100.0%), Utilities (100.0%), and Construction (94.3%), whereas the industries that tend to have a higher number of women are Health Care & Social Assistance (89.2%), Finance & Insurance (85.2%), and Educational Services (76.3%).
| Industry | Male | Female |
| Agriculture, Fishing & Hunting | 7 (63.6%) | 4 (36.4%) |
| Mining, Quarrying, & Extraction | 10 (100.0%) | 0 (0.0%) |
| Construction | 66 (94.3%) | 4 (5.7%) |
| Manufacturing | 100 (73.5%) | 36 (26.5%) |
| Wholesale Trade | 25 (78.1%) | 7 (21.9%) |
| Retail Trade | 34 (57.6%) | 25 (42.4%) |
| Transportation & Warehousing | 32 (74.4%) | 11 (25.6%) |
| Utilities | 12 (100.0%) | 0 (0.0%) |
| Information | 11 (64.7%) | 6 (35.3%) |
| Finance & Insurance | 4 (14.8%) | 23 (85.2%) |
| Real Estate, Rental & Leasing | 6 (28.6%) | 15 (71.4%) |
| Professional & Scientific | 16 (53.3%) | 14 (46.7%) |
| Enterprise Management | 0 (0.0%) | 0 (0.0%) |
| Administrative & Support | 48 (88.9%) | 6 (11.1%) |
| Educational Services | 18 (23.7%) | 58 (76.3%) |
| Health Care & Social Assistance | 13 (10.8%) | 107 (89.2%) |
| Arts, Entertainment & Recreation | 6 (46.2%) | 7 (53.8%) |
| Accommodation & Food Services | 20 (39.2%) | 31 (60.8%) |
| Public Administration | 7 (41.2%) | 10 (58.8%) |
| Total | 455 (54.0%) | 387 (46.0%) |
Education in Inola
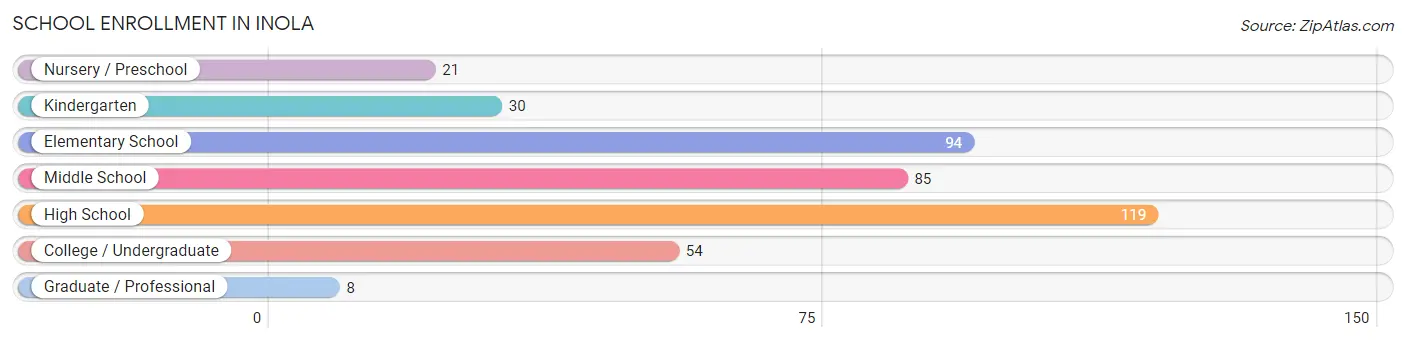
School Enrollment in Inola
The most common levels of schooling among the 411 students in Inola are high school (119 | 28.9%), elementary school (94 | 22.9%), and middle school (85 | 20.7%).
| School Level | # Students | % Students |
| Nursery / Preschool | 21 | 5.1% |
| Kindergarten | 30 | 7.3% |
| Elementary School | 94 | 22.9% |
| Middle School | 85 | 20.7% |
| High School | 119 | 28.9% |
| College / Undergraduate | 54 | 13.1% |
| Graduate / Professional | 8 | 1.9% |
| Total | 411 | 100.0% |
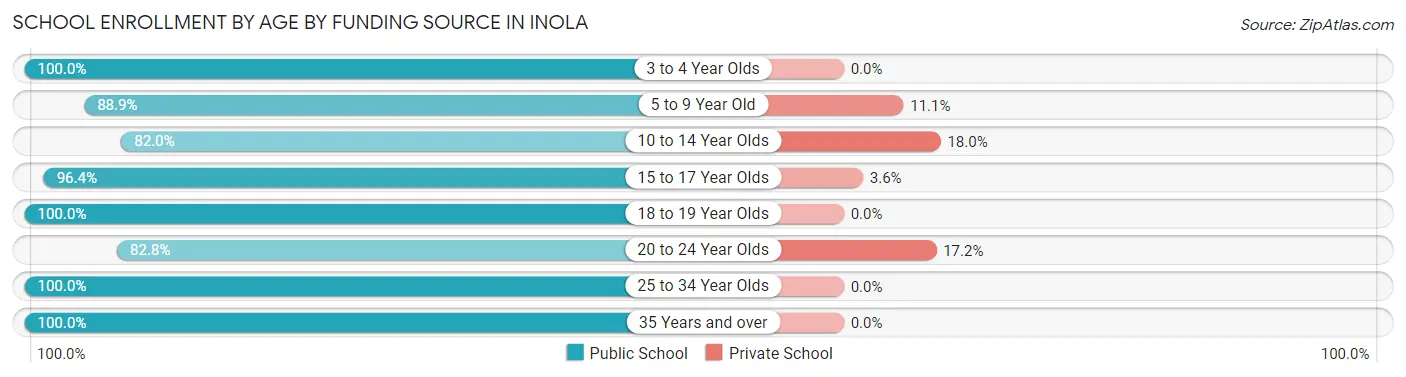
School Enrollment by Age by Funding Source in Inola
Out of a total of 411 students who are enrolled in schools in Inola, 42 (10.2%) attend a private institution, while the remaining 369 (89.8%) are enrolled in public schools. The age group of 10 to 14 year olds has the highest likelihood of being enrolled in private schools, with 22 (18.0% in the age bracket) enrolled. Conversely, the age group of 3 to 4 year olds has the lowest likelihood of being enrolled in a private school, with 13 (100.0% in the age bracket) attending a public institution.
| Age Bracket | Public School | Private School |
| 3 to 4 Year Olds | 13 (100.0%) | 0 (0.0%) |
| 5 to 9 Year Old | 96 (88.9%) | 12 (11.1%) |
| 10 to 14 Year Olds | 100 (82.0%) | 22 (18.0%) |
| 15 to 17 Year Olds | 81 (96.4%) | 3 (3.6%) |
| 18 to 19 Year Olds | 31 (100.0%) | 0 (0.0%) |
| 20 to 24 Year Olds | 24 (82.8%) | 5 (17.2%) |
| 25 to 34 Year Olds | 21 (100.0%) | 0 (0.0%) |
| 35 Years and over | 3 (100.0%) | 0 (0.0%) |
| Total | 369 (89.8%) | 42 (10.2%) |
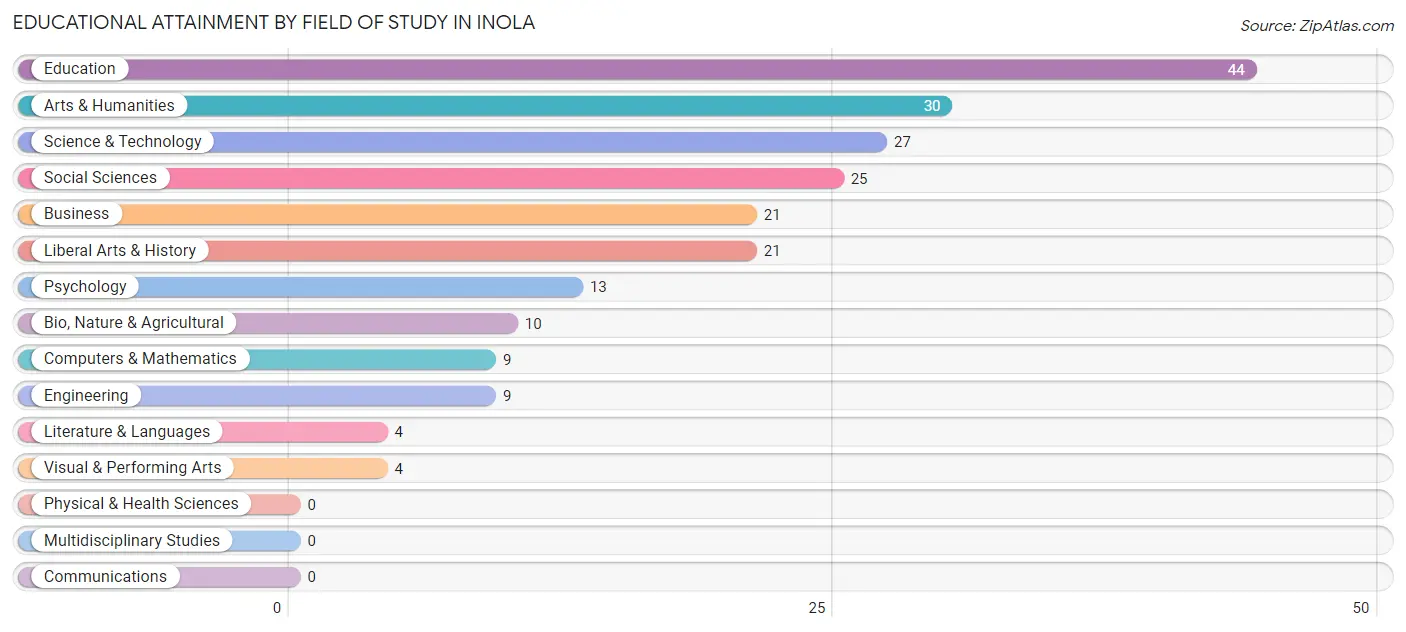
Educational Attainment by Field of Study in Inola
Education (44 | 20.3%), arts & humanities (30 | 13.8%), science & technology (27 | 12.4%), social sciences (25 | 11.5%), and business (21 | 9.7%) are the most common fields of study among 217 individuals in Inola who have obtained a bachelor's degree or higher.
| Field of Study | # Graduates | % Graduates |
| Computers & Mathematics | 9 | 4.2% |
| Bio, Nature & Agricultural | 10 | 4.6% |
| Physical & Health Sciences | 0 | 0.0% |
| Psychology | 13 | 6.0% |
| Social Sciences | 25 | 11.5% |
| Engineering | 9 | 4.2% |
| Multidisciplinary Studies | 0 | 0.0% |
| Science & Technology | 27 | 12.4% |
| Business | 21 | 9.7% |
| Education | 44 | 20.3% |
| Literature & Languages | 4 | 1.8% |
| Liberal Arts & History | 21 | 9.7% |
| Visual & Performing Arts | 4 | 1.8% |
| Communications | 0 | 0.0% |
| Arts & Humanities | 30 | 13.8% |
| Total | 217 | 100.0% |
Transportation & Commute in Inola
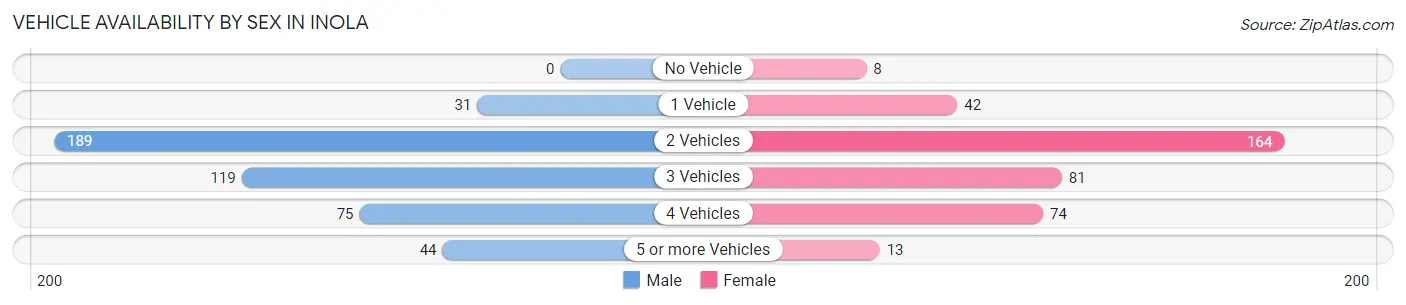
Vehicle Availability by Sex in Inola
The most prevalent vehicle ownership categories in Inola are males with 2 vehicles (189, accounting for 41.3%) and females with 2 vehicles (164, making up 49.5%).
| Vehicles Available | Male | Female |
| No Vehicle | 0 (0.0%) | 8 (2.1%) |
| 1 Vehicle | 31 (6.8%) | 42 (11.0%) |
| 2 Vehicles | 189 (41.3%) | 164 (42.9%) |
| 3 Vehicles | 119 (26.0%) | 81 (21.2%) |
| 4 Vehicles | 75 (16.4%) | 74 (19.4%) |
| 5 or more Vehicles | 44 (9.6%) | 13 (3.4%) |
| Total | 458 (100.0%) | 382 (100.0%) |
Commute Time in Inola
The most frequently occuring commute durations in Inola are 30 to 34 minutes (209 commuters, 26.4%), 25 to 29 minutes (83 commuters, 10.5%), and 45 to 59 minutes (76 commuters, 9.6%).
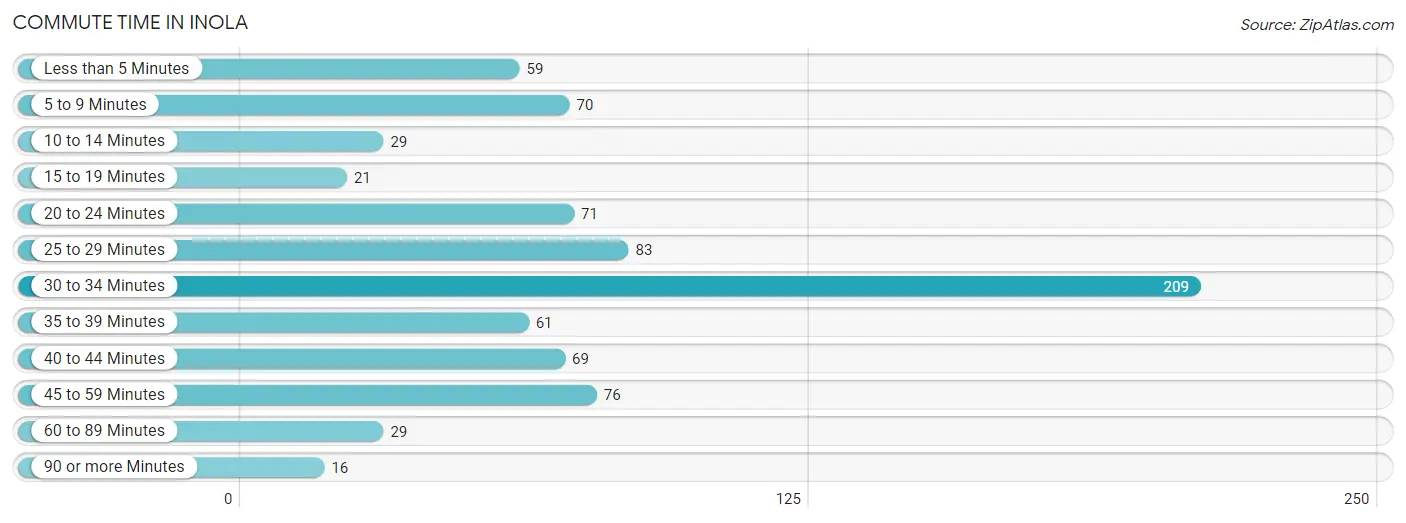
| Commute Time | # Commuters | % Commuters |
| Less than 5 Minutes | 59 | 7.4% |
| 5 to 9 Minutes | 70 | 8.8% |
| 10 to 14 Minutes | 29 | 3.7% |
| 15 to 19 Minutes | 21 | 2.6% |
| 20 to 24 Minutes | 71 | 8.9% |
| 25 to 29 Minutes | 83 | 10.5% |
| 30 to 34 Minutes | 209 | 26.4% |
| 35 to 39 Minutes | 61 | 7.7% |
| 40 to 44 Minutes | 69 | 8.7% |
| 45 to 59 Minutes | 76 | 9.6% |
| 60 to 89 Minutes | 29 | 3.7% |
| 90 or more Minutes | 16 | 2.0% |
Commute Time by Sex in Inola
The most common commute times in Inola are 30 to 34 minutes (136 commuters, 30.2%) for males and 30 to 34 minutes (73 commuters, 21.3%) for females.
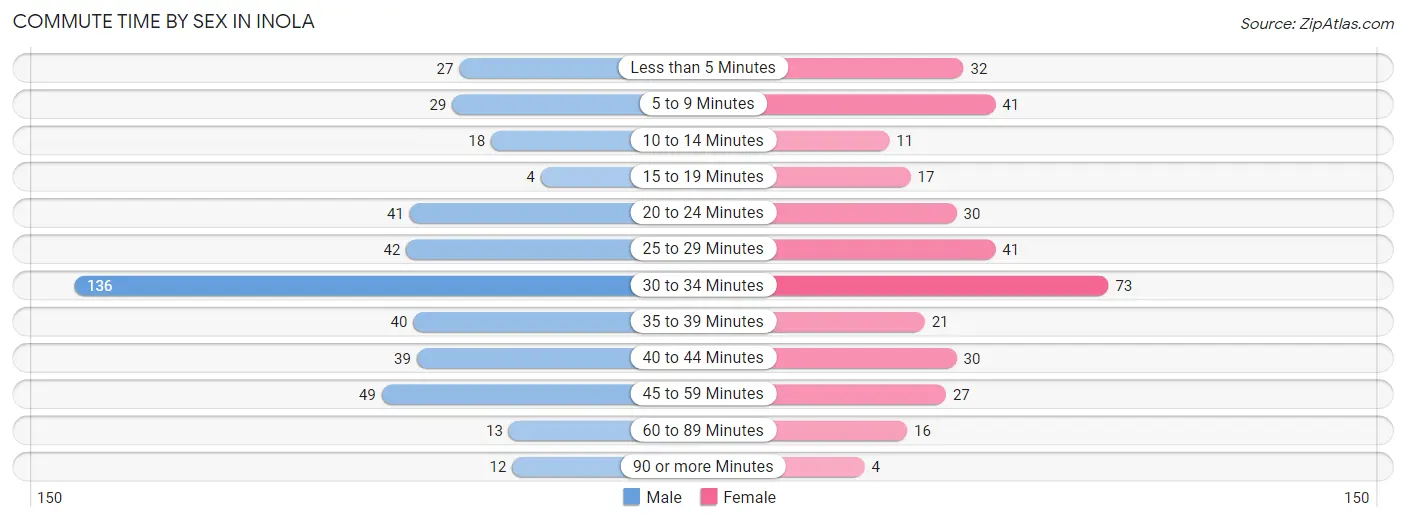
| Commute Time | Male | Female |
| Less than 5 Minutes | 27 (6.0%) | 32 (9.3%) |
| 5 to 9 Minutes | 29 (6.4%) | 41 (11.9%) |
| 10 to 14 Minutes | 18 (4.0%) | 11 (3.2%) |
| 15 to 19 Minutes | 4 (0.9%) | 17 (5.0%) |
| 20 to 24 Minutes | 41 (9.1%) | 30 (8.7%) |
| 25 to 29 Minutes | 42 (9.3%) | 41 (11.9%) |
| 30 to 34 Minutes | 136 (30.2%) | 73 (21.3%) |
| 35 to 39 Minutes | 40 (8.9%) | 21 (6.1%) |
| 40 to 44 Minutes | 39 (8.7%) | 30 (8.7%) |
| 45 to 59 Minutes | 49 (10.9%) | 27 (7.9%) |
| 60 to 89 Minutes | 13 (2.9%) | 16 (4.7%) |
| 90 or more Minutes | 12 (2.7%) | 4 (1.2%) |
Time of Departure to Work by Sex in Inola
The most frequent times of departure to work in Inola are 7:00 AM to 7:29 AM (75, 16.7%) for males and 7:00 AM to 7:29 AM (92, 26.8%) for females.
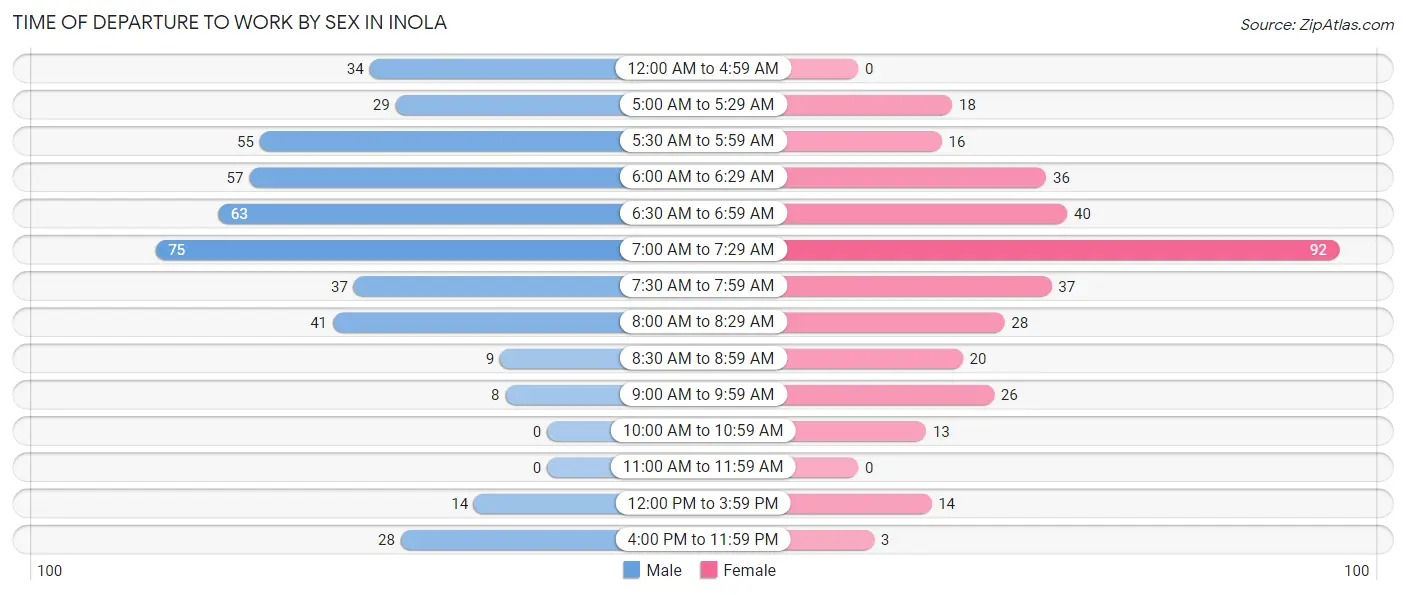
| Time of Departure | Male | Female |
| 12:00 AM to 4:59 AM | 34 (7.6%) | 0 (0.0%) |
| 5:00 AM to 5:29 AM | 29 (6.4%) | 18 (5.2%) |
| 5:30 AM to 5:59 AM | 55 (12.2%) | 16 (4.7%) |
| 6:00 AM to 6:29 AM | 57 (12.7%) | 36 (10.5%) |
| 6:30 AM to 6:59 AM | 63 (14.0%) | 40 (11.7%) |
| 7:00 AM to 7:29 AM | 75 (16.7%) | 92 (26.8%) |
| 7:30 AM to 7:59 AM | 37 (8.2%) | 37 (10.8%) |
| 8:00 AM to 8:29 AM | 41 (9.1%) | 28 (8.2%) |
| 8:30 AM to 8:59 AM | 9 (2.0%) | 20 (5.8%) |
| 9:00 AM to 9:59 AM | 8 (1.8%) | 26 (7.6%) |
| 10:00 AM to 10:59 AM | 0 (0.0%) | 13 (3.8%) |
| 11:00 AM to 11:59 AM | 0 (0.0%) | 0 (0.0%) |
| 12:00 PM to 3:59 PM | 14 (3.1%) | 14 (4.1%) |
| 4:00 PM to 11:59 PM | 28 (6.2%) | 3 (0.9%) |
| Total | 450 (100.0%) | 343 (100.0%) |
Housing Occupancy in Inola
Occupancy by Ownership in Inola
Of the total 708 dwellings in Inola, owner-occupied units account for 507 (71.6%), while renter-occupied units make up 201 (28.4%).
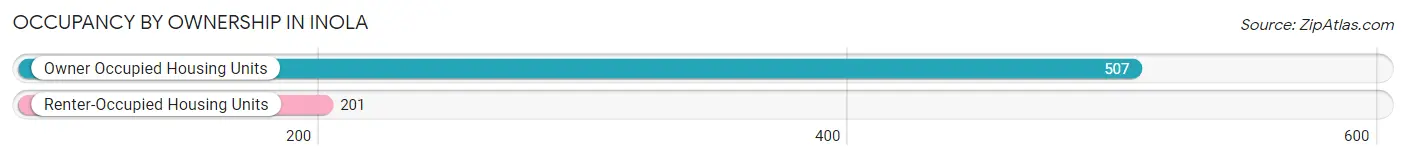
| Occupancy | # Housing Units | % Housing Units |
| Owner Occupied Housing Units | 507 | 71.6% |
| Renter-Occupied Housing Units | 201 | 28.4% |
| Total Occupied Housing Units | 708 | 100.0% |
Occupancy by Household Size in Inola
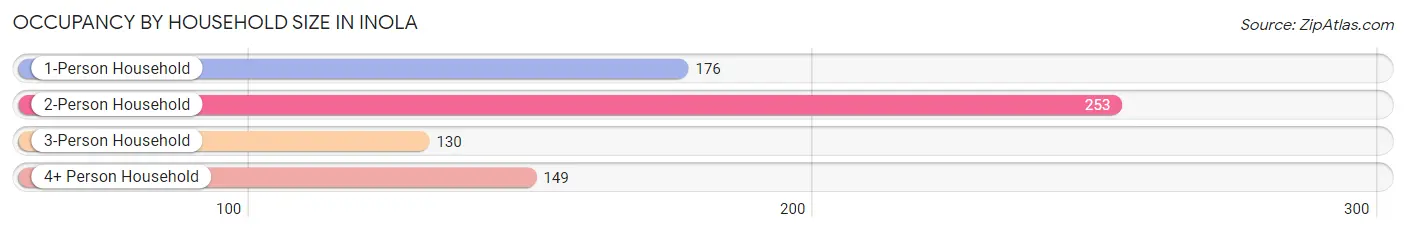
| Household Size | # Housing Units | % Housing Units |
| 1-Person Household | 176 | 24.9% |
| 2-Person Household | 253 | 35.7% |
| 3-Person Household | 130 | 18.4% |
| 4+ Person Household | 149 | 21.0% |
| Total Housing Units | 708 | 100.0% |
Occupancy by Ownership by Household Size in Inola
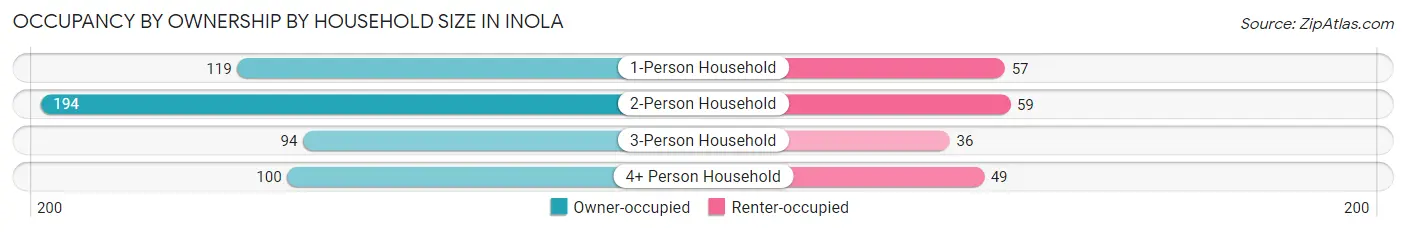
| Household Size | Owner-occupied | Renter-occupied |
| 1-Person Household | 119 (67.6%) | 57 (32.4%) |
| 2-Person Household | 194 (76.7%) | 59 (23.3%) |
| 3-Person Household | 94 (72.3%) | 36 (27.7%) |
| 4+ Person Household | 100 (67.1%) | 49 (32.9%) |
| Total Housing Units | 507 (71.6%) | 201 (28.4%) |
Occupancy by Educational Attainment in Inola
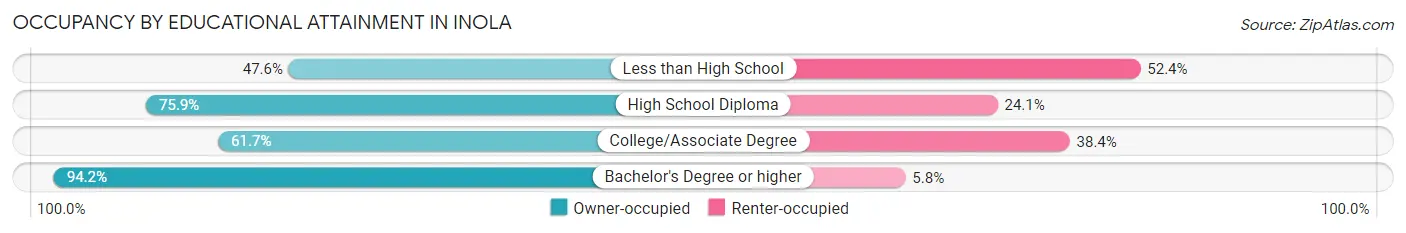
| Household Size | Owner-occupied | Renter-occupied |
| Less than High School | 30 (47.6%) | 33 (52.4%) |
| High School Diploma | 183 (75.9%) | 58 (24.1%) |
| College/Associate Degree | 164 (61.7%) | 102 (38.4%) |
| Bachelor's Degree or higher | 130 (94.2%) | 8 (5.8%) |
Occupancy by Age of Householder in Inola
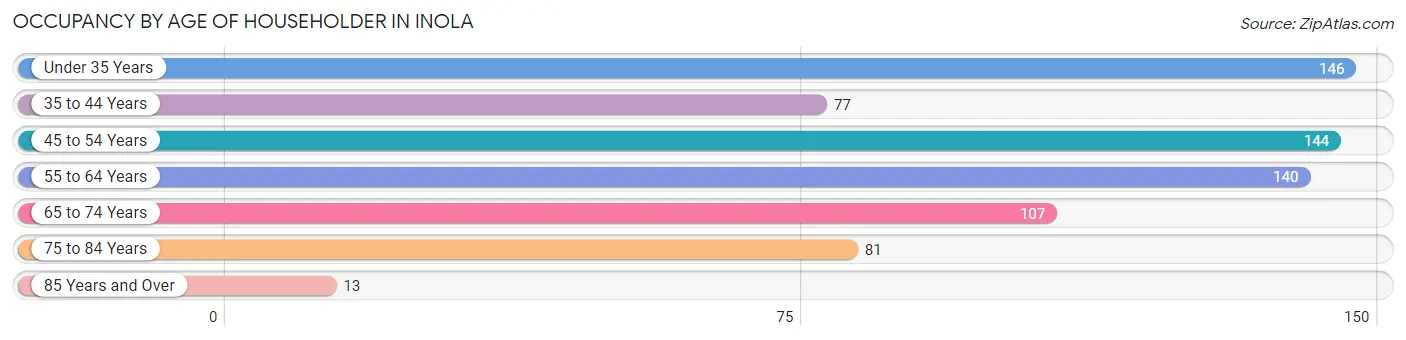
| Age Bracket | # Households | % Households |
| Under 35 Years | 146 | 20.6% |
| 35 to 44 Years | 77 | 10.9% |
| 45 to 54 Years | 144 | 20.3% |
| 55 to 64 Years | 140 | 19.8% |
| 65 to 74 Years | 107 | 15.1% |
| 75 to 84 Years | 81 | 11.4% |
| 85 Years and Over | 13 | 1.8% |
| Total | 708 | 100.0% |
Housing Finances in Inola
Median Income by Occupancy in Inola
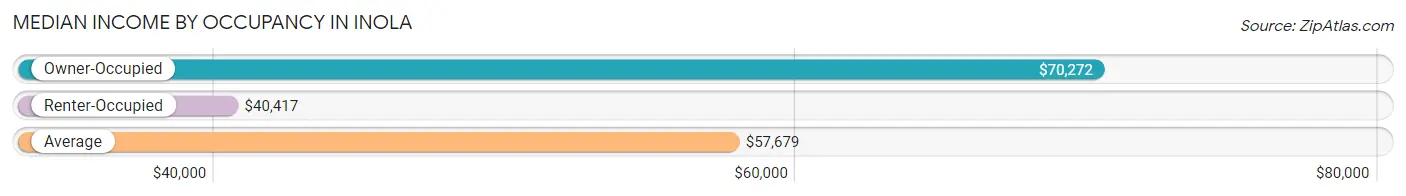
| Occupancy Type | # Households | Median Income |
| Owner-Occupied | 507 (71.6%) | $70,272 |
| Renter-Occupied | 201 (28.4%) | $40,417 |
| Average | 708 (100.0%) | $57,679 |
Occupancy by Householder Income Bracket in Inola
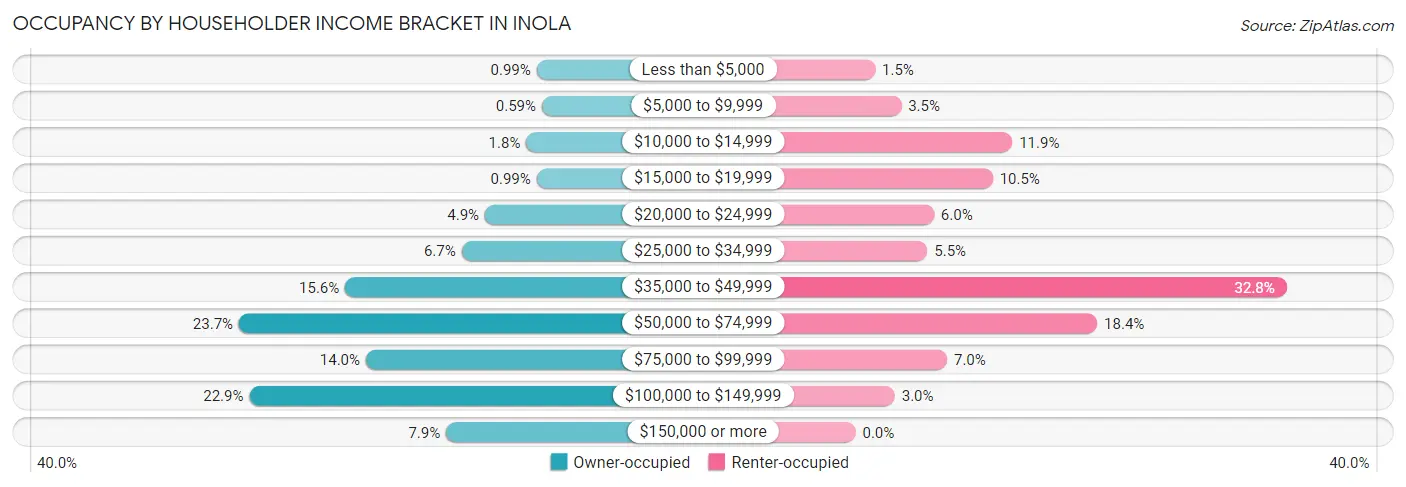
| Income Bracket | Owner-occupied | Renter-occupied |
| Less than $5,000 | 5 (1.0%) | 3 (1.5%) |
| $5,000 to $9,999 | 3 (0.6%) | 7 (3.5%) |
| $10,000 to $14,999 | 9 (1.8%) | 24 (11.9%) |
| $15,000 to $19,999 | 5 (1.0%) | 21 (10.4%) |
| $20,000 to $24,999 | 25 (4.9%) | 12 (6.0%) |
| $25,000 to $34,999 | 34 (6.7%) | 11 (5.5%) |
| $35,000 to $49,999 | 79 (15.6%) | 66 (32.8%) |
| $50,000 to $74,999 | 120 (23.7%) | 37 (18.4%) |
| $75,000 to $99,999 | 71 (14.0%) | 14 (7.0%) |
| $100,000 to $149,999 | 116 (22.9%) | 6 (3.0%) |
| $150,000 or more | 40 (7.9%) | 0 (0.0%) |
| Total | 507 (100.0%) | 201 (100.0%) |
Monthly Housing Cost Tiers in Inola
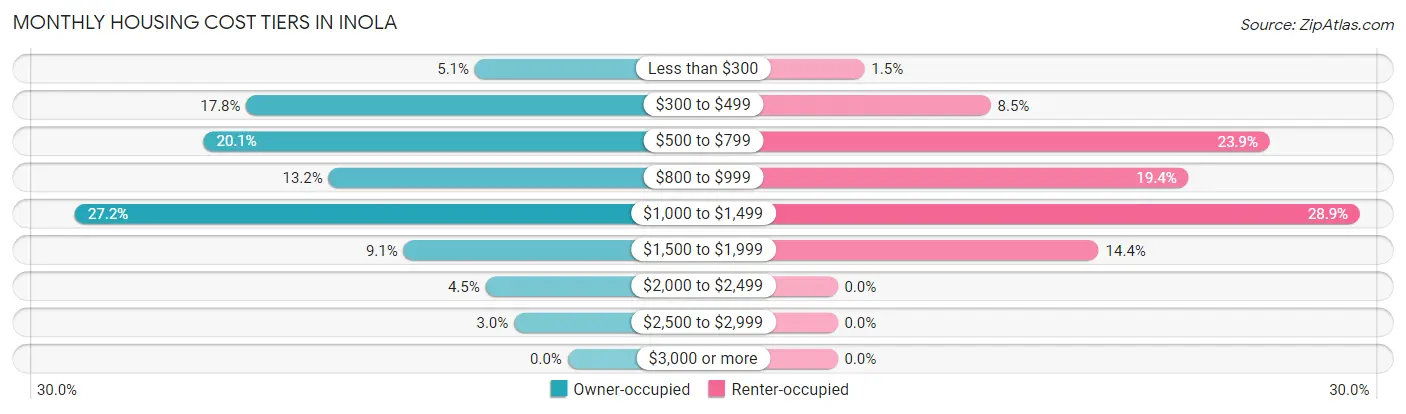
| Monthly Cost | Owner-occupied | Renter-occupied |
| Less than $300 | 26 (5.1%) | 3 (1.5%) |
| $300 to $499 | 90 (17.7%) | 17 (8.5%) |
| $500 to $799 | 102 (20.1%) | 48 (23.9%) |
| $800 to $999 | 67 (13.2%) | 39 (19.4%) |
| $1,000 to $1,499 | 138 (27.2%) | 58 (28.9%) |
| $1,500 to $1,999 | 46 (9.1%) | 29 (14.4%) |
| $2,000 to $2,499 | 23 (4.5%) | 0 (0.0%) |
| $2,500 to $2,999 | 15 (3.0%) | 0 (0.0%) |
| $3,000 or more | 0 (0.0%) | 0 (0.0%) |
| Total | 507 (100.0%) | 201 (100.0%) |
Physical Housing Characteristics in Inola
Housing Structures in Inola
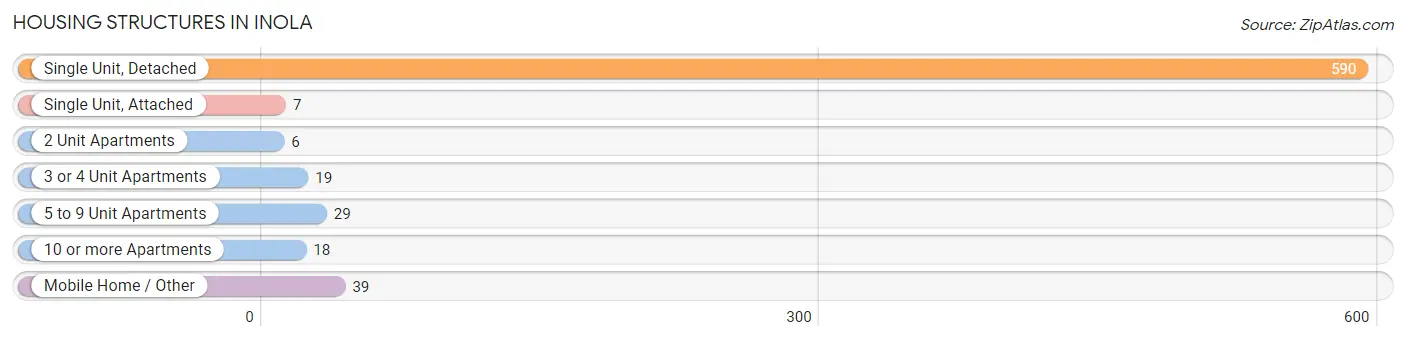
| Structure Type | # Housing Units | % Housing Units |
| Single Unit, Detached | 590 | 83.3% |
| Single Unit, Attached | 7 | 1.0% |
| 2 Unit Apartments | 6 | 0.9% |
| 3 or 4 Unit Apartments | 19 | 2.7% |
| 5 to 9 Unit Apartments | 29 | 4.1% |
| 10 or more Apartments | 18 | 2.5% |
| Mobile Home / Other | 39 | 5.5% |
| Total | 708 | 100.0% |
Housing Structures by Occupancy in Inola
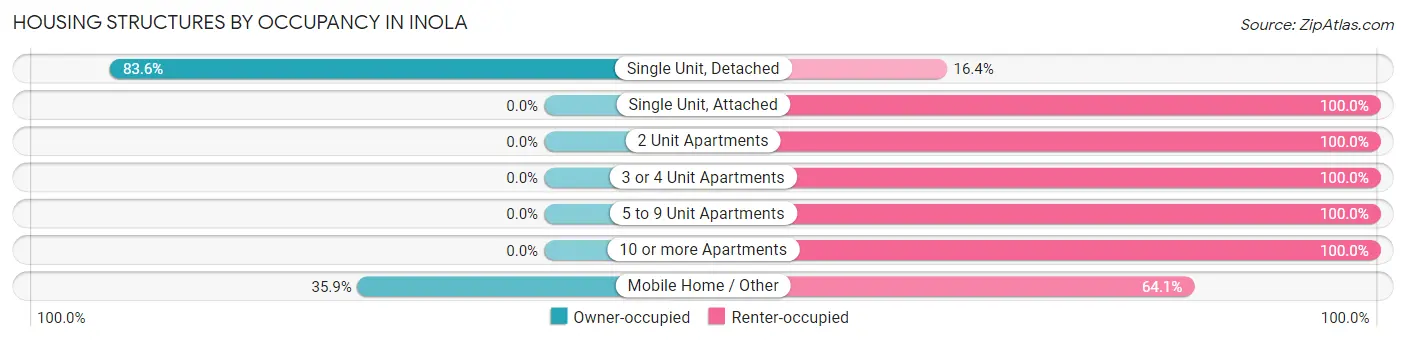
| Structure Type | Owner-occupied | Renter-occupied |
| Single Unit, Detached | 493 (83.6%) | 97 (16.4%) |
| Single Unit, Attached | 0 (0.0%) | 7 (100.0%) |
| 2 Unit Apartments | 0 (0.0%) | 6 (100.0%) |
| 3 or 4 Unit Apartments | 0 (0.0%) | 19 (100.0%) |
| 5 to 9 Unit Apartments | 0 (0.0%) | 29 (100.0%) |
| 10 or more Apartments | 0 (0.0%) | 18 (100.0%) |
| Mobile Home / Other | 14 (35.9%) | 25 (64.1%) |
| Total | 507 (71.6%) | 201 (28.4%) |
Housing Structures by Number of Rooms in Inola
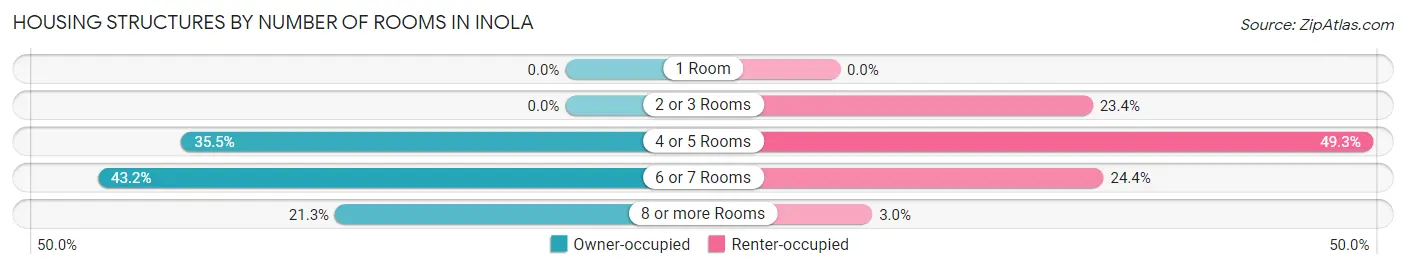
| Number of Rooms | Owner-occupied | Renter-occupied |
| 1 Room | 0 (0.0%) | 0 (0.0%) |
| 2 or 3 Rooms | 0 (0.0%) | 47 (23.4%) |
| 4 or 5 Rooms | 180 (35.5%) | 99 (49.2%) |
| 6 or 7 Rooms | 219 (43.2%) | 49 (24.4%) |
| 8 or more Rooms | 108 (21.3%) | 6 (3.0%) |
| Total | 507 (100.0%) | 201 (100.0%) |
Housing Structure by Heating Type in Inola
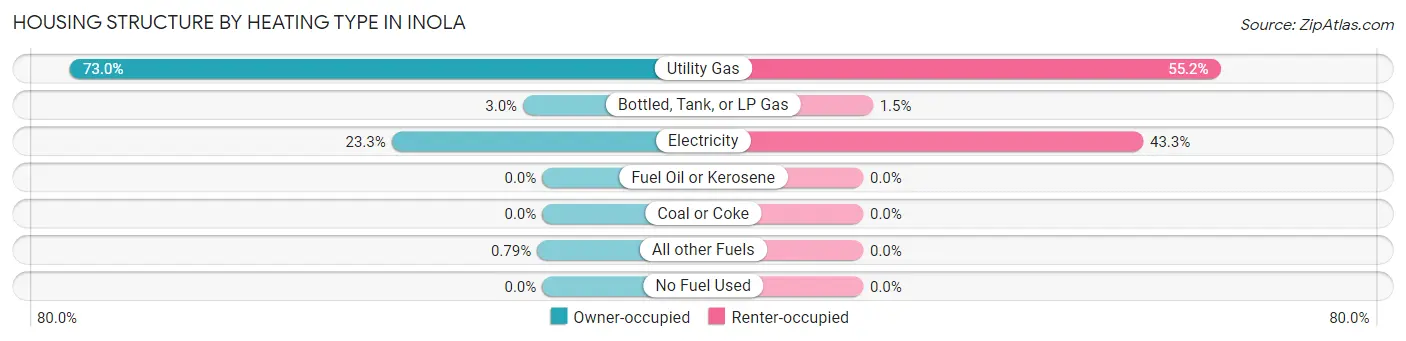
| Heating Type | Owner-occupied | Renter-occupied |
| Utility Gas | 370 (73.0%) | 111 (55.2%) |
| Bottled, Tank, or LP Gas | 15 (3.0%) | 3 (1.5%) |
| Electricity | 118 (23.3%) | 87 (43.3%) |
| Fuel Oil or Kerosene | 0 (0.0%) | 0 (0.0%) |
| Coal or Coke | 0 (0.0%) | 0 (0.0%) |
| All other Fuels | 4 (0.8%) | 0 (0.0%) |
| No Fuel Used | 0 (0.0%) | 0 (0.0%) |
| Total | 507 (100.0%) | 201 (100.0%) |
Household Vehicle Usage in Inola
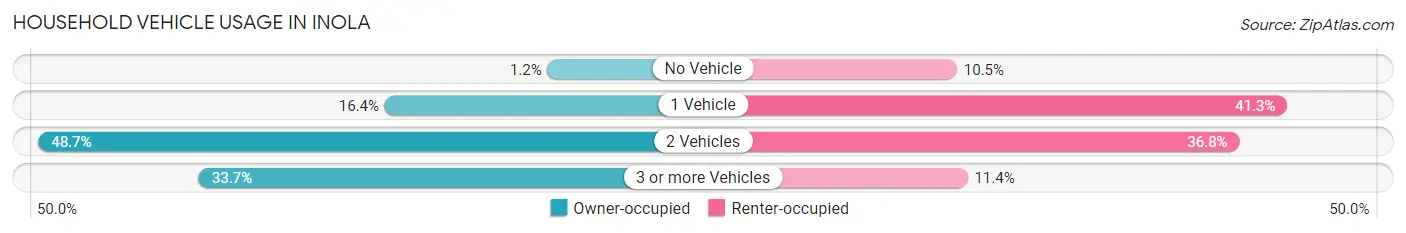
| Vehicles per Household | Owner-occupied | Renter-occupied |
| No Vehicle | 6 (1.2%) | 21 (10.4%) |
| 1 Vehicle | 83 (16.4%) | 83 (41.3%) |
| 2 Vehicles | 247 (48.7%) | 74 (36.8%) |
| 3 or more Vehicles | 171 (33.7%) | 23 (11.4%) |
| Total | 507 (100.0%) | 201 (100.0%) |
Real Estate & Mortgages in Inola
Real Estate and Mortgage Overview in Inola
| Characteristic | Without Mortgage | With Mortgage |
| Housing Units | 196 | 311 |
| Median Property Value | $152,600 | $157,500 |
| Median Household Income | $48,333 | $31 |
| Monthly Housing Costs | $474 | $0 |
| Real Estate Taxes | $1,320 | $14 |
Property Value by Mortgage Status in Inola
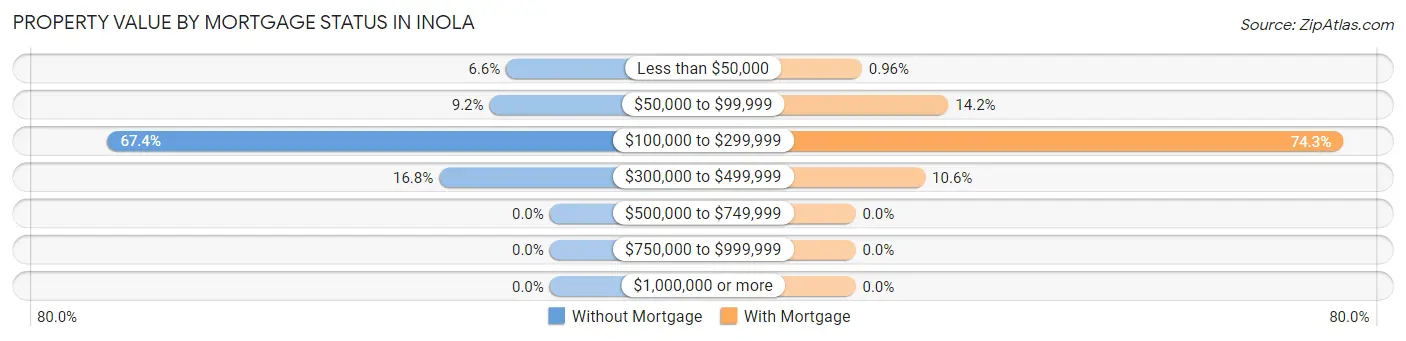
| Property Value | Without Mortgage | With Mortgage |
| Less than $50,000 | 13 (6.6%) | 3 (1.0%) |
| $50,000 to $99,999 | 18 (9.2%) | 44 (14.1%) |
| $100,000 to $299,999 | 132 (67.3%) | 231 (74.3%) |
| $300,000 to $499,999 | 33 (16.8%) | 33 (10.6%) |
| $500,000 to $749,999 | 0 (0.0%) | 0 (0.0%) |
| $750,000 to $999,999 | 0 (0.0%) | 0 (0.0%) |
| $1,000,000 or more | 0 (0.0%) | 0 (0.0%) |
| Total | 196 (100.0%) | 311 (100.0%) |
Household Income by Mortgage Status in Inola
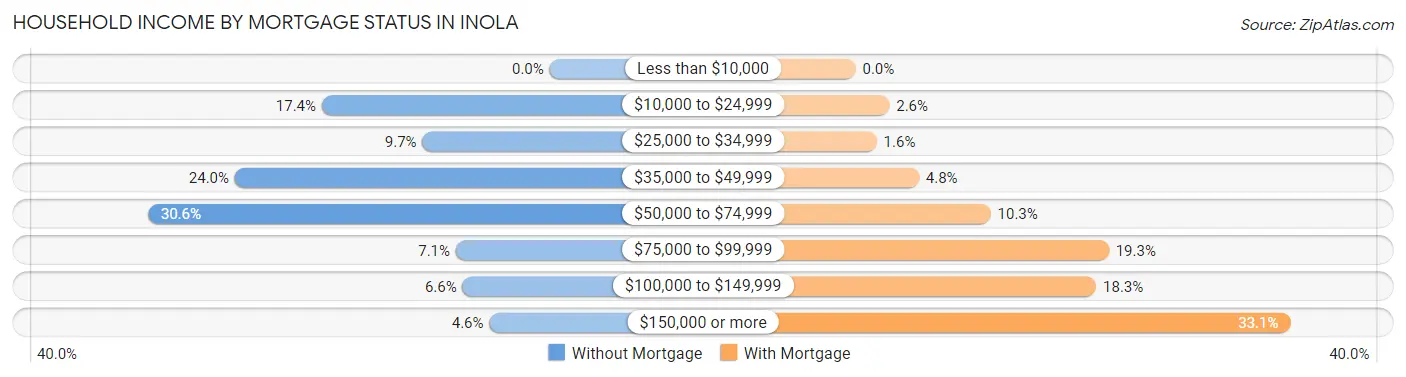
| Household Income | Without Mortgage | With Mortgage |
| Less than $10,000 | 0 (0.0%) | 0 (0.0%) |
| $10,000 to $24,999 | 34 (17.3%) | 8 (2.6%) |
| $25,000 to $34,999 | 19 (9.7%) | 5 (1.6%) |
| $35,000 to $49,999 | 47 (24.0%) | 15 (4.8%) |
| $50,000 to $74,999 | 60 (30.6%) | 32 (10.3%) |
| $75,000 to $99,999 | 14 (7.1%) | 60 (19.3%) |
| $100,000 to $149,999 | 13 (6.6%) | 57 (18.3%) |
| $150,000 or more | 9 (4.6%) | 103 (33.1%) |
| Total | 196 (100.0%) | 311 (100.0%) |
Property Value to Household Income Ratio in Inola
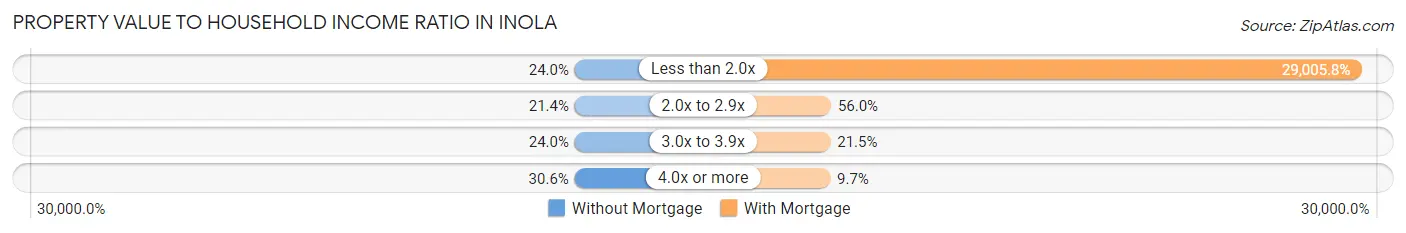
| Value-to-Income Ratio | Without Mortgage | With Mortgage |
| Less than 2.0x | 47 (24.0%) | 90,208 (29,005.8%) |
| 2.0x to 2.9x | 42 (21.4%) | 174 (55.9%) |
| 3.0x to 3.9x | 47 (24.0%) | 67 (21.5%) |
| 4.0x or more | 60 (30.6%) | 30 (9.7%) |
| Total | 196 (100.0%) | 311 (100.0%) |
Real Estate Taxes by Mortgage Status in Inola
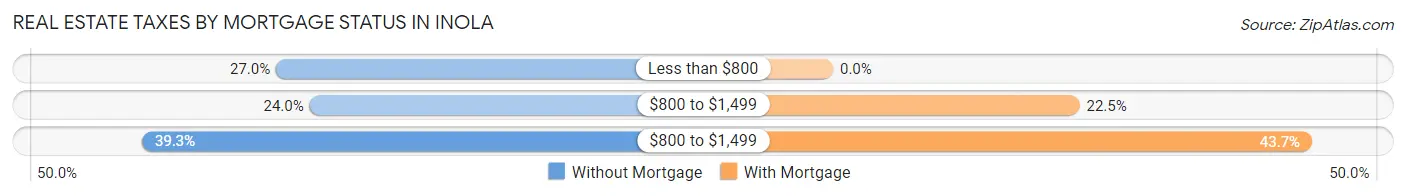
| Property Taxes | Without Mortgage | With Mortgage |
| Less than $800 | 53 (27.0%) | 0 (0.0%) |
| $800 to $1,499 | 47 (24.0%) | 70 (22.5%) |
| $800 to $1,499 | 77 (39.3%) | 136 (43.7%) |
| Total | 196 (100.0%) | 311 (100.0%) |
Health & Disability in Inola
Health Insurance Coverage by Age in Inola
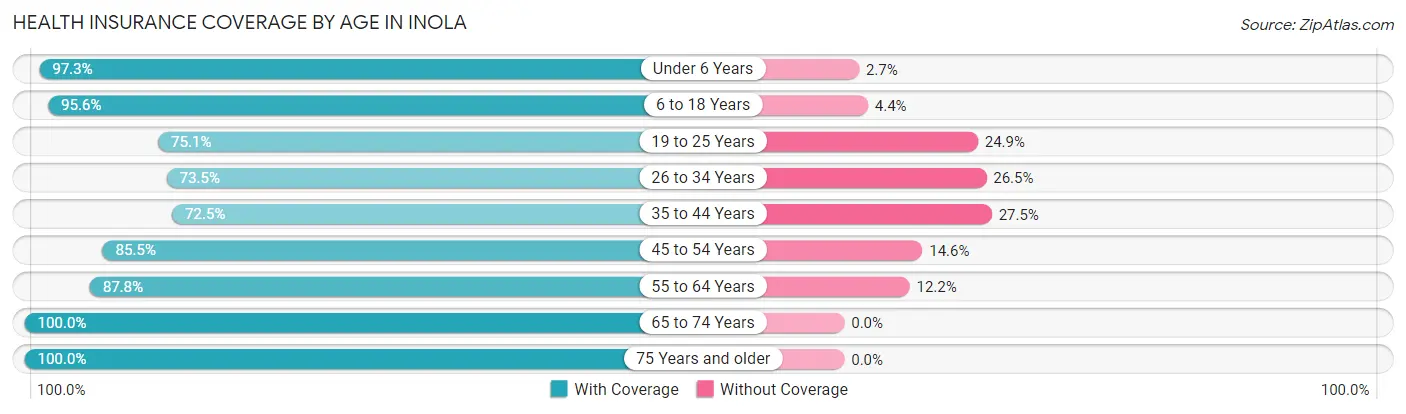
| Age Bracket | With Coverage | Without Coverage |
| Under 6 Years | 142 (97.3%) | 4 (2.7%) |
| 6 to 18 Years | 305 (95.6%) | 14 (4.4%) |
| 19 to 25 Years | 175 (75.1%) | 58 (24.9%) |
| 26 to 34 Years | 161 (73.5%) | 58 (26.5%) |
| 35 to 44 Years | 124 (72.5%) | 47 (27.5%) |
| 45 to 54 Years | 182 (85.5%) | 31 (14.5%) |
| 55 to 64 Years | 202 (87.8%) | 28 (12.2%) |
| 65 to 74 Years | 161 (100.0%) | 0 (0.0%) |
| 75 Years and older | 125 (100.0%) | 0 (0.0%) |
| Total | 1,577 (86.8%) | 240 (13.2%) |
Health Insurance Coverage by Citizenship Status in Inola
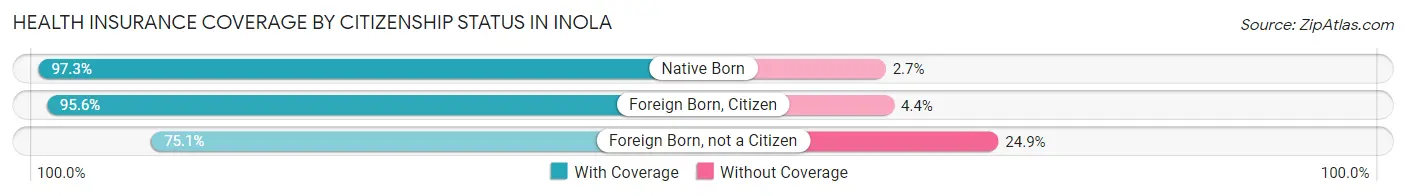
| Citizenship Status | With Coverage | Without Coverage |
| Native Born | 142 (97.3%) | 4 (2.7%) |
| Foreign Born, Citizen | 305 (95.6%) | 14 (4.4%) |
| Foreign Born, not a Citizen | 175 (75.1%) | 58 (24.9%) |
Health Insurance Coverage by Household Income in Inola
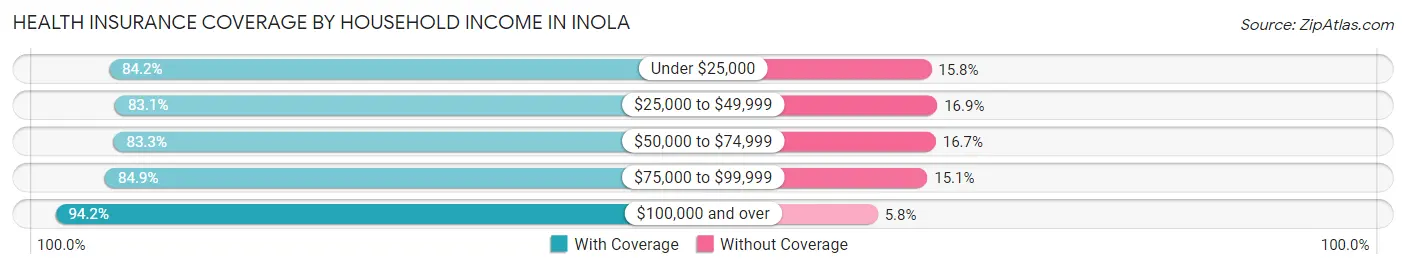
| Household Income | With Coverage | Without Coverage |
| Under $25,000 | 170 (84.2%) | 32 (15.8%) |
| $25,000 to $49,999 | 358 (83.1%) | 73 (16.9%) |
| $50,000 to $74,999 | 320 (83.3%) | 64 (16.7%) |
| $75,000 to $99,999 | 225 (84.9%) | 40 (15.1%) |
| $100,000 and over | 504 (94.2%) | 31 (5.8%) |
Public vs Private Health Insurance Coverage by Age in Inola
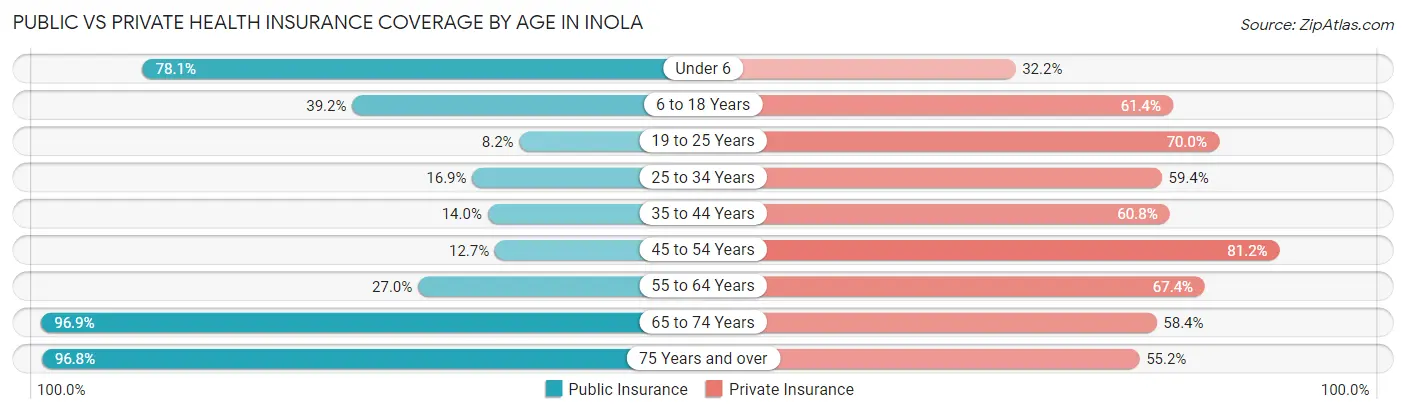
| Age Bracket | Public Insurance | Private Insurance |
| Under 6 | 114 (78.1%) | 47 (32.2%) |
| 6 to 18 Years | 125 (39.2%) | 196 (61.4%) |
| 19 to 25 Years | 19 (8.2%) | 163 (70.0%) |
| 25 to 34 Years | 37 (16.9%) | 130 (59.4%) |
| 35 to 44 Years | 24 (14.0%) | 104 (60.8%) |
| 45 to 54 Years | 27 (12.7%) | 173 (81.2%) |
| 55 to 64 Years | 62 (27.0%) | 155 (67.4%) |
| 65 to 74 Years | 156 (96.9%) | 94 (58.4%) |
| 75 Years and over | 121 (96.8%) | 69 (55.2%) |
| Total | 685 (37.7%) | 1,131 (62.3%) |
Disability Status by Sex by Age in Inola
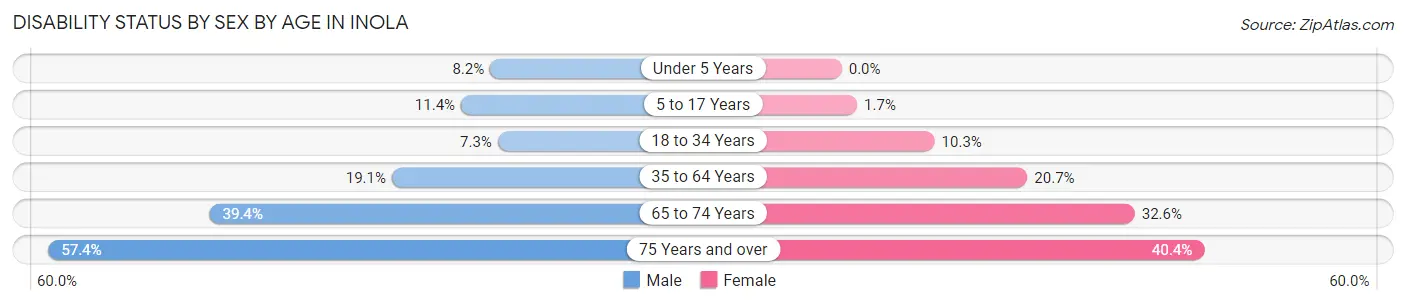
| Age Bracket | Male | Female |
| Under 5 Years | 4 (8.2%) | 0 (0.0%) |
| 5 to 17 Years | 17 (11.4%) | 3 (1.7%) |
| 18 to 34 Years | 16 (7.3%) | 27 (10.3%) |
| 35 to 64 Years | 60 (19.1%) | 62 (20.7%) |
| 65 to 74 Years | 26 (39.4%) | 31 (32.6%) |
| 75 Years and over | 39 (57.4%) | 23 (40.4%) |
Disability Class by Sex by Age in Inola
Disability Class: Hearing Difficulty
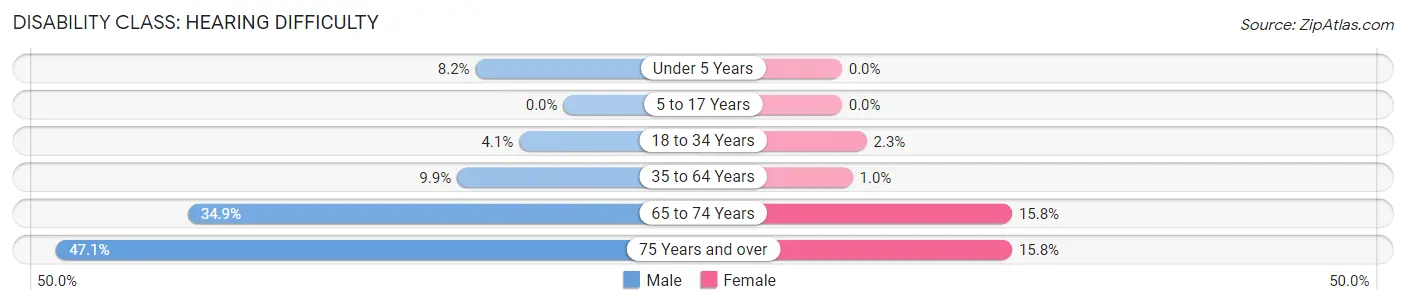
| Age Bracket | Male | Female |
| Under 5 Years | 4 (8.2%) | 0 (0.0%) |
| 5 to 17 Years | 0 (0.0%) | 0 (0.0%) |
| 18 to 34 Years | 9 (4.1%) | 6 (2.3%) |
| 35 to 64 Years | 31 (9.9%) | 3 (1.0%) |
| 65 to 74 Years | 23 (34.8%) | 15 (15.8%) |
| 75 Years and over | 32 (47.1%) | 9 (15.8%) |
Disability Class: Vision Difficulty
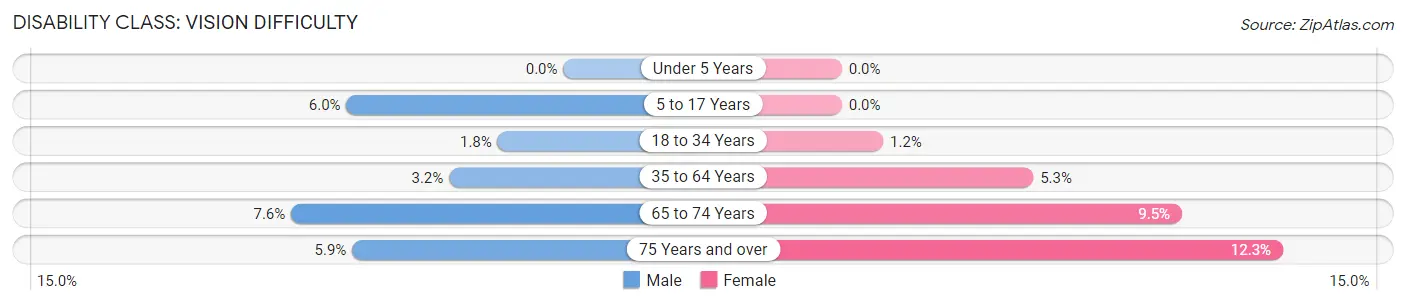
| Age Bracket | Male | Female |
| Under 5 Years | 0 (0.0%) | 0 (0.0%) |
| 5 to 17 Years | 9 (6.0%) | 0 (0.0%) |
| 18 to 34 Years | 4 (1.8%) | 3 (1.1%) |
| 35 to 64 Years | 10 (3.2%) | 16 (5.3%) |
| 65 to 74 Years | 5 (7.6%) | 9 (9.5%) |
| 75 Years and over | 4 (5.9%) | 7 (12.3%) |
Disability Class: Cognitive Difficulty
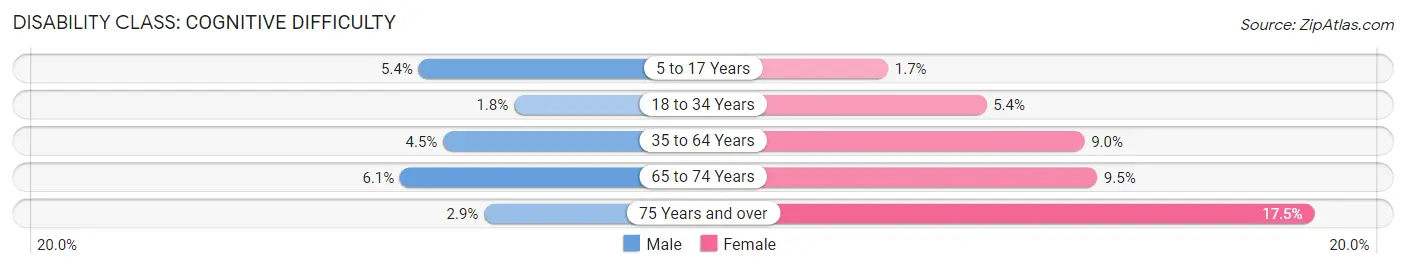
| Age Bracket | Male | Female |
| 5 to 17 Years | 8 (5.4%) | 3 (1.7%) |
| 18 to 34 Years | 4 (1.8%) | 14 (5.4%) |
| 35 to 64 Years | 14 (4.5%) | 27 (9.0%) |
| 65 to 74 Years | 4 (6.1%) | 9 (9.5%) |
| 75 Years and over | 2 (2.9%) | 10 (17.5%) |
Disability Class: Ambulatory Difficulty
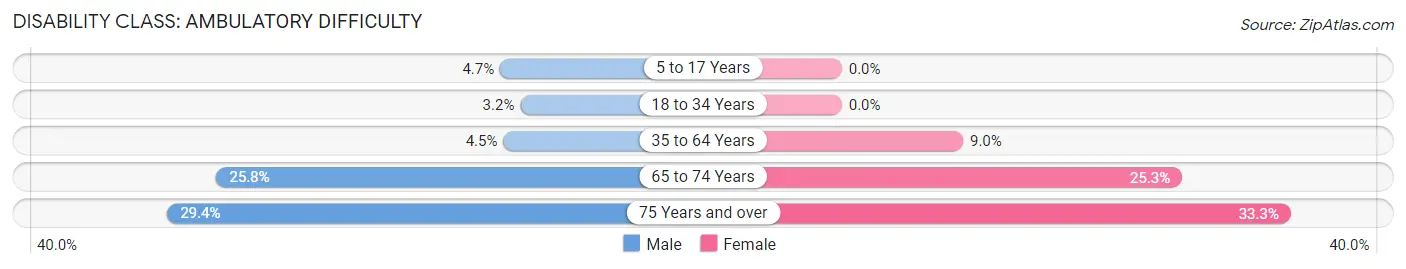
| Age Bracket | Male | Female |
| 5 to 17 Years | 7 (4.7%) | 0 (0.0%) |
| 18 to 34 Years | 7 (3.2%) | 0 (0.0%) |
| 35 to 64 Years | 14 (4.5%) | 27 (9.0%) |
| 65 to 74 Years | 17 (25.8%) | 24 (25.3%) |
| 75 Years and over | 20 (29.4%) | 19 (33.3%) |
Disability Class: Self-Care Difficulty
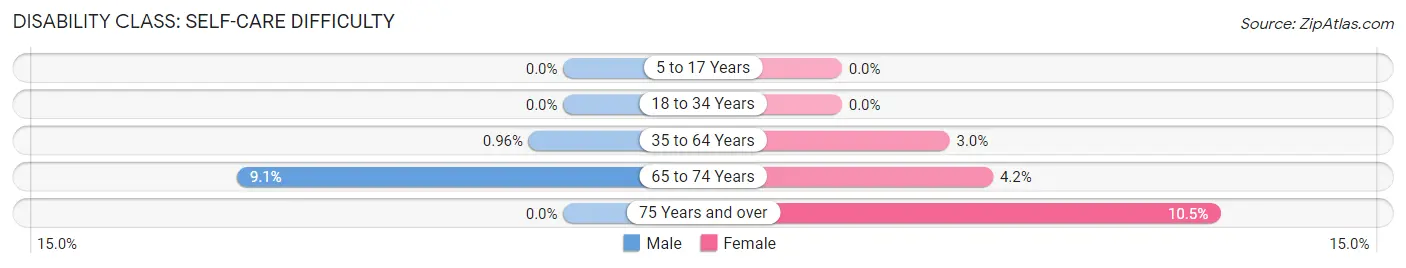
| Age Bracket | Male | Female |
| 5 to 17 Years | 0 (0.0%) | 0 (0.0%) |
| 18 to 34 Years | 0 (0.0%) | 0 (0.0%) |
| 35 to 64 Years | 3 (1.0%) | 9 (3.0%) |
| 65 to 74 Years | 6 (9.1%) | 4 (4.2%) |
| 75 Years and over | 0 (0.0%) | 6 (10.5%) |
Technology Access in Inola
Computing Device Access in Inola
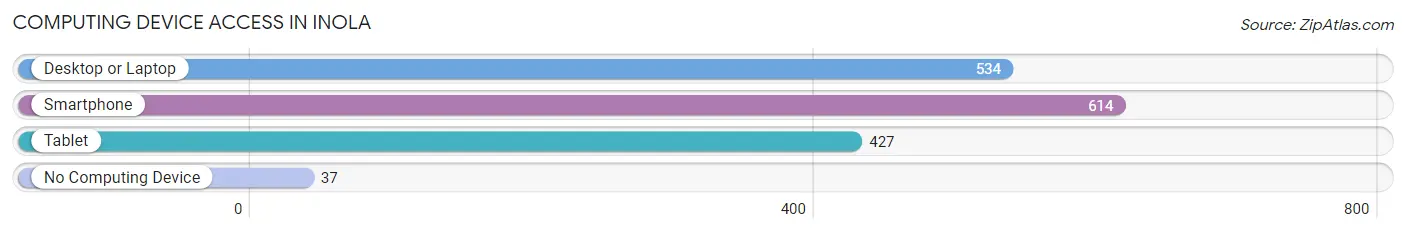
| Device Type | # Households | % Households |
| Desktop or Laptop | 534 | 75.4% |
| Smartphone | 614 | 86.7% |
| Tablet | 427 | 60.3% |
| No Computing Device | 37 | 5.2% |
| Total | 708 | 100.0% |
Internet Access in Inola
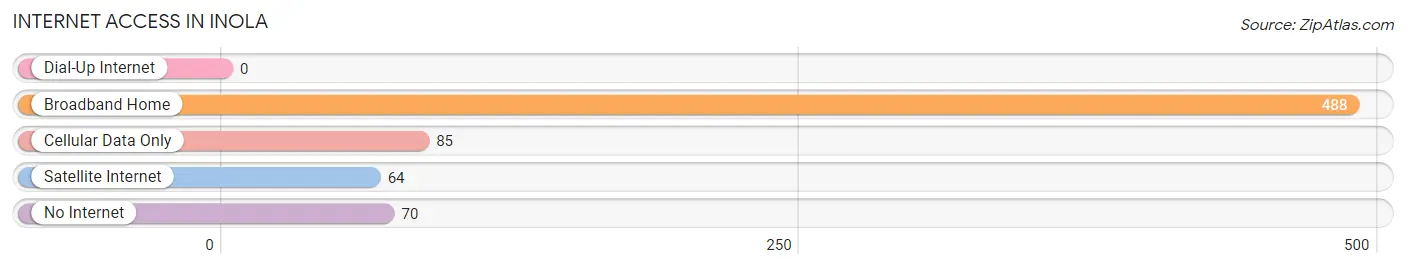
| Internet Type | # Households | % Households |
| Dial-Up Internet | 0 | 0.0% |
| Broadband Home | 488 | 68.9% |
| Cellular Data Only | 85 | 12.0% |
| Satellite Internet | 64 | 9.0% |
| No Internet | 70 | 9.9% |
| Total | 708 | 100.0% |
Inola Summary
Inola is a small town located in Rogers County, Oklahoma. It is situated about 20 miles east of Tulsa and is part of the Tulsa Metropolitan Statistical Area. The town was founded in 1891 and was named after the daughter of a local Choctaw chief. The town has a population of 1,845 as of the 2010 census.
Geography
Inola is located in the foothills of the Ozark Mountains in northeastern Oklahoma. It is situated in the Verdigris River Valley, which is part of the Arkansas River drainage basin. The town is located at an elevation of 745 feet above sea level. The climate is characterized by hot, humid summers and mild winters. The average annual temperature is around 62 degrees Fahrenheit.
The town is located on State Highway 88, which connects it to Tulsa and other nearby towns. The nearest major airport is Tulsa International Airport, which is located about 25 miles away.
Demographics
As of the 2010 census, the population of Inola was 1,845. The racial makeup of the town was 94.3% White, 0.7% African American, 0.7% Native American, 0.2% Asian, 0.1% Pacific Islander, 0.7% from other races, and 2.4% from two or more races. Hispanic or Latino of any race were 2.2% of the population.
The median income for a household in the town was $37,917, and the median income for a family was $45,000. The per capita income for the town was $17,845. About 11.2% of families and 14.2% of the population were below the poverty line, including 18.2% of those under age 18 and 8.3% of those age 65 or over.
Economy
Inola’s economy is largely based on agriculture and manufacturing. The town is home to several large farms, which produce a variety of crops, including corn, wheat, soybeans, and hay. The town is also home to several manufacturing companies, including a plastics plant, a metal fabrication plant, and a food processing plant.
In addition to agriculture and manufacturing, Inola is home to several small businesses, including restaurants, retail stores, and service providers. The town is also home to a branch of the Rogers County Public Library.
History
Inola was founded in 1891 by a group of settlers from Arkansas. The town was named after the daughter of a local Choctaw chief. The town grew slowly over the years, and by the early 1900s, it had become a thriving agricultural community.
In the 1920s, the town experienced a period of growth as oil was discovered in the area. This led to the construction of several oil refineries and other related businesses. The town continued to grow throughout the 20th century, and by the 2000s, it had become a small but thriving community.
Today, Inola is a quiet, rural town with a strong sense of community. The town is home to several small businesses, farms, and manufacturing companies. It is also home to a branch of the Rogers County Public Library.
Common Questions
What is Per Capita Income in Inola?
Per Capita income in Inola is $28,690.
What is the Median Family Income in Inola?
Median Family Income in Inola is $69,688.
What is the Median Household income in Inola?
Median Household Income in Inola is $57,679.
What is Income or Wage Gap in Inola?
Income or Wage Gap in Inola is 34.6%.
Women in Inola earn 65.4 cents for every dollar earned by a man.
What is Inequality or Gini Index in Inola?
Inequality or Gini Index in Inola is 0.39.
What is the Total Population of Inola?
Total Population of Inola is 1,879.
What is the Total Male Population of Inola?
Total Male Population of Inola is 898.
What is the Total Female Population of Inola?
Total Female Population of Inola is 981.
What is the Ratio of Males per 100 Females in Inola?
There are 91.54 Males per 100 Females in Inola.
What is the Ratio of Females per 100 Males in Inola?
There are 109.24 Females per 100 Males in Inola.
What is the Median Population Age in Inola?
Median Population Age in Inola is 36.3 Years.
What is the Average Family Size in Inola
Average Family Size in Inola is 3.1 People.
What is the Average Household Size in Inola
Average Household Size in Inola is 2.6 People.
How Large is the Labor Force in Inola?
There are 931 People in the Labor Forcein in Inola.
What is the Percentage of People in the Labor Force in Inola?
61.6% of People are in the Labor Force in Inola.
What is the Unemployment Rate in Inola?
Unemployment Rate in Inola is 9.1%.