Meno, OK Map & Demographics
Meno Map
Meno Overview
$34,285
PER CAPITA INCOME
$71,771
AVG FAMILY INCOME
$71,458
AVG HOUSEHOLD INCOME
54.5%
WAGE / INCOME GAP [ % ]
45.5¢/ $1
WAGE / INCOME GAP [ $ ]
0.34
INEQUALITY / GINI INDEX
226
TOTAL POPULATION
125
MALE POPULATION
101
FEMALE POPULATION
123.76
MALES / 100 FEMALES
80.80
FEMALES / 100 MALES
38.5
MEDIAN AGE
2.6
AVG FAMILY SIZE
2.3
AVG HOUSEHOLD SIZE
144
LABOR FORCE [ PEOPLE ]
74.6%
PERCENT IN LABOR FORCE
0.7%
UNEMPLOYMENT RATE
Meno Zip Codes
Meno Area Codes
Income in Meno
Income Overview in Meno
Per Capita Income in Meno is $34,285, while median incomes of families and households are $71,771 and $71,458 respectively.
| Characteristic | Number | Measure |
| Per Capita Income | 226 | $34,285 |
| Median Family Income | 71 | $71,771 |
| Mean Family Income | 71 | $89,169 |
| Median Household Income | 98 | $71,458 |
| Mean Household Income | 98 | $79,807 |
| Income Deficit | 71 | $0 |
| Wage / Income Gap (%) | 226 | 54.55% |
| Wage / Income Gap ($) | 226 | 45.45¢ per $1 |
| Gini / Inequality Index | 226 | 0.34 |
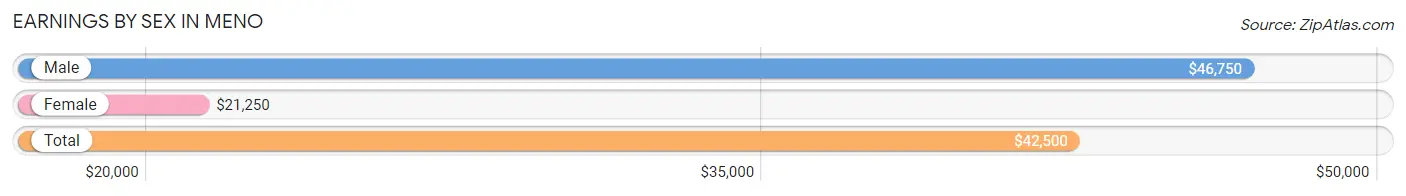
Earnings by Sex in Meno
Average Earnings in Meno are $42,500, $46,750 for men and $21,250 for women, a difference of 54.5%.
| Sex | Number | Average Earnings |
| Male | 94 (63.5%) | $46,750 |
| Female | 54 (36.5%) | $21,250 |
| Total | 148 (100.0%) | $42,500 |
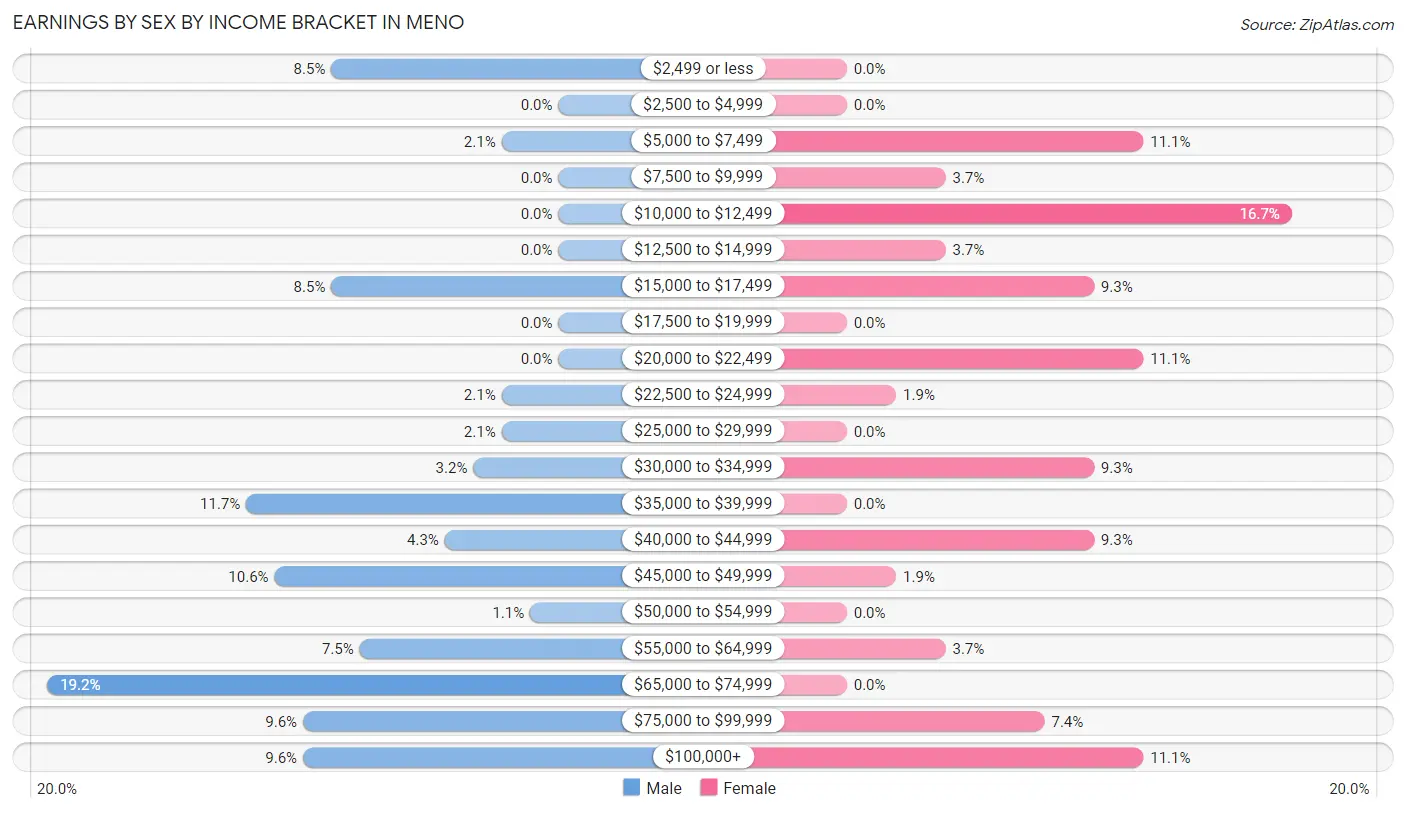
Earnings by Sex by Income Bracket in Meno
The most common earnings brackets in Meno are $65,000 to $74,999 for men (18 | 19.2%) and $10,000 to $12,499 for women (9 | 16.7%).
| Income | Male | Female |
| $2,499 or less | 8 (8.5%) | 0 (0.0%) |
| $2,500 to $4,999 | 0 (0.0%) | 0 (0.0%) |
| $5,000 to $7,499 | 2 (2.1%) | 6 (11.1%) |
| $7,500 to $9,999 | 0 (0.0%) | 2 (3.7%) |
| $10,000 to $12,499 | 0 (0.0%) | 9 (16.7%) |
| $12,500 to $14,999 | 0 (0.0%) | 2 (3.7%) |
| $15,000 to $17,499 | 8 (8.5%) | 5 (9.3%) |
| $17,500 to $19,999 | 0 (0.0%) | 0 (0.0%) |
| $20,000 to $22,499 | 0 (0.0%) | 6 (11.1%) |
| $22,500 to $24,999 | 2 (2.1%) | 1 (1.8%) |
| $25,000 to $29,999 | 2 (2.1%) | 0 (0.0%) |
| $30,000 to $34,999 | 3 (3.2%) | 5 (9.3%) |
| $35,000 to $39,999 | 11 (11.7%) | 0 (0.0%) |
| $40,000 to $44,999 | 4 (4.3%) | 5 (9.3%) |
| $45,000 to $49,999 | 10 (10.6%) | 1 (1.8%) |
| $50,000 to $54,999 | 1 (1.1%) | 0 (0.0%) |
| $55,000 to $64,999 | 7 (7.4%) | 2 (3.7%) |
| $65,000 to $74,999 | 18 (19.2%) | 0 (0.0%) |
| $75,000 to $99,999 | 9 (9.6%) | 4 (7.4%) |
| $100,000+ | 9 (9.6%) | 6 (11.1%) |
| Total | 94 (100.0%) | 54 (100.0%) |
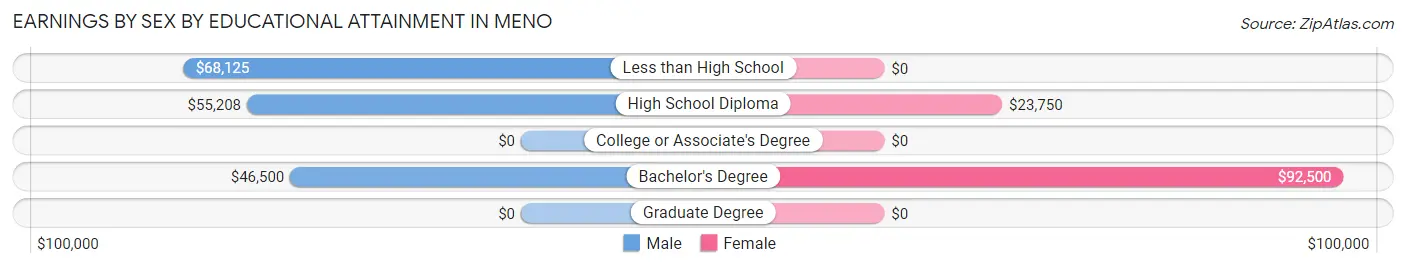
Earnings by Sex by Educational Attainment in Meno
| Educational Attainment | Male Income | Female Income |
| Less than High School | $68,125 | $0 |
| High School Diploma | $55,208 | $23,750 |
| College or Associate's Degree | - | - |
| Bachelor's Degree | $46,500 | $92,500 |
| Graduate Degree | - | - |
| Total | $47,000 | $0 |
Family Income in Meno
Family Income Brackets in Meno
According to the Meno family income data, there are 20 families falling into the $50,000 to $74,999 income range, which is the most common income bracket and makes up 28.2% of all families.
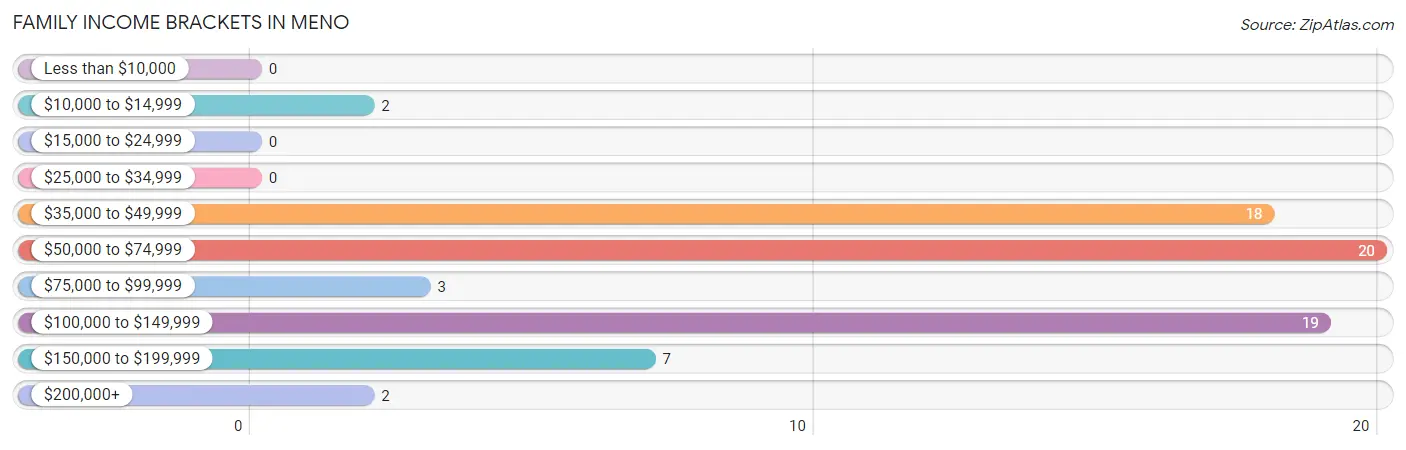
| Income Bracket | # Families | % Families |
| Less than $10,000 | 0 | 0.0% |
| $10,000 to $14,999 | 2 | 2.8% |
| $15,000 to $24,999 | 0 | 0.0% |
| $25,000 to $34,999 | 0 | 0.0% |
| $35,000 to $49,999 | 18 | 25.4% |
| $50,000 to $74,999 | 20 | 28.2% |
| $75,000 to $99,999 | 3 | 4.2% |
| $100,000 to $149,999 | 19 | 26.8% |
| $150,000 to $199,999 | 7 | 9.9% |
| $200,000+ | 2 | 2.8% |
Family Income by Famaliy Size in Meno
2-person families (41 | 57.8%) account for the highest median family income in Meno with $69,688 per family, while 2-person families (41 | 57.8%) have the highest median income of $34,844 per family member.
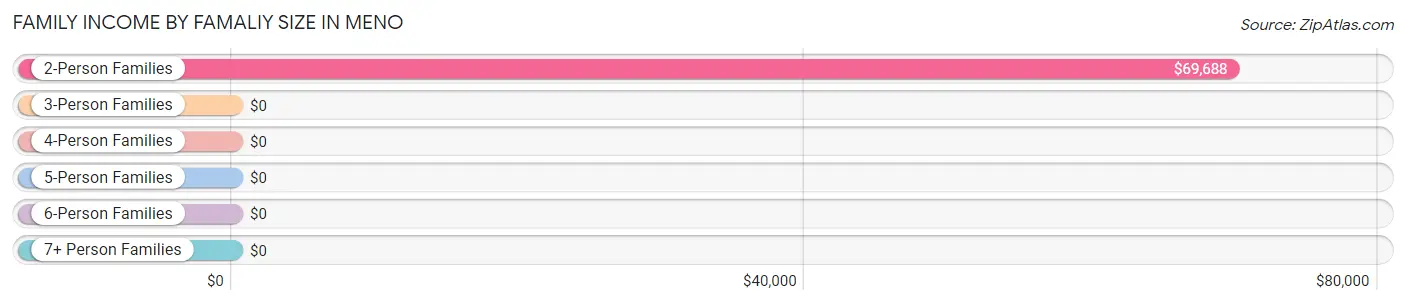
| Income Bracket | # Families | Median Income |
| 2-Person Families | 41 (57.8%) | $69,688 |
| 3-Person Families | 7 (9.9%) | $0 |
| 4-Person Families | 21 (29.6%) | $0 |
| 5-Person Families | 2 (2.8%) | $0 |
| 6-Person Families | 0 (0.0%) | $0 |
| 7+ Person Families | 0 (0.0%) | $0 |
| Total | 71 (100.0%) | $71,771 |
Family Income by Number of Earners in Meno
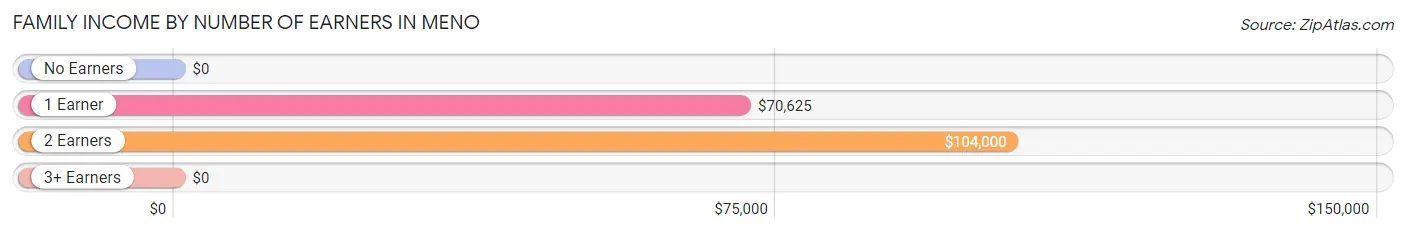
| Number of Earners | # Families | Median Income |
| No Earners | 2 (2.8%) | $0 |
| 1 Earner | 24 (33.8%) | $70,625 |
| 2 Earners | 34 (47.9%) | $104,000 |
| 3+ Earners | 11 (15.5%) | $0 |
| Total | 71 (100.0%) | $71,771 |
Household Income in Meno
Household Income Brackets in Meno
With 23 households falling in the category, the $100,000 to $149,999 income range is the most frequent in Meno, accounting for 23.5% of all households.
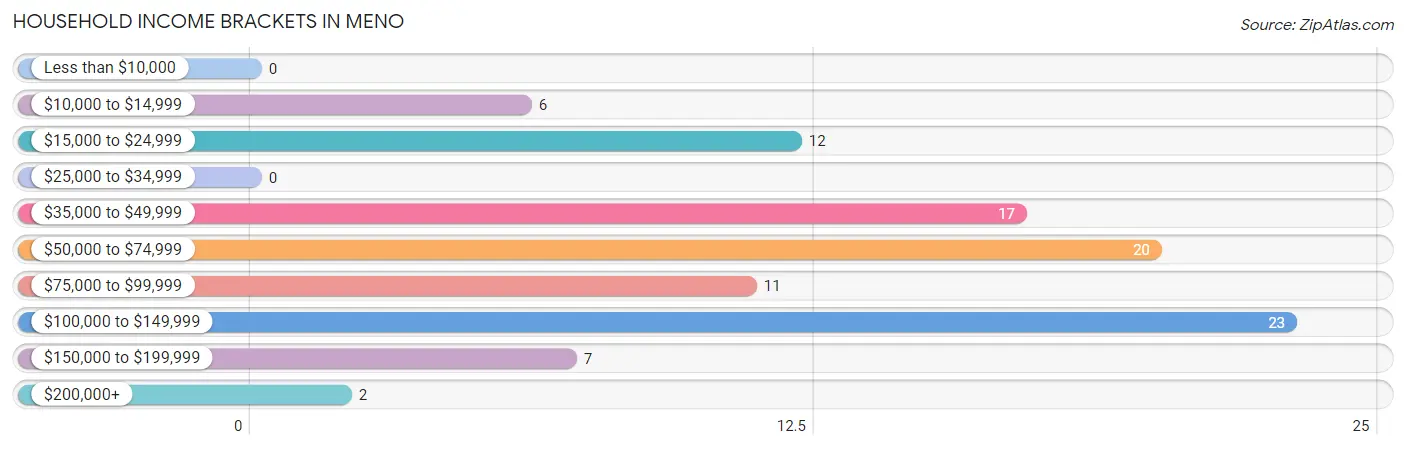
| Income Bracket | # Households | % Households |
| Less than $10,000 | 0 | 0.0% |
| $10,000 to $14,999 | 6 | 6.1% |
| $15,000 to $24,999 | 12 | 12.2% |
| $25,000 to $34,999 | 0 | 0.0% |
| $35,000 to $49,999 | 17 | 17.3% |
| $50,000 to $74,999 | 20 | 20.4% |
| $75,000 to $99,999 | 11 | 11.2% |
| $100,000 to $149,999 | 23 | 23.5% |
| $150,000 to $199,999 | 7 | 7.1% |
| $200,000+ | 2 | 2.0% |
Household Income by Householder Age in Meno
The median household income in Meno is $71,458, with the highest median household income of $104,000 found in the 45 to 64 years age bracket for the primary householder. A total of 40 households (40.8%) fall into this category. Meanwhile, the 15 to 24 years age bracket for the primary householder has the lowest median household income of $0, with 12 households (12.2%) in this group.
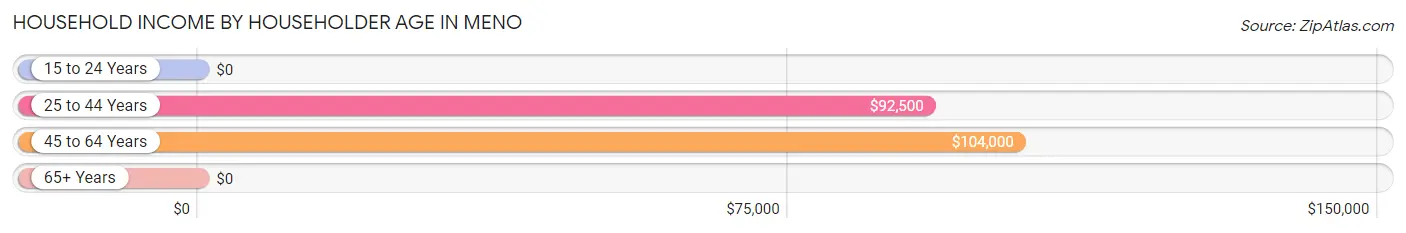
| Income Bracket | # Households | Median Income |
| 15 to 24 Years | 12 (12.2%) | $0 |
| 25 to 44 Years | 26 (26.5%) | $92,500 |
| 45 to 64 Years | 40 (40.8%) | $104,000 |
| 65+ Years | 20 (20.4%) | $0 |
| Total | 98 (100.0%) | $71,458 |
Poverty in Meno
Income Below Poverty by Sex and Age in Meno
With 6.4% poverty level for males and 4.0% for females among the residents of Meno, 65 to 74 year old males and 25 to 34 year old females are the most vulnerable to poverty, with 4 males (57.1%) and 2 females (66.7%) in their respective age groups living below the poverty level.
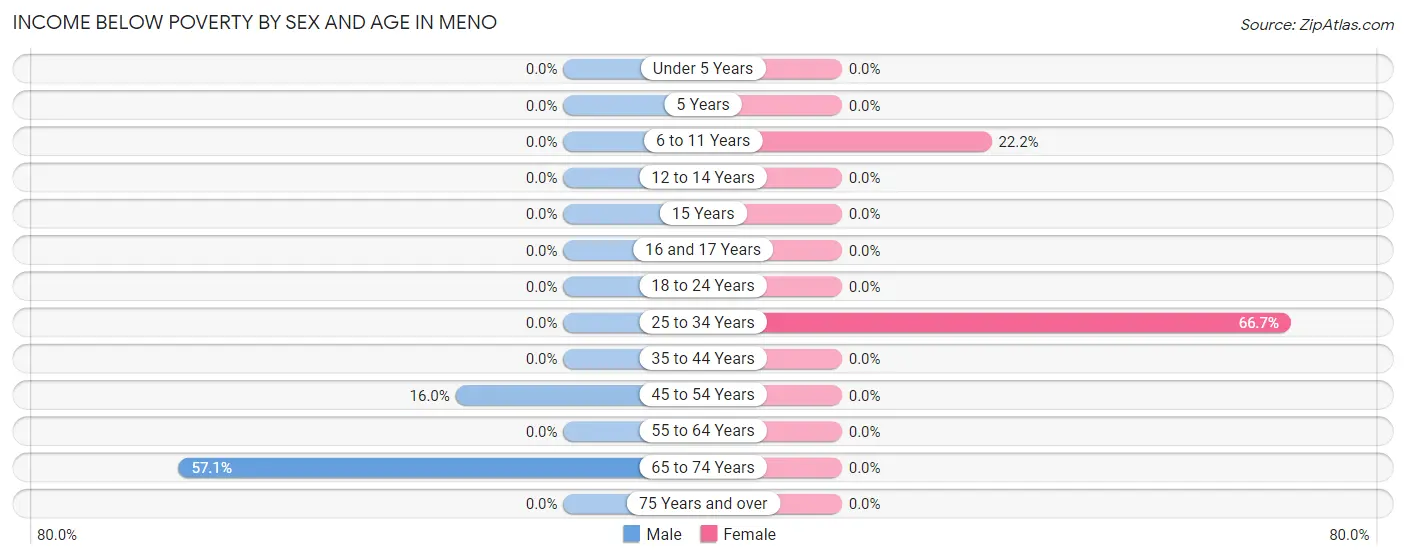
| Age Bracket | Male | Female |
| Under 5 Years | 0 (0.0%) | 0 (0.0%) |
| 5 Years | 0 (0.0%) | 0 (0.0%) |
| 6 to 11 Years | 0 (0.0%) | 2 (22.2%) |
| 12 to 14 Years | 0 (0.0%) | 0 (0.0%) |
| 15 Years | 0 (0.0%) | 0 (0.0%) |
| 16 and 17 Years | 0 (0.0%) | 0 (0.0%) |
| 18 to 24 Years | 0 (0.0%) | 0 (0.0%) |
| 25 to 34 Years | 0 (0.0%) | 2 (66.7%) |
| 35 to 44 Years | 0 (0.0%) | 0 (0.0%) |
| 45 to 54 Years | 4 (16.0%) | 0 (0.0%) |
| 55 to 64 Years | 0 (0.0%) | 0 (0.0%) |
| 65 to 74 Years | 4 (57.1%) | 0 (0.0%) |
| 75 Years and over | 0 (0.0%) | 0 (0.0%) |
| Total | 8 (6.4%) | 4 (4.0%) |
Income Above Poverty by Sex and Age in Meno
According to the poverty statistics in Meno, males aged under 5 years and females aged under 5 years are the age groups that are most secure financially, with 100.0% of males and 100.0% of females in these age groups living above the poverty line.
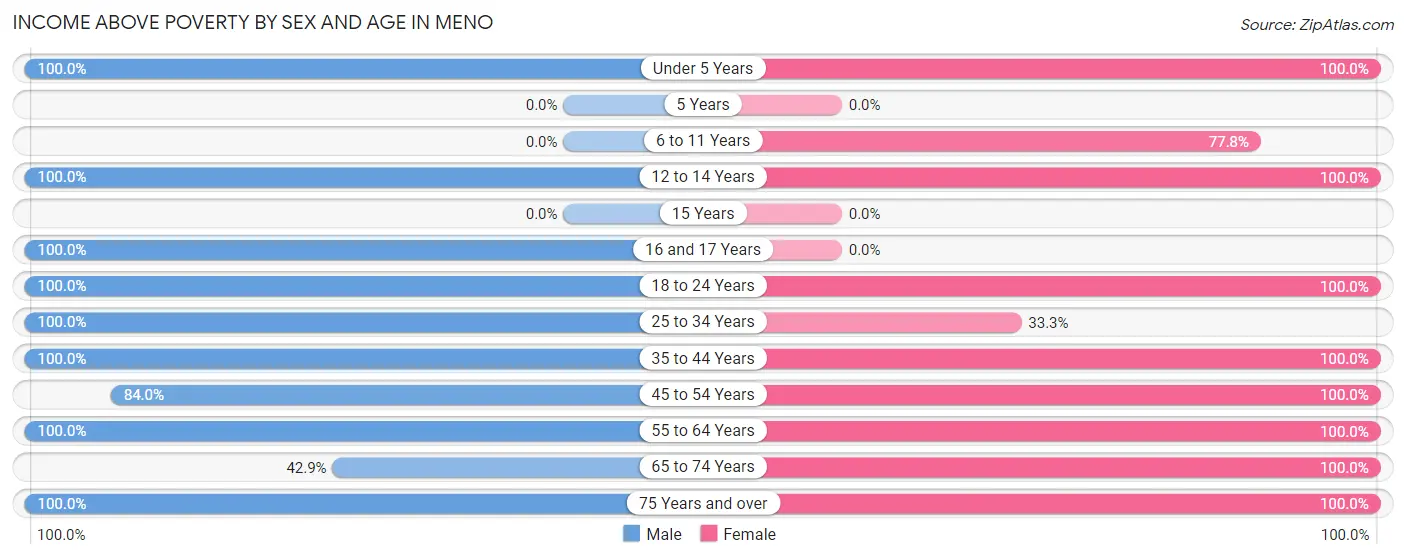
| Age Bracket | Male | Female |
| Under 5 Years | 10 (100.0%) | 5 (100.0%) |
| 5 Years | 0 (0.0%) | 0 (0.0%) |
| 6 to 11 Years | 0 (0.0%) | 7 (77.8%) |
| 12 to 14 Years | 2 (100.0%) | 7 (100.0%) |
| 15 Years | 0 (0.0%) | 0 (0.0%) |
| 16 and 17 Years | 4 (100.0%) | 0 (0.0%) |
| 18 to 24 Years | 24 (100.0%) | 16 (100.0%) |
| 25 to 34 Years | 16 (100.0%) | 1 (33.3%) |
| 35 to 44 Years | 14 (100.0%) | 15 (100.0%) |
| 45 to 54 Years | 21 (84.0%) | 20 (100.0%) |
| 55 to 64 Years | 15 (100.0%) | 11 (100.0%) |
| 65 to 74 Years | 3 (42.9%) | 8 (100.0%) |
| 75 Years and over | 8 (100.0%) | 7 (100.0%) |
| Total | 117 (93.6%) | 97 (96.0%) |
Income Below Poverty Among Married-Couple Families in Meno
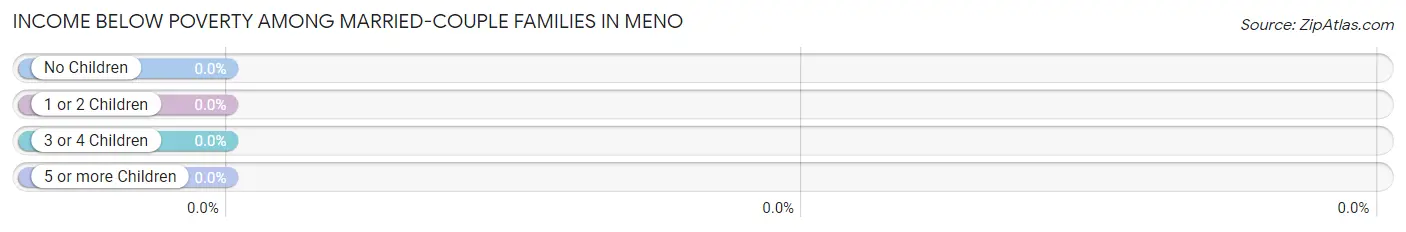
| Children | Above Poverty | Below Poverty |
| No Children | 31 (100.0%) | 0 (0.0%) |
| 1 or 2 Children | 21 (100.0%) | 0 (0.0%) |
| 3 or 4 Children | 0 (0.0%) | 0 (0.0%) |
| 5 or more Children | 0 (0.0%) | 0 (0.0%) |
| Total | 52 (100.0%) | 0 (0.0%) |
Income Below Poverty Among Single-Parent Households in Meno
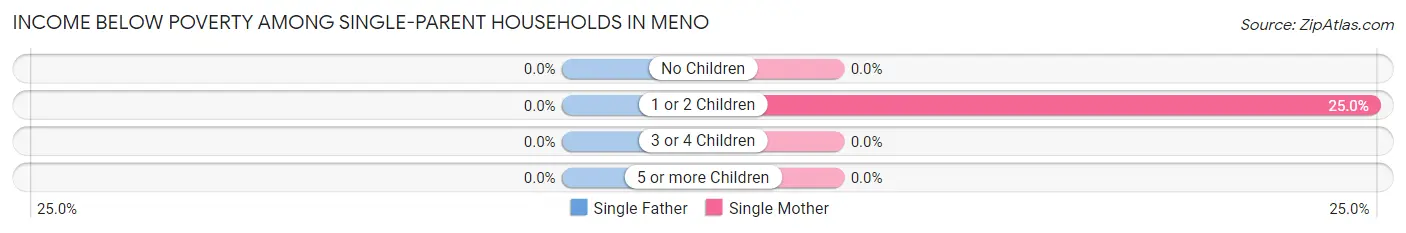
| Children | Single Father | Single Mother |
| No Children | 0 (0.0%) | 0 (0.0%) |
| 1 or 2 Children | 0 (0.0%) | 2 (25.0%) |
| 3 or 4 Children | 0 (0.0%) | 0 (0.0%) |
| 5 or more Children | 0 (0.0%) | 0 (0.0%) |
| Total | 0 (0.0%) | 2 (15.4%) |
Income Below Poverty Among Married-Couple vs Single-Parent Households in Meno
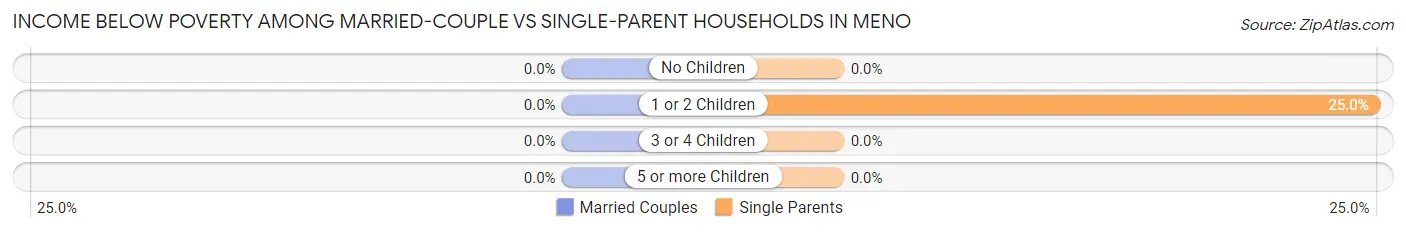
| Children | Married-Couple Families | Single-Parent Households |
| No Children | 0 (0.0%) | 0 (0.0%) |
| 1 or 2 Children | 0 (0.0%) | 2 (25.0%) |
| 3 or 4 Children | 0 (0.0%) | 0 (0.0%) |
| 5 or more Children | 0 (0.0%) | 0 (0.0%) |
| Total | 0 (0.0%) | 2 (10.5%) |
Race in Meno
The most populous races in Meno are White / Caucasian (199 | 88.0%), Hispanic or Latino (46 | 20.3%), and Two or more Races (26 | 11.5%).
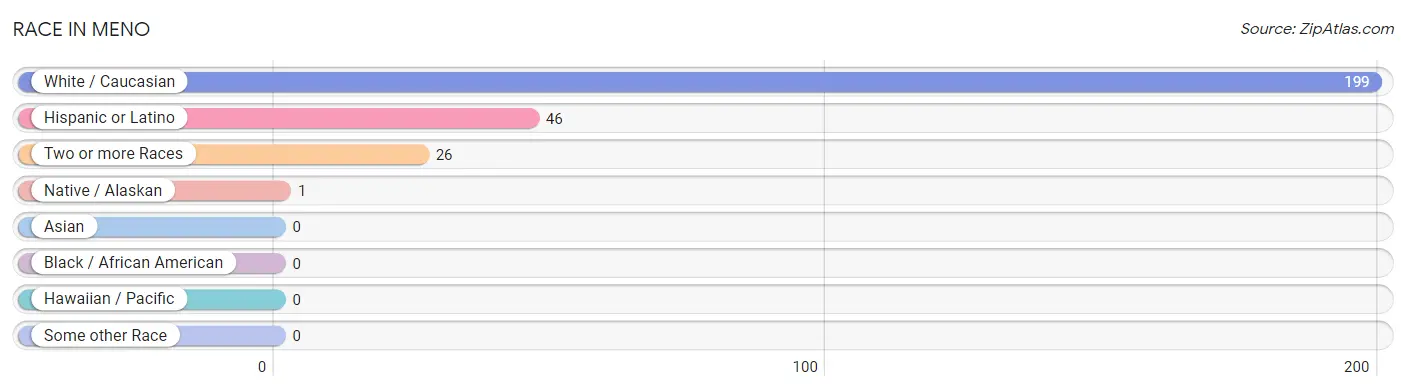
| Race | # Population | % Population |
| Asian | 0 | 0.0% |
| Black / African American | 0 | 0.0% |
| Hawaiian / Pacific | 0 | 0.0% |
| Hispanic or Latino | 46 | 20.3% |
| Native / Alaskan | 1 | 0.4% |
| White / Caucasian | 199 | 88.0% |
| Two or more Races | 26 | 11.5% |
| Some other Race | 0 | 0.0% |
| Total | 226 | 100.0% |
Ancestry in Meno
The most populous ancestries reported in Meno are German (56 | 24.8%), Mexican (46 | 20.3%), Dutch (14 | 6.2%), English (6 | 2.6%), and Irish (5 | 2.2%), together accounting for 56.2% of all Meno residents.
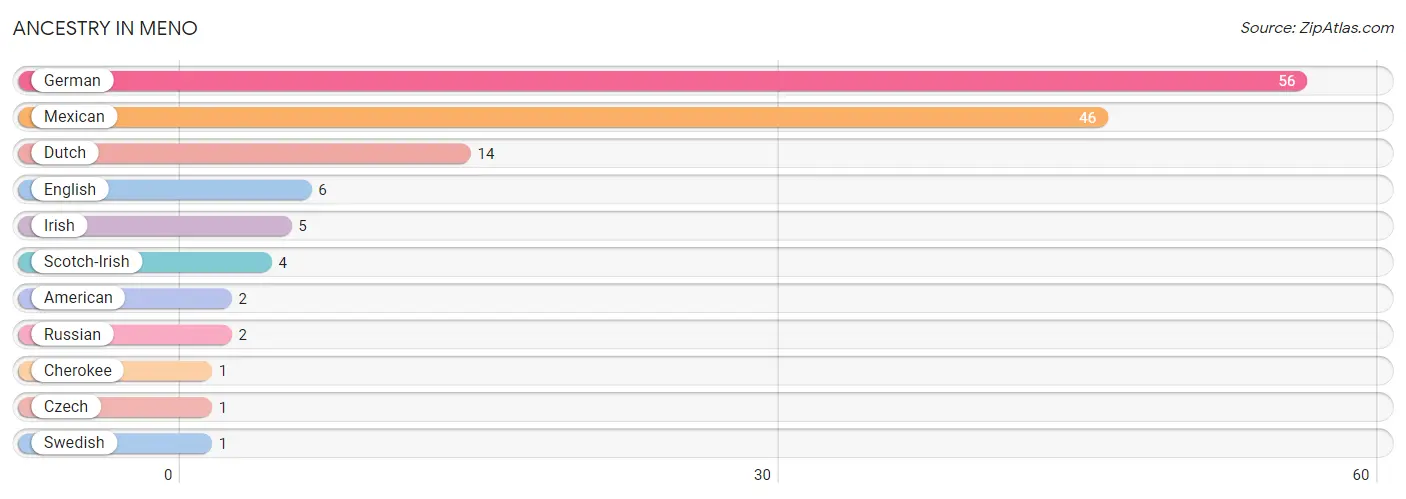
| Ancestry | # Population | % Population |
| American | 2 | 0.9% |
| Cherokee | 1 | 0.4% |
| Czech | 1 | 0.4% |
| Dutch | 14 | 6.2% |
| English | 6 | 2.6% |
| German | 56 | 24.8% |
| Irish | 5 | 2.2% |
| Mexican | 46 | 20.3% |
| Russian | 2 | 0.9% |
| Scotch-Irish | 4 | 1.8% |
| Swedish | 1 | 0.4% | View All 11 Rows |
Immigrants in Meno
The most numerous immigrant groups reported in Meno came from Central America (9 | 4.0%), Latin America (9 | 4.0%), and Mexico (9 | 4.0%), together accounting for 11.9% of all Meno residents.
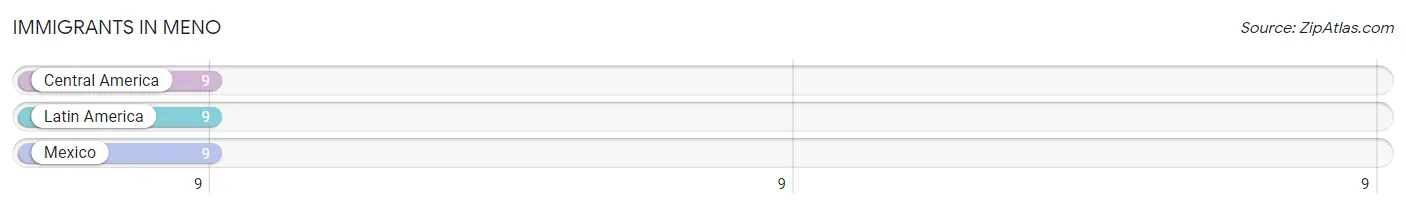
| Immigration Origin | # Population | % Population |
| Central America | 9 | 4.0% |
| Latin America | 9 | 4.0% |
| Mexico | 9 | 4.0% | View All 3 Rows |
Sex and Age in Meno
Sex and Age in Meno
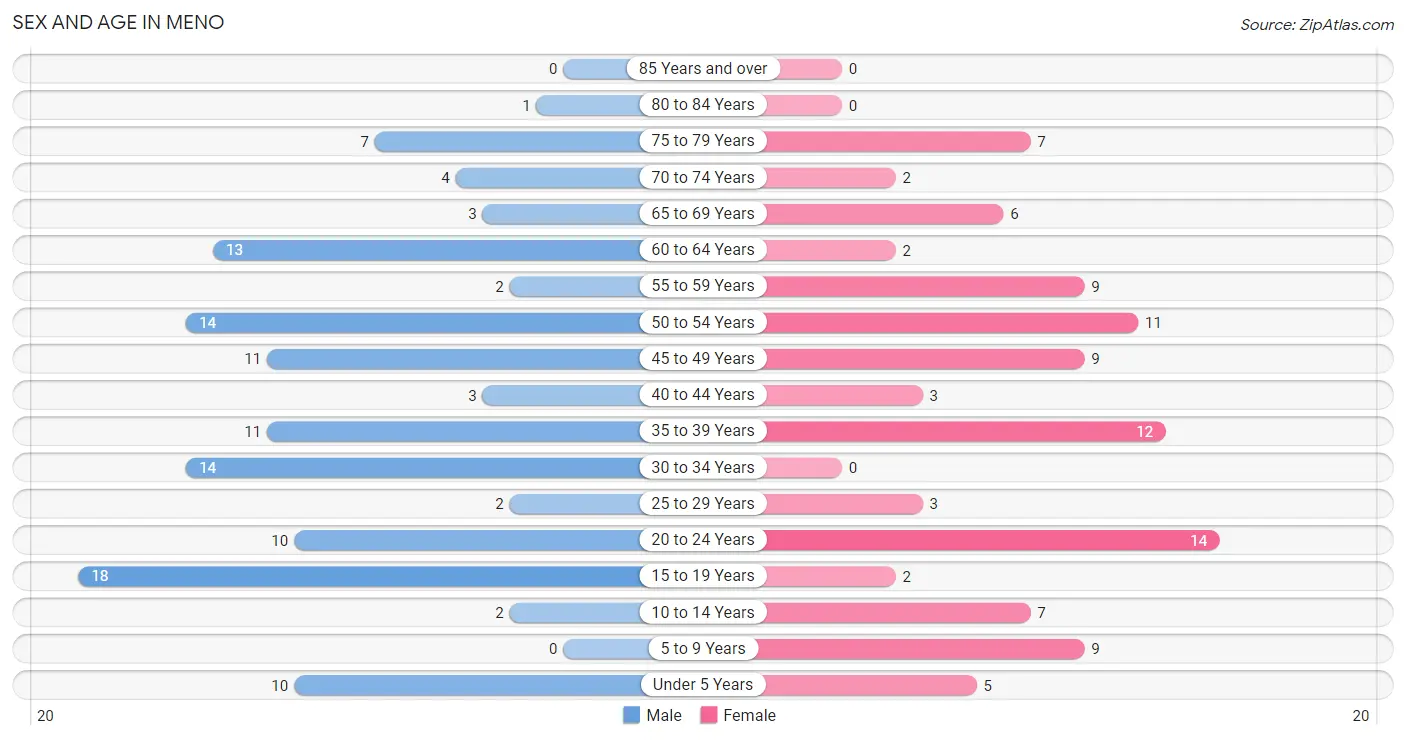
The most populous age groups in Meno are 15 to 19 Years (18 | 14.4%) for men and 20 to 24 Years (14 | 13.9%) for women.
| Age Bracket | Male | Female |
| Under 5 Years | 10 (8.0%) | 5 (5.0%) |
| 5 to 9 Years | 0 (0.0%) | 9 (8.9%) |
| 10 to 14 Years | 2 (1.6%) | 7 (6.9%) |
| 15 to 19 Years | 18 (14.4%) | 2 (2.0%) |
| 20 to 24 Years | 10 (8.0%) | 14 (13.9%) |
| 25 to 29 Years | 2 (1.6%) | 3 (3.0%) |
| 30 to 34 Years | 14 (11.2%) | 0 (0.0%) |
| 35 to 39 Years | 11 (8.8%) | 12 (11.9%) |
| 40 to 44 Years | 3 (2.4%) | 3 (3.0%) |
| 45 to 49 Years | 11 (8.8%) | 9 (8.9%) |
| 50 to 54 Years | 14 (11.2%) | 11 (10.9%) |
| 55 to 59 Years | 2 (1.6%) | 9 (8.9%) |
| 60 to 64 Years | 13 (10.4%) | 2 (2.0%) |
| 65 to 69 Years | 3 (2.4%) | 6 (5.9%) |
| 70 to 74 Years | 4 (3.2%) | 2 (2.0%) |
| 75 to 79 Years | 7 (5.6%) | 7 (6.9%) |
| 80 to 84 Years | 1 (0.8%) | 0 (0.0%) |
| 85 Years and over | 0 (0.0%) | 0 (0.0%) |
| Total | 125 (100.0%) | 101 (100.0%) |
Families and Households in Meno
Median Family Size in Meno
The median family size in Meno is 2.63 persons per family, with married-couple families (52 | 73.2%) accounting for the largest median family size of 2.79 persons per family. On the other hand, single male/father families (6 | 8.5%) represent the smallest median family size with 1.33 persons per family.
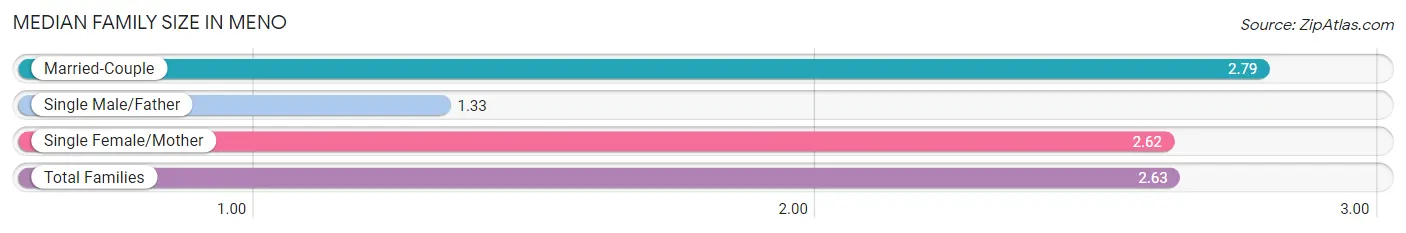
| Family Type | # Families | Family Size |
| Married-Couple | 52 (73.2%) | 2.79 |
| Single Male/Father | 6 (8.5%) | 1.33 |
| Single Female/Mother | 13 (18.3%) | 2.62 |
| Total Families | 71 (100.0%) | 2.63 |
Median Household Size in Meno
The median household size in Meno is 2.31 persons per household, with single female/mother households (13 | 13.3%) accounting for the largest median household size of 3.38 persons per household. non-family households (27 | 27.6%) represent the smallest median household size with 1.07 persons per household.
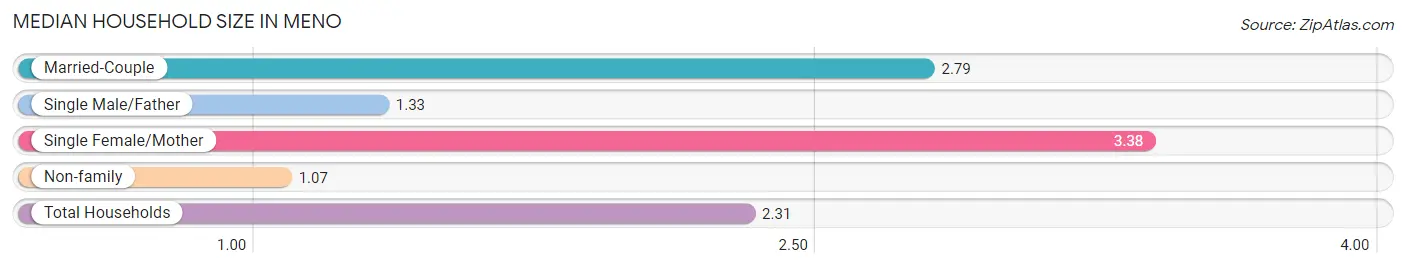
| Household Type | # Households | Household Size |
| Married-Couple | 52 (53.1%) | 2.79 |
| Single Male/Father | 6 (6.1%) | 1.33 |
| Single Female/Mother | 13 (13.3%) | 3.38 |
| Non-family | 27 (27.6%) | 1.07 |
| Total Households | 98 (100.0%) | 2.31 |
Household Size by Marriage Status in Meno
Out of a total of 98 households in Meno, 71 (72.5%) are family households, while 27 (27.6%) are nonfamily households. The most numerous type of family households are 2-person households, comprising 37, and the most common type of nonfamily households are 1-person households, comprising 25.
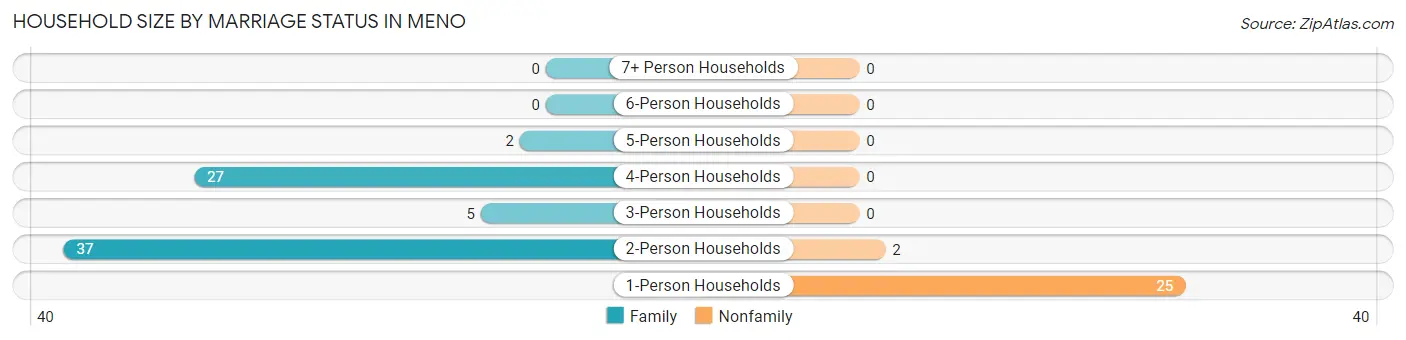
| Household Size | Family Households | Nonfamily Households |
| 1-Person Households | - | 25 (25.5%) |
| 2-Person Households | 37 (37.8%) | 2 (2.0%) |
| 3-Person Households | 5 (5.1%) | 0 (0.0%) |
| 4-Person Households | 27 (27.6%) | 0 (0.0%) |
| 5-Person Households | 2 (2.0%) | 0 (0.0%) |
| 6-Person Households | 0 (0.0%) | 0 (0.0%) |
| 7+ Person Households | 0 (0.0%) | 0 (0.0%) |
| Total | 71 (72.5%) | 27 (27.6%) |
Female Fertility in Meno
Fertility by Age in Meno
Average fertility rate in Meno is 273.0 births per 1,000 women. Women in the age bracket of 20 to 34 years have the highest fertility rate with 706.0 births per 1,000 women. Women in the age bracket of 20 to 34 years acount for 100.0% of all women with births.
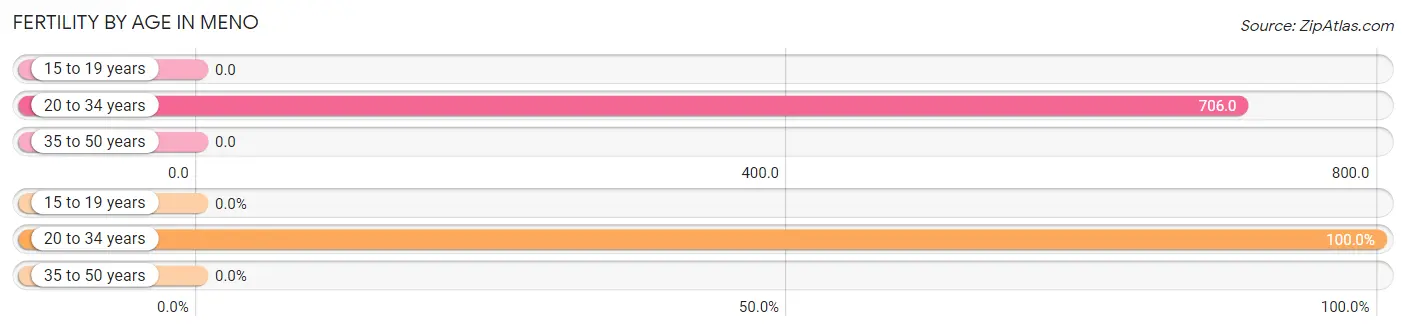
| Age Bracket | Women with Births | Births / 1,000 Women |
| 15 to 19 years | 0 (0.0%) | 0.0 |
| 20 to 34 years | 12 (100.0%) | 706.0 |
| 35 to 50 years | 0 (0.0%) | 0.0 |
| Total | 12 (100.0%) | 273.0 |
Fertility by Age by Marriage Status in Meno
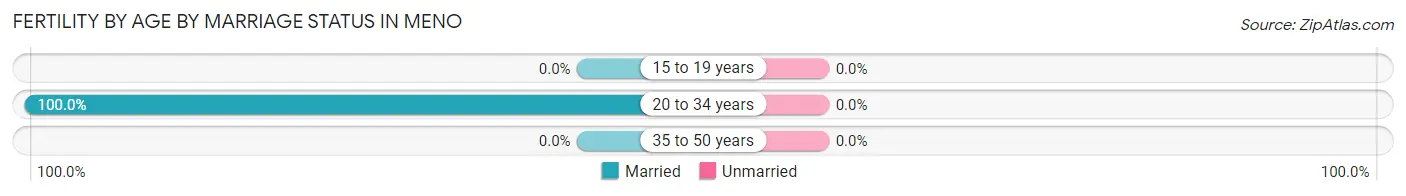
| Age Bracket | Married | Unmarried |
| 15 to 19 years | 0 (0.0%) | 0 (0.0%) |
| 20 to 34 years | 12 (100.0%) | 0 (0.0%) |
| 35 to 50 years | 0 (0.0%) | 0 (0.0%) |
| Total | 12 (100.0%) | 0 (0.0%) |
Fertility by Education in Meno
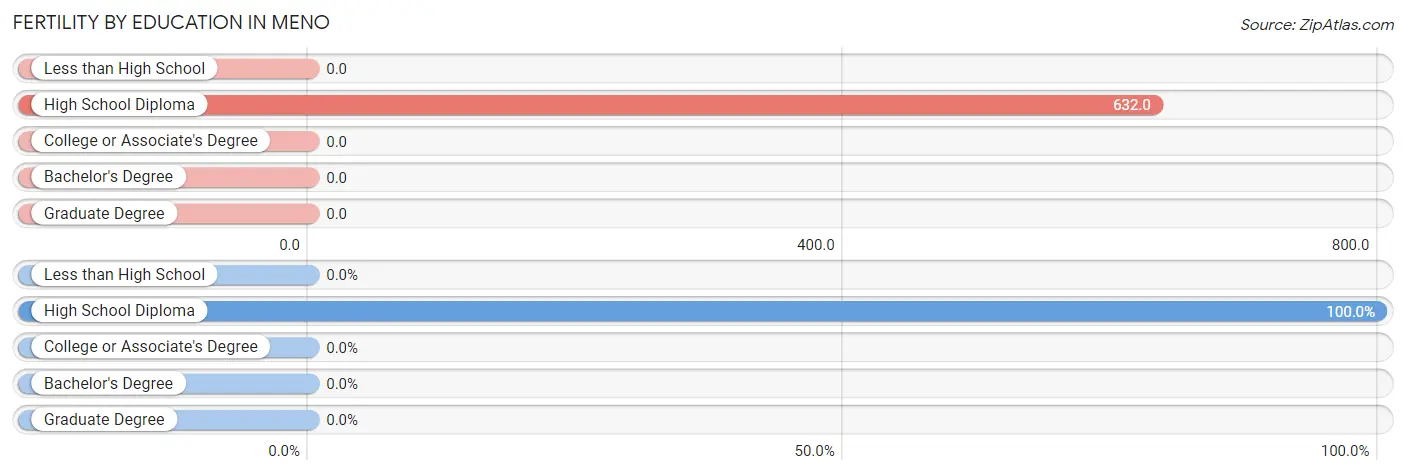
| Educational Attainment | Women with Births | Births / 1,000 Women |
| Less than High School | 0 (0.0%) | 0.0 |
| High School Diploma | 12 (100.0%) | 632.0 |
| College or Associate's Degree | 0 (0.0%) | 0.0 |
| Bachelor's Degree | 0 (0.0%) | 0.0 |
| Graduate Degree | 0 (0.0%) | 0.0 |
| Total | 12 (100.0%) | 273.0 |
Fertility by Education by Marriage Status in Meno
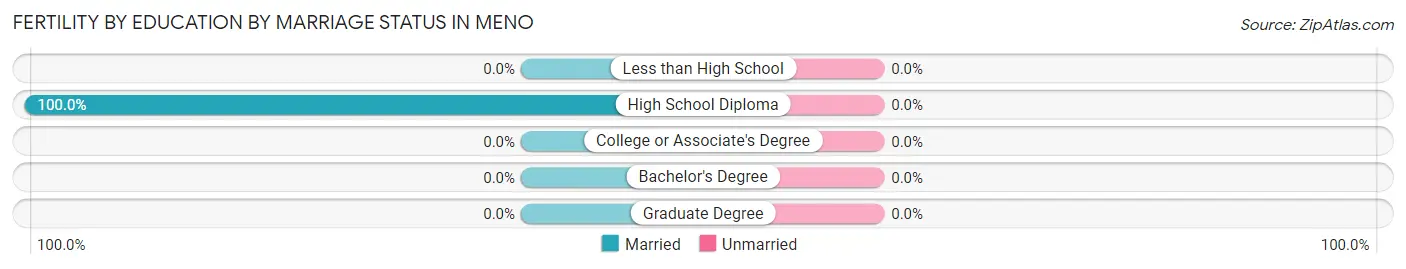
| Educational Attainment | Married | Unmarried |
| Less than High School | 0 (0.0%) | 0 (0.0%) |
| High School Diploma | 12 (100.0%) | 0 (0.0%) |
| College or Associate's Degree | 0 (0.0%) | 0 (0.0%) |
| Bachelor's Degree | 0 (0.0%) | 0 (0.0%) |
| Graduate Degree | 0 (0.0%) | 0 (0.0%) |
| Total | 12 (100.0%) | 0 (0.0%) |
Employment Characteristics in Meno
Employment by Class of Employer in Meno
Among the 143 employed individuals in Meno, private company employees (108 | 75.5%), self-employed (not incorporated) (12 | 8.4%), and local government employees (7 | 4.9%) make up the most common classes of employment.
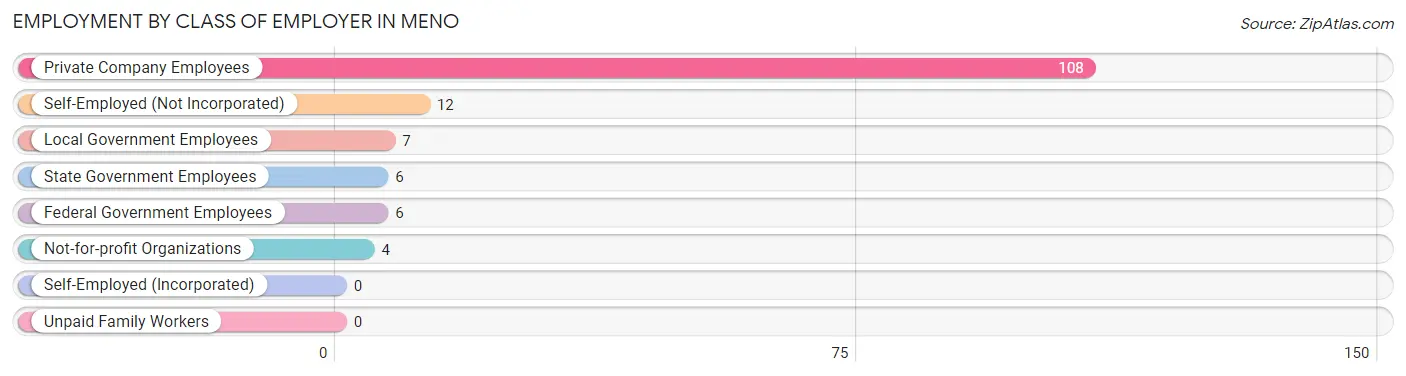
| Employer Class | # Employees | % Employees |
| Private Company Employees | 108 | 75.5% |
| Self-Employed (Incorporated) | 0 | 0.0% |
| Self-Employed (Not Incorporated) | 12 | 8.4% |
| Not-for-profit Organizations | 4 | 2.8% |
| Local Government Employees | 7 | 4.9% |
| State Government Employees | 6 | 4.2% |
| Federal Government Employees | 6 | 4.2% |
| Unpaid Family Workers | 0 | 0.0% |
| Total | 143 | 100.0% |
Employment Status by Age in Meno
According to the labor force statistics for Meno, out of the total population over 16 years of age (193), 74.6% or 144 individuals are in the labor force, with 0.7% or 1 of them unemployed. The age group with the highest labor force participation rate is 25 to 29 years, with 100.0% or 5 individuals in the labor force. Within the labor force, the 25 to 29 years age range has the highest percentage of unemployed individuals, with 20.0% or 1 of them being unemployed.
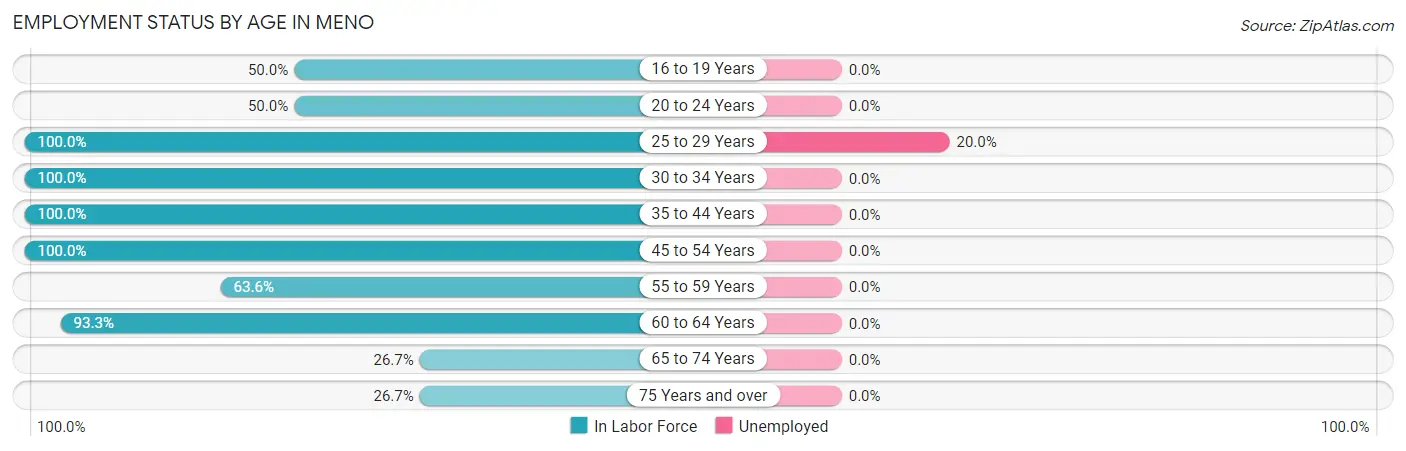
| Age Bracket | In Labor Force | Unemployed |
| 16 to 19 Years | 10 (50.0%) | 0 (0.0%) |
| 20 to 24 Years | 12 (50.0%) | 0 (0.0%) |
| 25 to 29 Years | 5 (100.0%) | 1 (20.0%) |
| 30 to 34 Years | 14 (100.0%) | 0 (0.0%) |
| 35 to 44 Years | 29 (100.0%) | 0 (0.0%) |
| 45 to 54 Years | 45 (100.0%) | 0 (0.0%) |
| 55 to 59 Years | 7 (63.6%) | 0 (0.0%) |
| 60 to 64 Years | 14 (93.3%) | 0 (0.0%) |
| 65 to 74 Years | 4 (26.7%) | 0 (0.0%) |
| 75 Years and over | 4 (26.7%) | 0 (0.0%) |
| Total | 144 (74.6%) | 1 (0.7%) |
Employment Status by Educational Attainment in Meno
According to labor force statistics for Meno, 95.8% of individuals (114) out of the total population between 25 and 64 years of age (119) are in the labor force, with 0.9% or 1 of them being unemployed. The group with the highest labor force participation rate are those with the educational attainment of less than high school, with 100.0% or 17 individuals in the labor force. Within the labor force, individuals with high school diploma education have the highest percentage of unemployment, with 2.6% or 1 of them being unemployed.
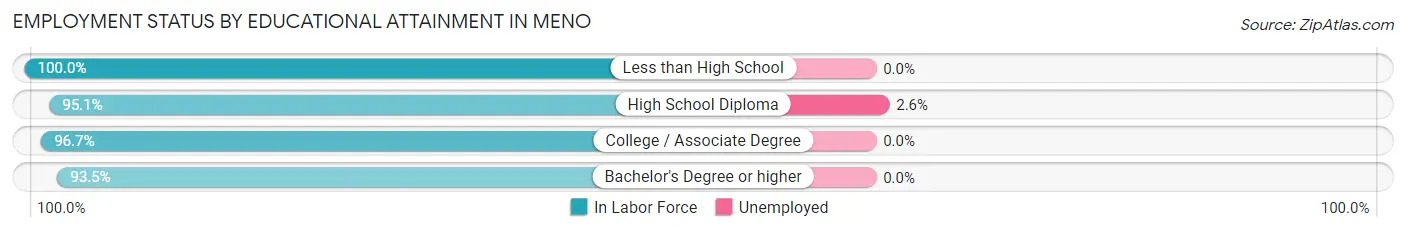
| Educational Attainment | In Labor Force | Unemployed |
| Less than High School | 17 (100.0%) | 0 (0.0%) |
| High School Diploma | 39 (95.1%) | 1 (2.6%) |
| College / Associate Degree | 29 (96.7%) | 0 (0.0%) |
| Bachelor's Degree or higher | 29 (93.5%) | 0 (0.0%) |
| Total | 114 (95.8%) | 1 (0.9%) |
Employment Occupations by Sex in Meno
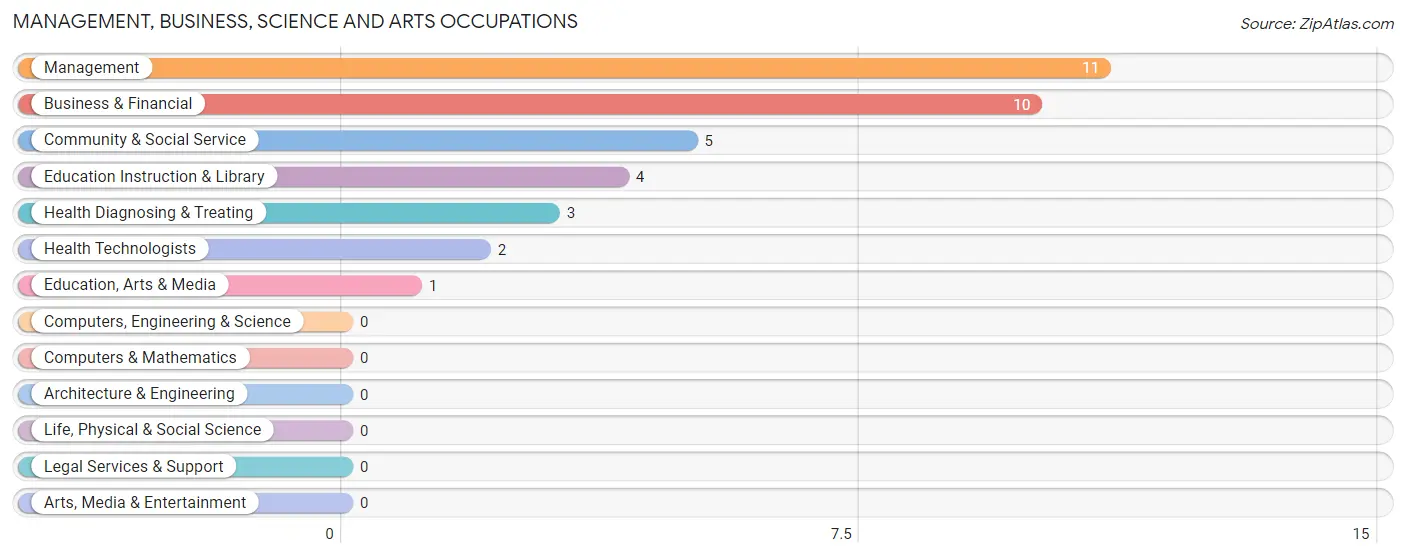
Management, Business, Science and Arts Occupations
The most common Management, Business, Science and Arts occupations in Meno are Management (11 | 7.7%), Business & Financial (10 | 7.0%), Community & Social Service (5 | 3.5%), Education Instruction & Library (4 | 2.8%), and Health Diagnosing & Treating (3 | 2.1%).
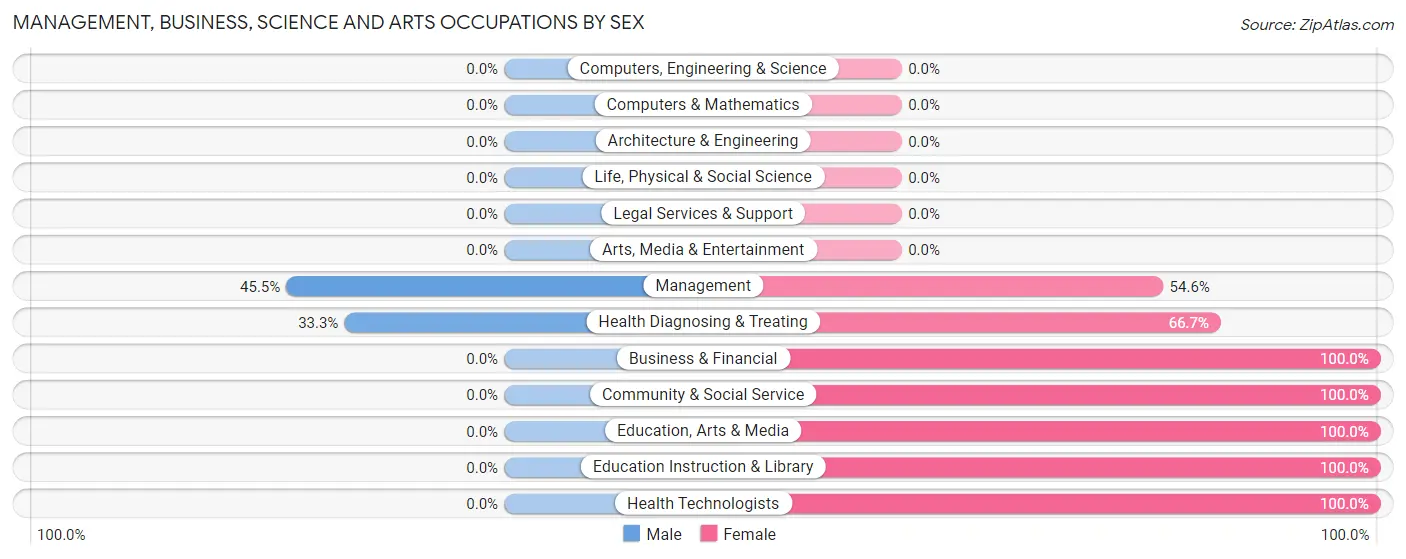
Management, Business, Science and Arts Occupations by Sex
Within the Management, Business, Science and Arts occupations in Meno, the most male-oriented occupations are Management (45.5%), and Health Diagnosing & Treating (33.3%), while the most female-oriented occupations are Business & Financial (100.0%), Community & Social Service (100.0%), and Education, Arts & Media (100.0%).
| Occupation | Male | Female |
| Management | 5 (45.5%) | 6 (54.5%) |
| Business & Financial | 0 (0.0%) | 10 (100.0%) |
| Computers, Engineering & Science | 0 (0.0%) | 0 (0.0%) |
| Computers & Mathematics | 0 (0.0%) | 0 (0.0%) |
| Architecture & Engineering | 0 (0.0%) | 0 (0.0%) |
| Life, Physical & Social Science | 0 (0.0%) | 0 (0.0%) |
| Community & Social Service | 0 (0.0%) | 5 (100.0%) |
| Education, Arts & Media | 0 (0.0%) | 1 (100.0%) |
| Legal Services & Support | 0 (0.0%) | 0 (0.0%) |
| Education Instruction & Library | 0 (0.0%) | 4 (100.0%) |
| Arts, Media & Entertainment | 0 (0.0%) | 0 (0.0%) |
| Health Diagnosing & Treating | 1 (33.3%) | 2 (66.7%) |
| Health Technologists | 0 (0.0%) | 2 (100.0%) |
| Total (Category) | 6 (20.7%) | 23 (79.3%) |
| Total (Overall) | 90 (62.9%) | 53 (37.1%) |
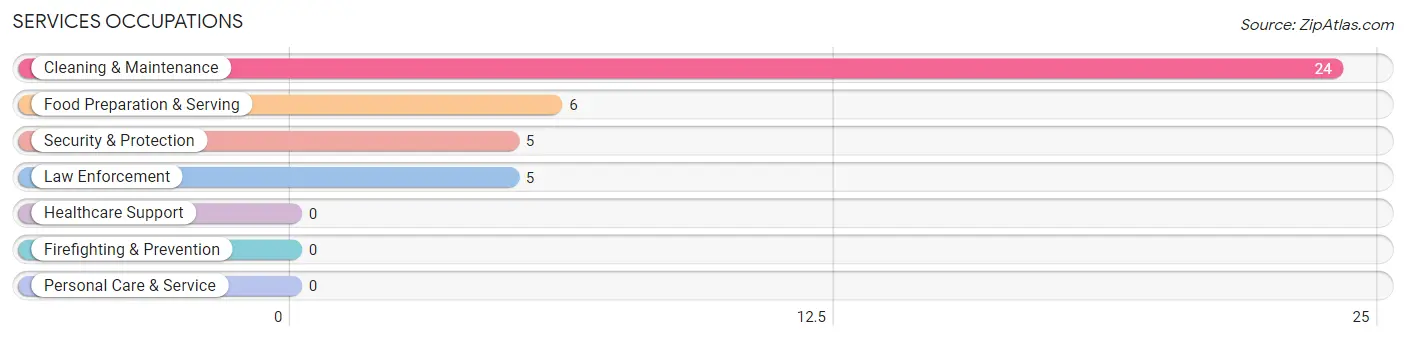
Services Occupations
The most common Services occupations in Meno are Cleaning & Maintenance (24 | 16.8%), Food Preparation & Serving (6 | 4.2%), Security & Protection (5 | 3.5%), and Law Enforcement (5 | 3.5%).
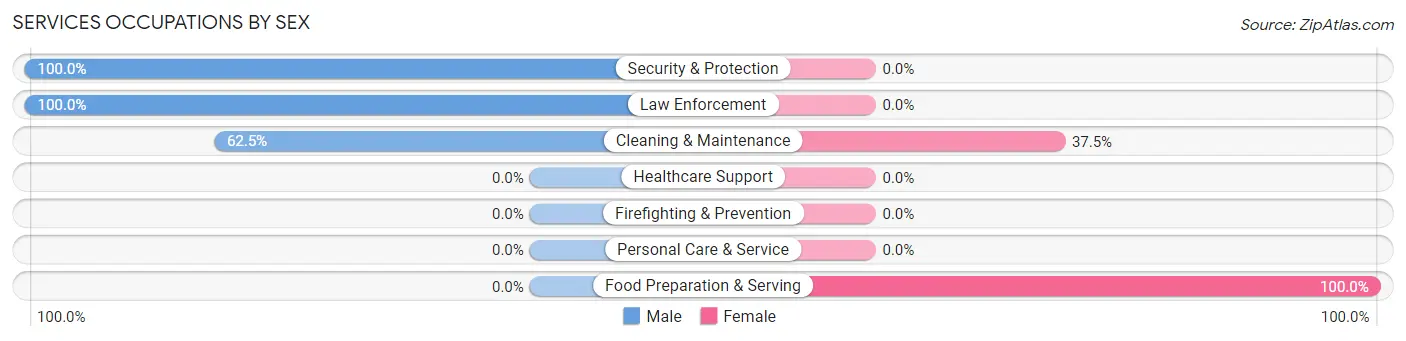
Services Occupations by Sex
Within the Services occupations in Meno, the most male-oriented occupations are Security & Protection (100.0%), Law Enforcement (100.0%), and Cleaning & Maintenance (62.5%), while the most female-oriented occupations are Food Preparation & Serving (100.0%), and Cleaning & Maintenance (37.5%).
| Occupation | Male | Female |
| Healthcare Support | 0 (0.0%) | 0 (0.0%) |
| Security & Protection | 5 (100.0%) | 0 (0.0%) |
| Firefighting & Prevention | 0 (0.0%) | 0 (0.0%) |
| Law Enforcement | 5 (100.0%) | 0 (0.0%) |
| Food Preparation & Serving | 0 (0.0%) | 6 (100.0%) |
| Cleaning & Maintenance | 15 (62.5%) | 9 (37.5%) |
| Personal Care & Service | 0 (0.0%) | 0 (0.0%) |
| Total (Category) | 20 (57.1%) | 15 (42.9%) |
| Total (Overall) | 90 (62.9%) | 53 (37.1%) |
Sales and Office Occupations
The most common Sales and Office occupations in Meno are Sales & Related (15 | 10.5%), and Office & Administration (4 | 2.8%).
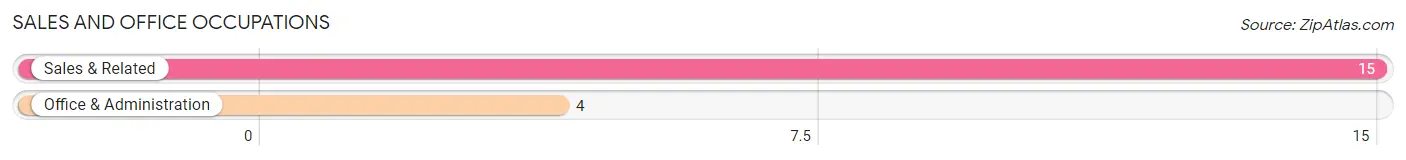
Sales and Office Occupations by Sex

| Occupation | Male | Female |
| Sales & Related | 4 (26.7%) | 11 (73.3%) |
| Office & Administration | 0 (0.0%) | 4 (100.0%) |
| Total (Category) | 4 (21.0%) | 15 (78.9%) |
| Total (Overall) | 90 (62.9%) | 53 (37.1%) |
Natural Resources, Construction and Maintenance Occupations
The most common Natural Resources, Construction and Maintenance occupations in Meno are Installation, Maintenance & Repair (14 | 9.8%), Construction & Extraction (12 | 8.4%), and Farming, Fishing & Forestry (1 | 0.7%).
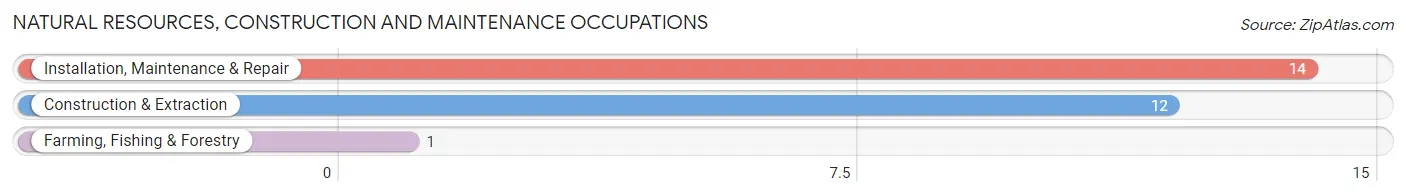
Natural Resources, Construction and Maintenance Occupations by Sex
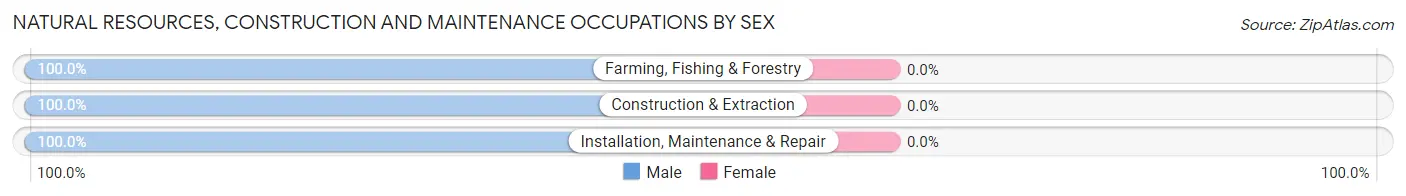
| Occupation | Male | Female |
| Farming, Fishing & Forestry | 1 (100.0%) | 0 (0.0%) |
| Construction & Extraction | 12 (100.0%) | 0 (0.0%) |
| Installation, Maintenance & Repair | 14 (100.0%) | 0 (0.0%) |
| Total (Category) | 27 (100.0%) | 0 (0.0%) |
| Total (Overall) | 90 (62.9%) | 53 (37.1%) |
Production, Transportation and Moving Occupations
The most common Production, Transportation and Moving occupations in Meno are Transportation (17 | 11.9%), Production (12 | 8.4%), and Material Moving (4 | 2.8%).
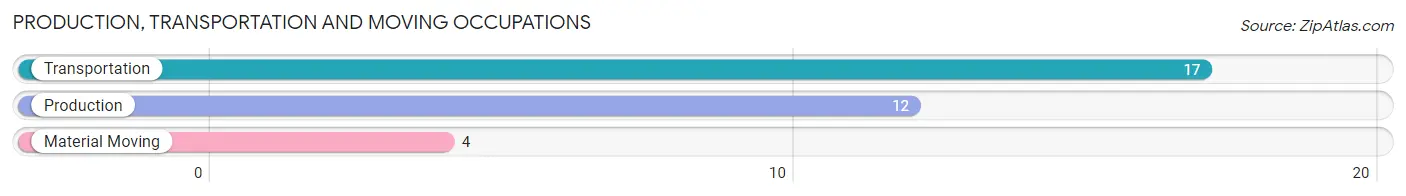
Production, Transportation and Moving Occupations by Sex
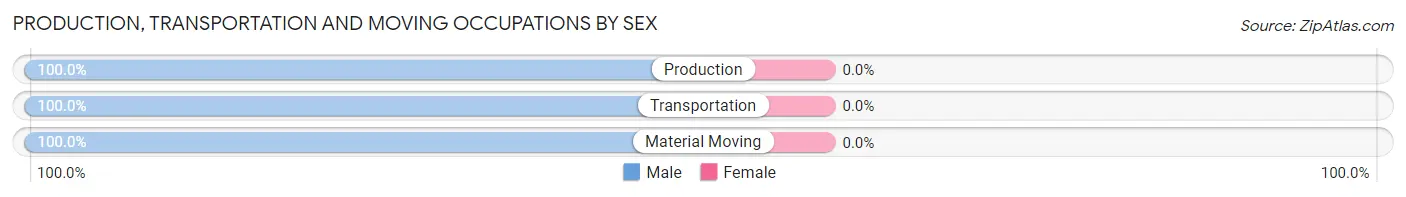
| Occupation | Male | Female |
| Production | 12 (100.0%) | 0 (0.0%) |
| Transportation | 17 (100.0%) | 0 (0.0%) |
| Material Moving | 4 (100.0%) | 0 (0.0%) |
| Total (Category) | 33 (100.0%) | 0 (0.0%) |
| Total (Overall) | 90 (62.9%) | 53 (37.1%) |
Employment Industries by Sex in Meno
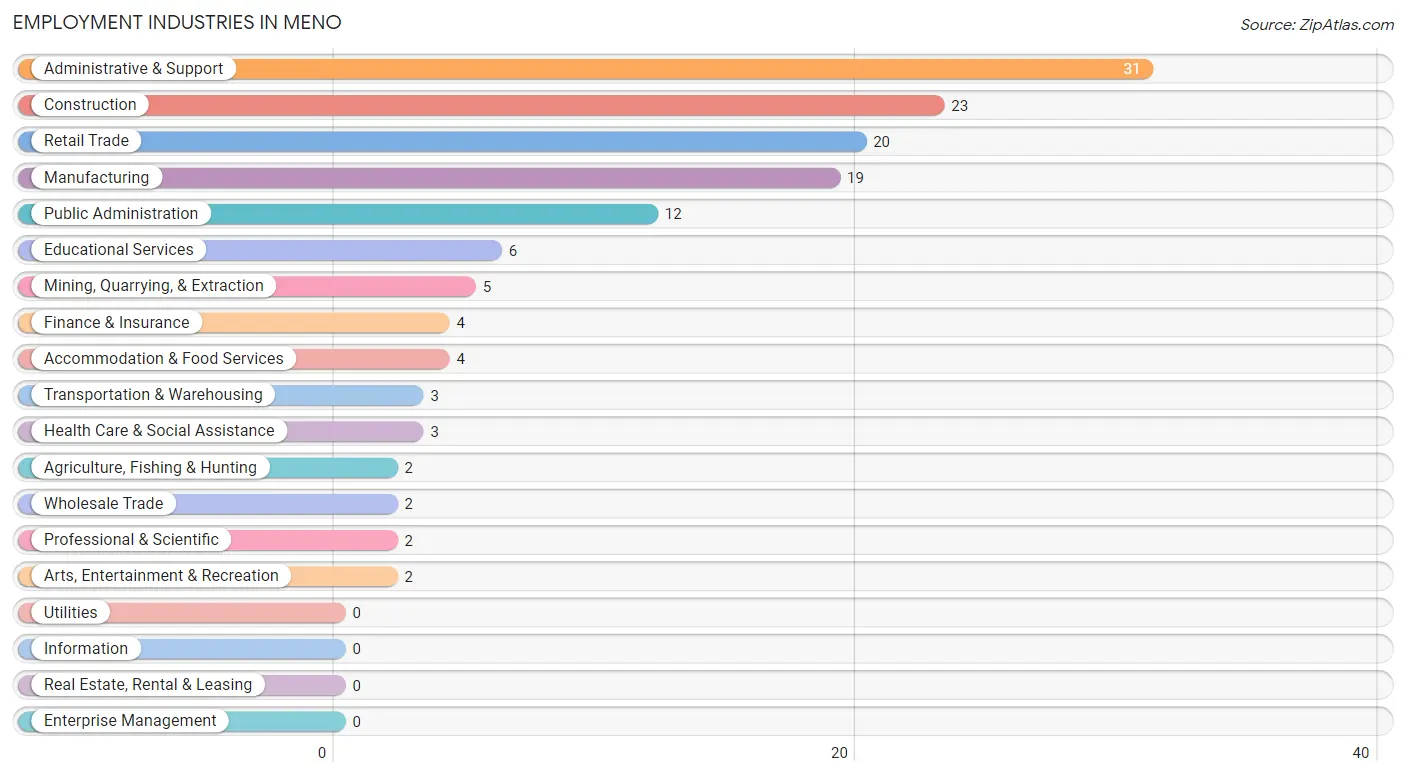
Employment Industries in Meno
The major employment industries in Meno include Administrative & Support (31 | 21.7%), Construction (23 | 16.1%), Retail Trade (20 | 14.0%), Manufacturing (19 | 13.3%), and Public Administration (12 | 8.4%).
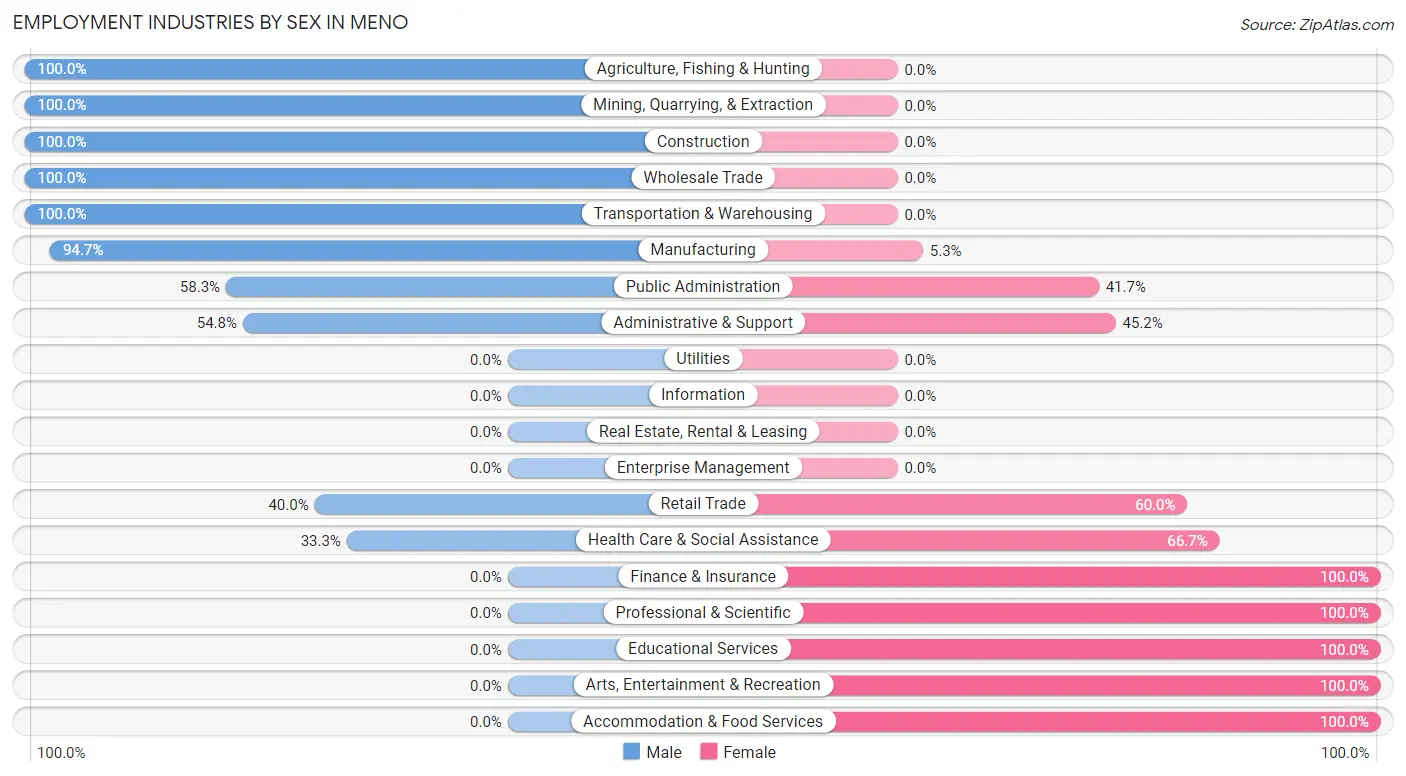
Employment Industries by Sex in Meno
The Meno industries that see more men than women are Agriculture, Fishing & Hunting (100.0%), Mining, Quarrying, & Extraction (100.0%), and Construction (100.0%), whereas the industries that tend to have a higher number of women are Finance & Insurance (100.0%), Professional & Scientific (100.0%), and Educational Services (100.0%).
| Industry | Male | Female |
| Agriculture, Fishing & Hunting | 2 (100.0%) | 0 (0.0%) |
| Mining, Quarrying, & Extraction | 5 (100.0%) | 0 (0.0%) |
| Construction | 23 (100.0%) | 0 (0.0%) |
| Manufacturing | 18 (94.7%) | 1 (5.3%) |
| Wholesale Trade | 2 (100.0%) | 0 (0.0%) |
| Retail Trade | 8 (40.0%) | 12 (60.0%) |
| Transportation & Warehousing | 3 (100.0%) | 0 (0.0%) |
| Utilities | 0 (0.0%) | 0 (0.0%) |
| Information | 0 (0.0%) | 0 (0.0%) |
| Finance & Insurance | 0 (0.0%) | 4 (100.0%) |
| Real Estate, Rental & Leasing | 0 (0.0%) | 0 (0.0%) |
| Professional & Scientific | 0 (0.0%) | 2 (100.0%) |
| Enterprise Management | 0 (0.0%) | 0 (0.0%) |
| Administrative & Support | 17 (54.8%) | 14 (45.2%) |
| Educational Services | 0 (0.0%) | 6 (100.0%) |
| Health Care & Social Assistance | 1 (33.3%) | 2 (66.7%) |
| Arts, Entertainment & Recreation | 0 (0.0%) | 2 (100.0%) |
| Accommodation & Food Services | 0 (0.0%) | 4 (100.0%) |
| Public Administration | 7 (58.3%) | 5 (41.7%) |
| Total | 90 (62.9%) | 53 (37.1%) |
Education in Meno
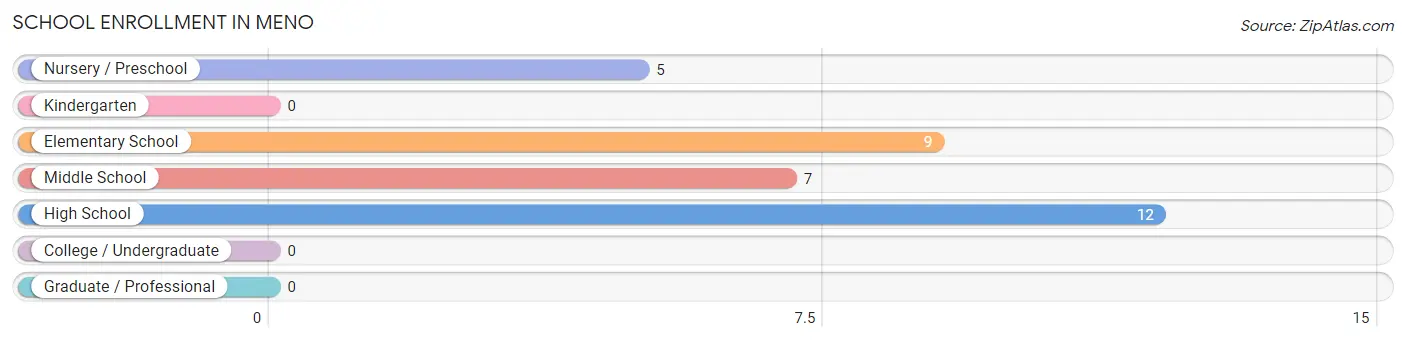
School Enrollment in Meno
The most common levels of schooling among the 33 students in Meno are high school (12 | 36.4%), elementary school (9 | 27.3%), and middle school (7 | 21.2%).
| School Level | # Students | % Students |
| Nursery / Preschool | 5 | 15.1% |
| Kindergarten | 0 | 0.0% |
| Elementary School | 9 | 27.3% |
| Middle School | 7 | 21.2% |
| High School | 12 | 36.4% |
| College / Undergraduate | 0 | 0.0% |
| Graduate / Professional | 0 | 0.0% |
| Total | 33 | 100.0% |
School Enrollment by Age by Funding Source in Meno
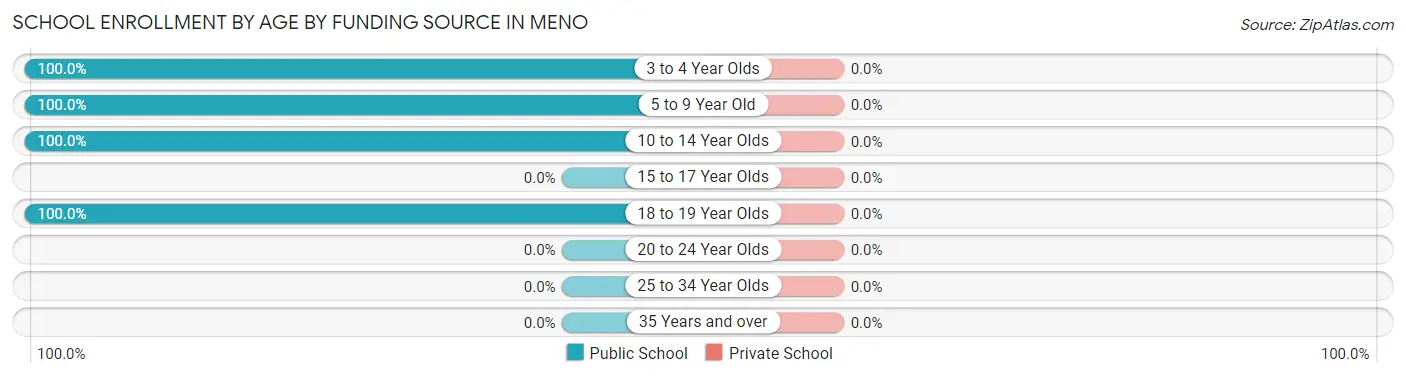
| Age Bracket | Public School | Private School |
| 3 to 4 Year Olds | 5 (100.0%) | 0 (0.0%) |
| 5 to 9 Year Old | 9 (100.0%) | 0 (0.0%) |
| 10 to 14 Year Olds | 9 (100.0%) | 0 (0.0%) |
| 15 to 17 Year Olds | 0 (0.0%) | 0 (0.0%) |
| 18 to 19 Year Olds | 10 (100.0%) | 0 (0.0%) |
| 20 to 24 Year Olds | 0 (0.0%) | 0 (0.0%) |
| 25 to 34 Year Olds | 0 (0.0%) | 0 (0.0%) |
| 35 Years and over | 0 (0.0%) | 0 (0.0%) |
| Total | 33 (100.0%) | 0 (0.0%) |
Educational Attainment by Field of Study in Meno
Science & technology (9 | 25.0%), business (8 | 22.2%), education (7 | 19.4%), arts & humanities (5 | 13.9%), and visual & performing arts (4 | 11.1%) are the most common fields of study among 36 individuals in Meno who have obtained a bachelor's degree or higher.
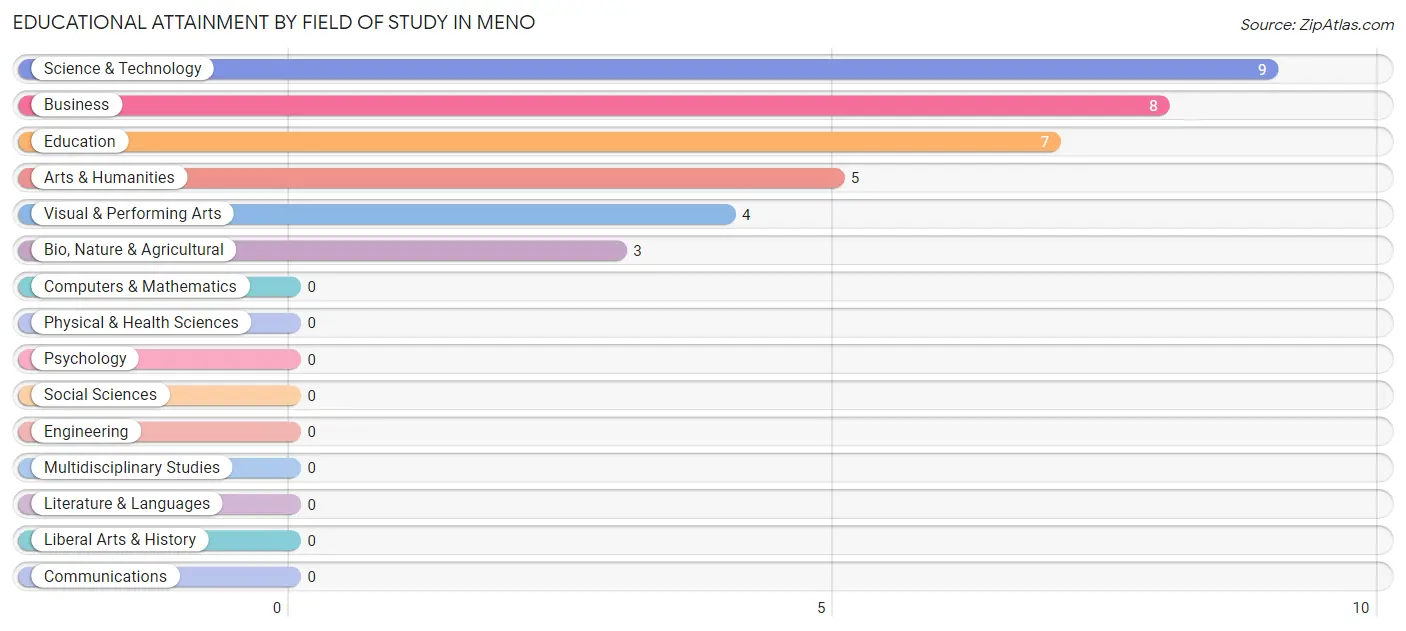
| Field of Study | # Graduates | % Graduates |
| Computers & Mathematics | 0 | 0.0% |
| Bio, Nature & Agricultural | 3 | 8.3% |
| Physical & Health Sciences | 0 | 0.0% |
| Psychology | 0 | 0.0% |
| Social Sciences | 0 | 0.0% |
| Engineering | 0 | 0.0% |
| Multidisciplinary Studies | 0 | 0.0% |
| Science & Technology | 9 | 25.0% |
| Business | 8 | 22.2% |
| Education | 7 | 19.4% |
| Literature & Languages | 0 | 0.0% |
| Liberal Arts & History | 0 | 0.0% |
| Visual & Performing Arts | 4 | 11.1% |
| Communications | 0 | 0.0% |
| Arts & Humanities | 5 | 13.9% |
| Total | 36 | 100.0% |
Transportation & Commute in Meno
Vehicle Availability by Sex in Meno
The most prevalent vehicle ownership categories in Meno are males with 2 vehicles (41, accounting for 45.6%) and females with 2 vehicles (23, making up 77.4%).
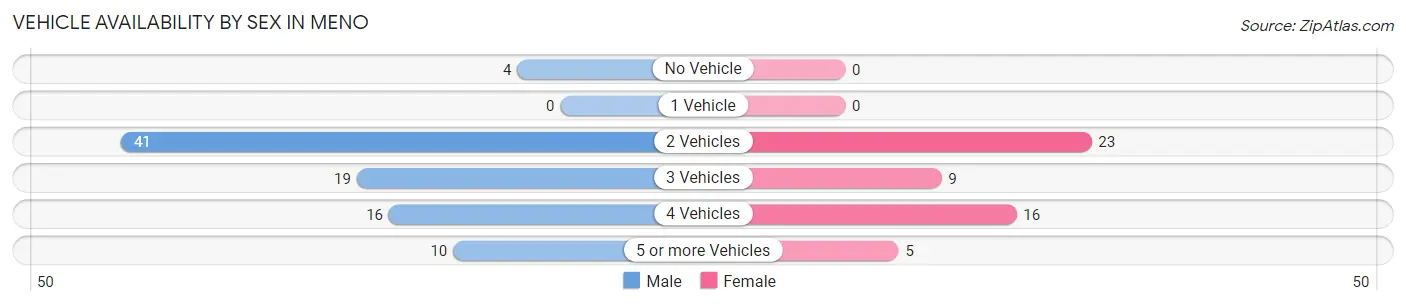
| Vehicles Available | Male | Female |
| No Vehicle | 4 (4.4%) | 0 (0.0%) |
| 1 Vehicle | 0 (0.0%) | 0 (0.0%) |
| 2 Vehicles | 41 (45.6%) | 23 (43.4%) |
| 3 Vehicles | 19 (21.1%) | 9 (17.0%) |
| 4 Vehicles | 16 (17.8%) | 16 (30.2%) |
| 5 or more Vehicles | 10 (11.1%) | 5 (9.4%) |
| Total | 90 (100.0%) | 53 (100.0%) |
Commute Time in Meno
The most frequently occuring commute durations in Meno are 25 to 29 minutes (30 commuters, 21.3%), 30 to 34 minutes (21 commuters, 14.9%), and 45 to 59 minutes (20 commuters, 14.2%).
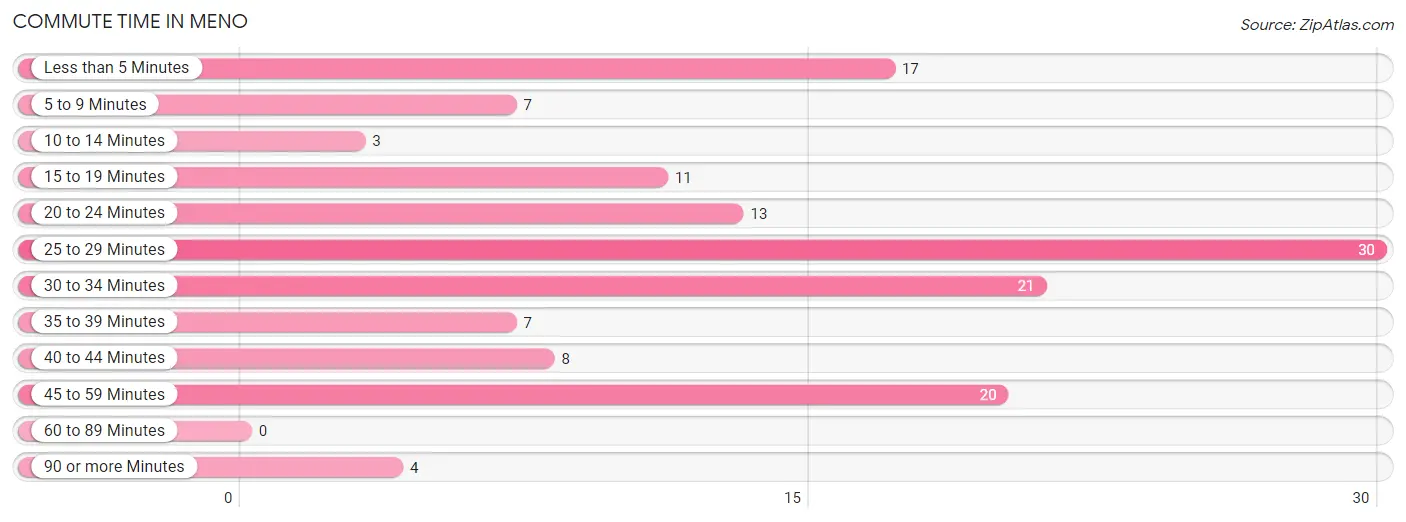
| Commute Time | # Commuters | % Commuters |
| Less than 5 Minutes | 17 | 12.1% |
| 5 to 9 Minutes | 7 | 5.0% |
| 10 to 14 Minutes | 3 | 2.1% |
| 15 to 19 Minutes | 11 | 7.8% |
| 20 to 24 Minutes | 13 | 9.2% |
| 25 to 29 Minutes | 30 | 21.3% |
| 30 to 34 Minutes | 21 | 14.9% |
| 35 to 39 Minutes | 7 | 5.0% |
| 40 to 44 Minutes | 8 | 5.7% |
| 45 to 59 Minutes | 20 | 14.2% |
| 60 to 89 Minutes | 0 | 0.0% |
| 90 or more Minutes | 4 | 2.8% |
Commute Time by Sex in Meno
The most common commute times in Meno are 45 to 59 minutes (19 commuters, 21.6%) for males and 25 to 29 minutes (20 commuters, 37.7%) for females.
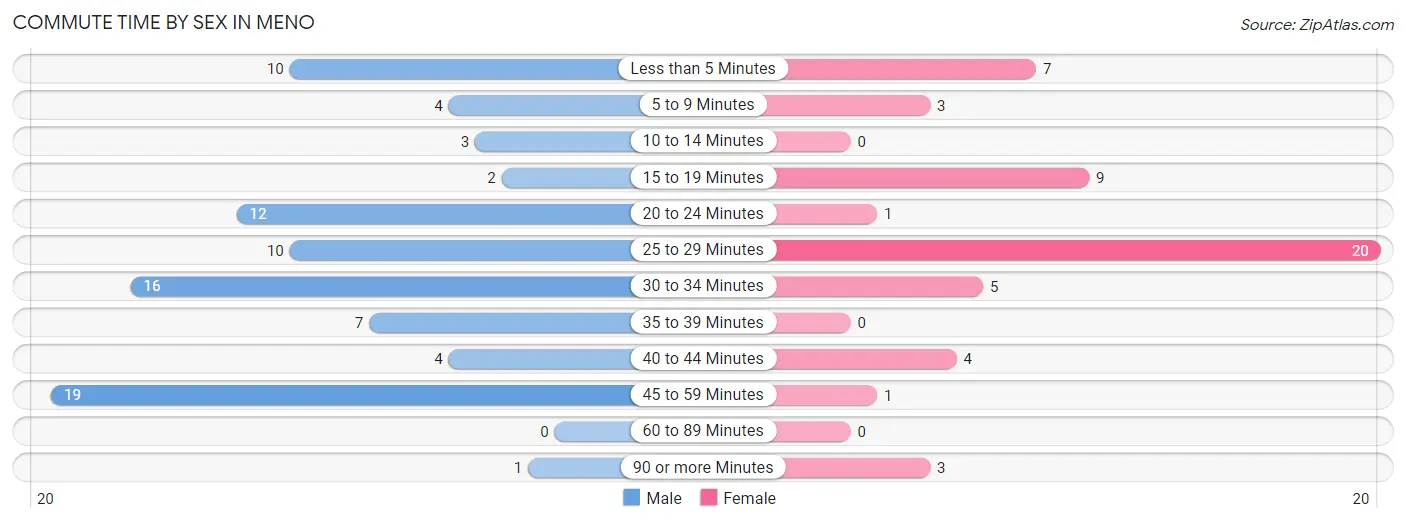
| Commute Time | Male | Female |
| Less than 5 Minutes | 10 (11.4%) | 7 (13.2%) |
| 5 to 9 Minutes | 4 (4.5%) | 3 (5.7%) |
| 10 to 14 Minutes | 3 (3.4%) | 0 (0.0%) |
| 15 to 19 Minutes | 2 (2.3%) | 9 (17.0%) |
| 20 to 24 Minutes | 12 (13.6%) | 1 (1.9%) |
| 25 to 29 Minutes | 10 (11.4%) | 20 (37.7%) |
| 30 to 34 Minutes | 16 (18.2%) | 5 (9.4%) |
| 35 to 39 Minutes | 7 (8.0%) | 0 (0.0%) |
| 40 to 44 Minutes | 4 (4.5%) | 4 (7.5%) |
| 45 to 59 Minutes | 19 (21.6%) | 1 (1.9%) |
| 60 to 89 Minutes | 0 (0.0%) | 0 (0.0%) |
| 90 or more Minutes | 1 (1.1%) | 3 (5.7%) |
Time of Departure to Work by Sex in Meno
The most frequent times of departure to work in Meno are 6:00 AM to 6:29 AM (24, 27.3%) for males and 7:30 AM to 7:59 AM (13, 24.5%) for females.
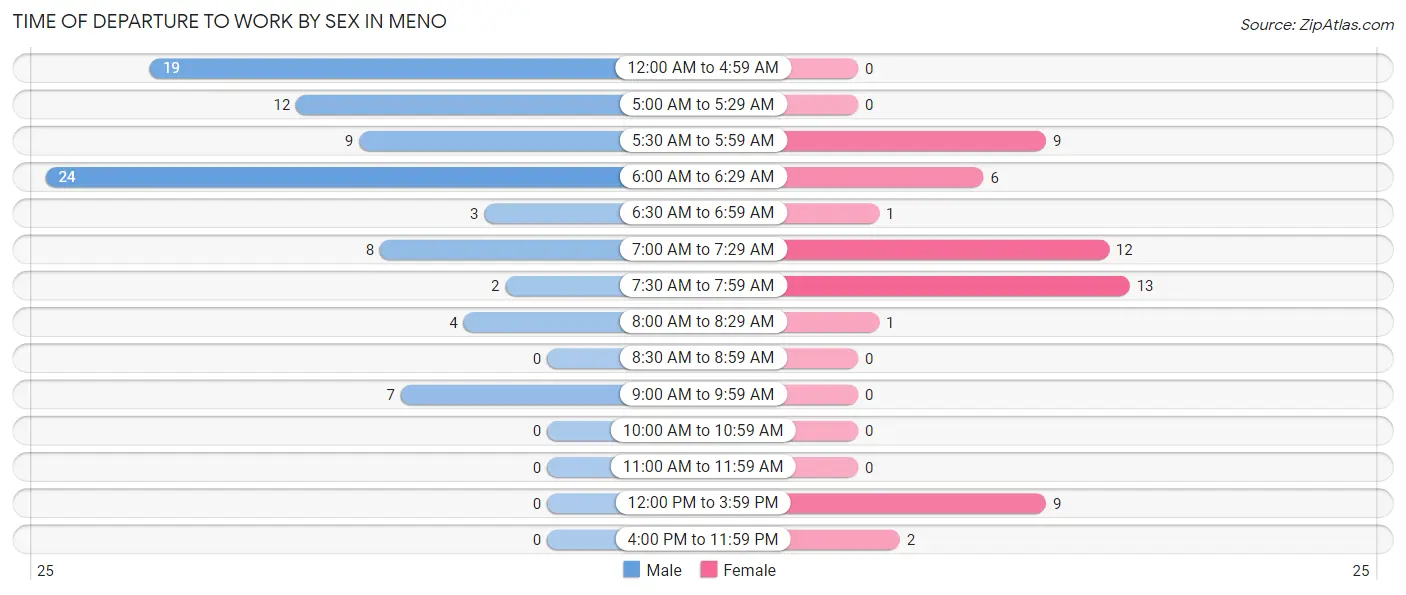
| Time of Departure | Male | Female |
| 12:00 AM to 4:59 AM | 19 (21.6%) | 0 (0.0%) |
| 5:00 AM to 5:29 AM | 12 (13.6%) | 0 (0.0%) |
| 5:30 AM to 5:59 AM | 9 (10.2%) | 9 (17.0%) |
| 6:00 AM to 6:29 AM | 24 (27.3%) | 6 (11.3%) |
| 6:30 AM to 6:59 AM | 3 (3.4%) | 1 (1.9%) |
| 7:00 AM to 7:29 AM | 8 (9.1%) | 12 (22.6%) |
| 7:30 AM to 7:59 AM | 2 (2.3%) | 13 (24.5%) |
| 8:00 AM to 8:29 AM | 4 (4.5%) | 1 (1.9%) |
| 8:30 AM to 8:59 AM | 0 (0.0%) | 0 (0.0%) |
| 9:00 AM to 9:59 AM | 7 (8.0%) | 0 (0.0%) |
| 10:00 AM to 10:59 AM | 0 (0.0%) | 0 (0.0%) |
| 11:00 AM to 11:59 AM | 0 (0.0%) | 0 (0.0%) |
| 12:00 PM to 3:59 PM | 0 (0.0%) | 9 (17.0%) |
| 4:00 PM to 11:59 PM | 0 (0.0%) | 2 (3.8%) |
| Total | 88 (100.0%) | 53 (100.0%) |
Housing Occupancy in Meno
Occupancy by Ownership in Meno
Of the total 98 dwellings in Meno, owner-occupied units account for 91 (92.9%), while renter-occupied units make up 7 (7.1%).
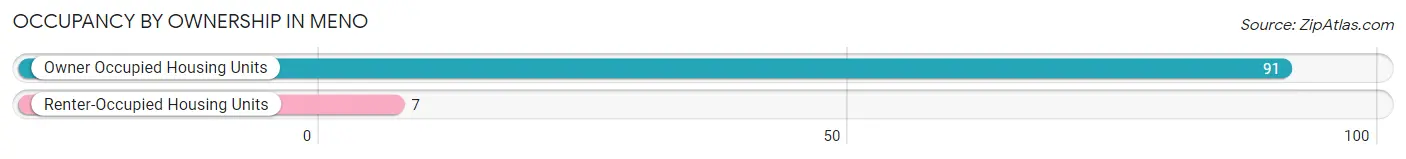
| Occupancy | # Housing Units | % Housing Units |
| Owner Occupied Housing Units | 91 | 92.9% |
| Renter-Occupied Housing Units | 7 | 7.1% |
| Total Occupied Housing Units | 98 | 100.0% |
Occupancy by Household Size in Meno
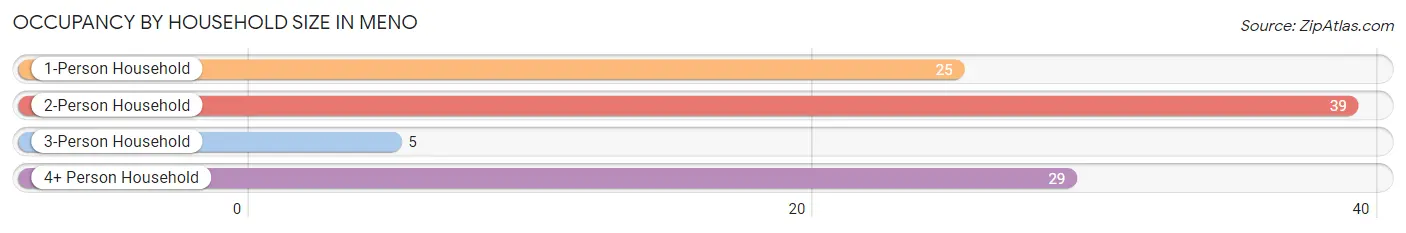
| Household Size | # Housing Units | % Housing Units |
| 1-Person Household | 25 | 25.5% |
| 2-Person Household | 39 | 39.8% |
| 3-Person Household | 5 | 5.1% |
| 4+ Person Household | 29 | 29.6% |
| Total Housing Units | 98 | 100.0% |
Occupancy by Ownership by Household Size in Meno
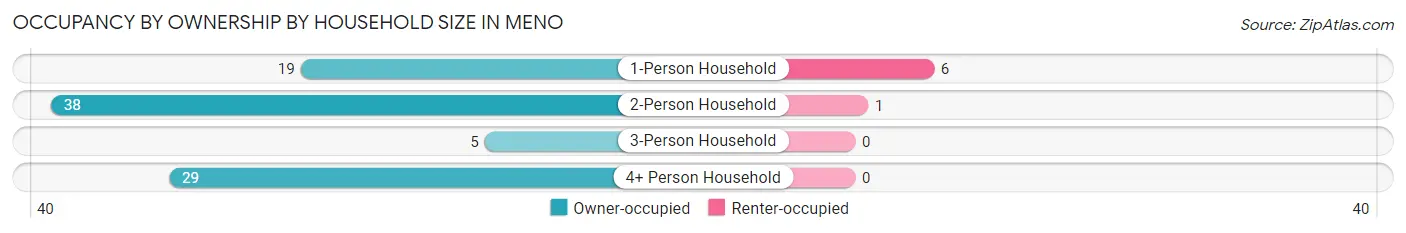
| Household Size | Owner-occupied | Renter-occupied |
| 1-Person Household | 19 (76.0%) | 6 (24.0%) |
| 2-Person Household | 38 (97.4%) | 1 (2.6%) |
| 3-Person Household | 5 (100.0%) | 0 (0.0%) |
| 4+ Person Household | 29 (100.0%) | 0 (0.0%) |
| Total Housing Units | 91 (92.9%) | 7 (7.1%) |
Occupancy by Educational Attainment in Meno
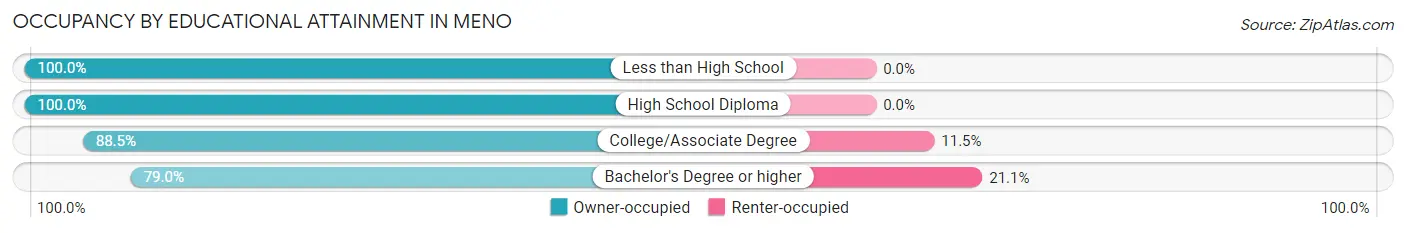
| Household Size | Owner-occupied | Renter-occupied |
| Less than High School | 15 (100.0%) | 0 (0.0%) |
| High School Diploma | 38 (100.0%) | 0 (0.0%) |
| College/Associate Degree | 23 (88.5%) | 3 (11.5%) |
| Bachelor's Degree or higher | 15 (78.9%) | 4 (21.0%) |
Occupancy by Age of Householder in Meno
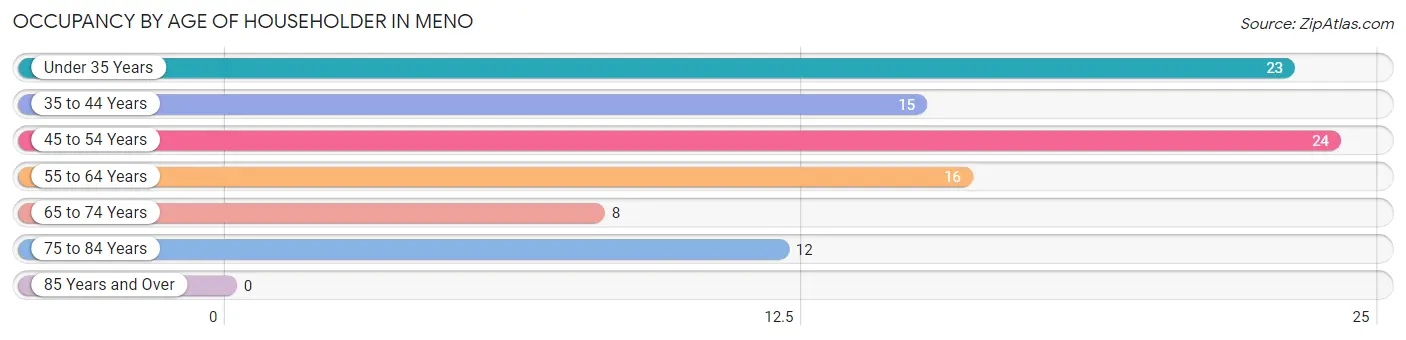
| Age Bracket | # Households | % Households |
| Under 35 Years | 23 | 23.5% |
| 35 to 44 Years | 15 | 15.3% |
| 45 to 54 Years | 24 | 24.5% |
| 55 to 64 Years | 16 | 16.3% |
| 65 to 74 Years | 8 | 8.2% |
| 75 to 84 Years | 12 | 12.2% |
| 85 Years and Over | 0 | 0.0% |
| Total | 98 | 100.0% |
Housing Finances in Meno
Median Income by Occupancy in Meno
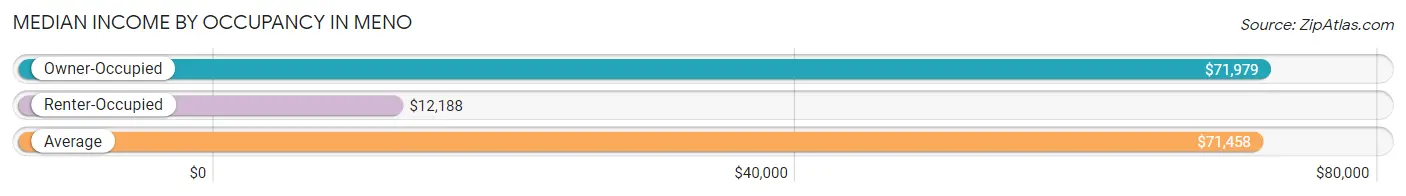
| Occupancy Type | # Households | Median Income |
| Owner-Occupied | 91 (92.9%) | $71,979 |
| Renter-Occupied | 7 (7.1%) | $12,188 |
| Average | 98 (100.0%) | $71,458 |
Occupancy by Householder Income Bracket in Meno
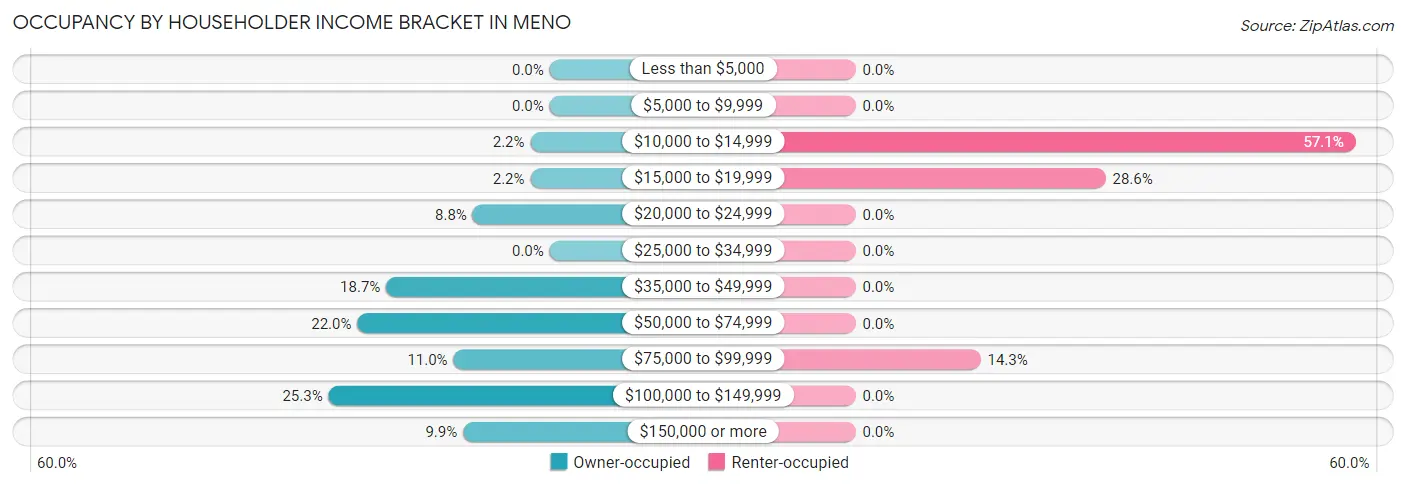
| Income Bracket | Owner-occupied | Renter-occupied |
| Less than $5,000 | 0 (0.0%) | 0 (0.0%) |
| $5,000 to $9,999 | 0 (0.0%) | 0 (0.0%) |
| $10,000 to $14,999 | 2 (2.2%) | 4 (57.1%) |
| $15,000 to $19,999 | 2 (2.2%) | 2 (28.6%) |
| $20,000 to $24,999 | 8 (8.8%) | 0 (0.0%) |
| $25,000 to $34,999 | 0 (0.0%) | 0 (0.0%) |
| $35,000 to $49,999 | 17 (18.7%) | 0 (0.0%) |
| $50,000 to $74,999 | 20 (22.0%) | 0 (0.0%) |
| $75,000 to $99,999 | 10 (11.0%) | 1 (14.3%) |
| $100,000 to $149,999 | 23 (25.3%) | 0 (0.0%) |
| $150,000 or more | 9 (9.9%) | 0 (0.0%) |
| Total | 91 (100.0%) | 7 (100.0%) |
Monthly Housing Cost Tiers in Meno
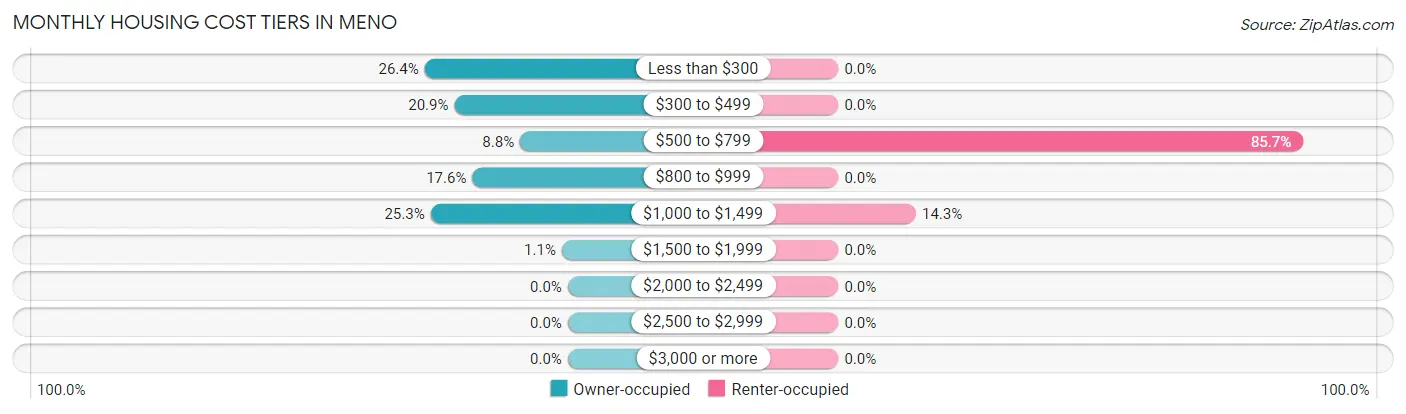
| Monthly Cost | Owner-occupied | Renter-occupied |
| Less than $300 | 24 (26.4%) | 0 (0.0%) |
| $300 to $499 | 19 (20.9%) | 0 (0.0%) |
| $500 to $799 | 8 (8.8%) | 6 (85.7%) |
| $800 to $999 | 16 (17.6%) | 0 (0.0%) |
| $1,000 to $1,499 | 23 (25.3%) | 1 (14.3%) |
| $1,500 to $1,999 | 1 (1.1%) | 0 (0.0%) |
| $2,000 to $2,499 | 0 (0.0%) | 0 (0.0%) |
| $2,500 to $2,999 | 0 (0.0%) | 0 (0.0%) |
| $3,000 or more | 0 (0.0%) | 0 (0.0%) |
| Total | 91 (100.0%) | 7 (100.0%) |
Physical Housing Characteristics in Meno
Housing Structures in Meno
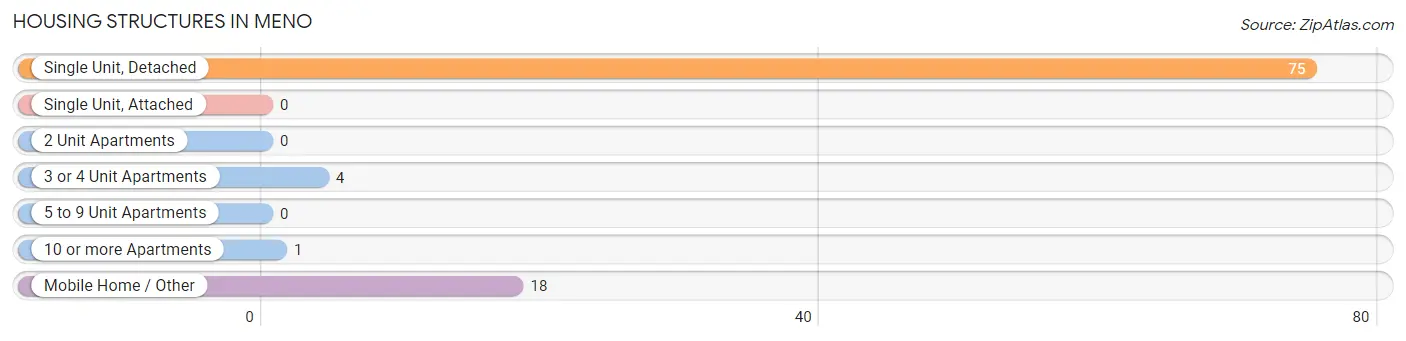
| Structure Type | # Housing Units | % Housing Units |
| Single Unit, Detached | 75 | 76.5% |
| Single Unit, Attached | 0 | 0.0% |
| 2 Unit Apartments | 0 | 0.0% |
| 3 or 4 Unit Apartments | 4 | 4.1% |
| 5 to 9 Unit Apartments | 0 | 0.0% |
| 10 or more Apartments | 1 | 1.0% |
| Mobile Home / Other | 18 | 18.4% |
| Total | 98 | 100.0% |
Housing Structures by Occupancy in Meno
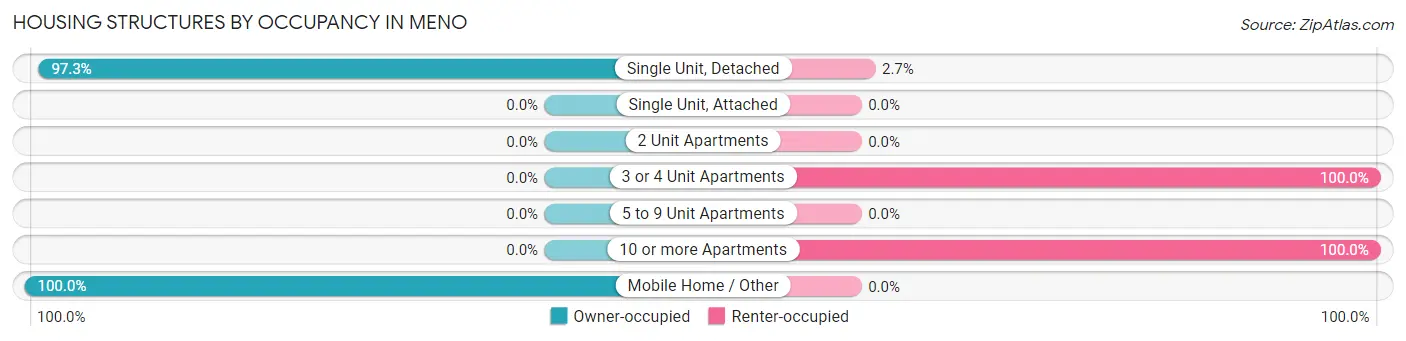
| Structure Type | Owner-occupied | Renter-occupied |
| Single Unit, Detached | 73 (97.3%) | 2 (2.7%) |
| Single Unit, Attached | 0 (0.0%) | 0 (0.0%) |
| 2 Unit Apartments | 0 (0.0%) | 0 (0.0%) |
| 3 or 4 Unit Apartments | 0 (0.0%) | 4 (100.0%) |
| 5 to 9 Unit Apartments | 0 (0.0%) | 0 (0.0%) |
| 10 or more Apartments | 0 (0.0%) | 1 (100.0%) |
| Mobile Home / Other | 18 (100.0%) | 0 (0.0%) |
| Total | 91 (92.9%) | 7 (7.1%) |
Housing Structures by Number of Rooms in Meno
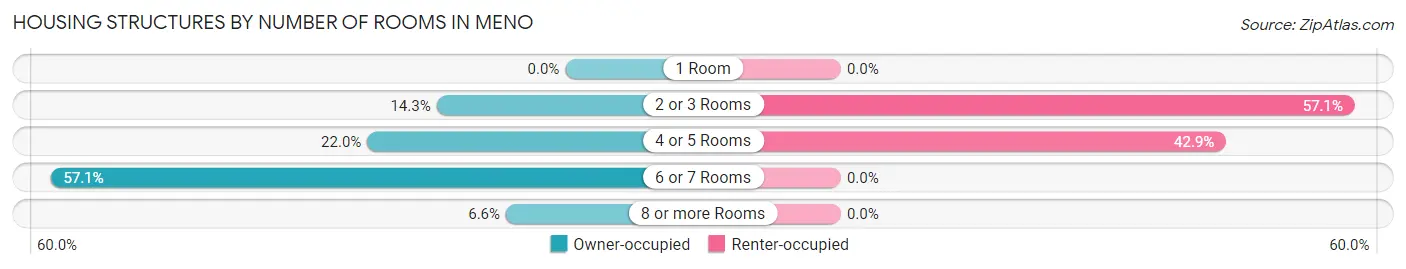
| Number of Rooms | Owner-occupied | Renter-occupied |
| 1 Room | 0 (0.0%) | 0 (0.0%) |
| 2 or 3 Rooms | 13 (14.3%) | 4 (57.1%) |
| 4 or 5 Rooms | 20 (22.0%) | 3 (42.9%) |
| 6 or 7 Rooms | 52 (57.1%) | 0 (0.0%) |
| 8 or more Rooms | 6 (6.6%) | 0 (0.0%) |
| Total | 91 (100.0%) | 7 (100.0%) |
Housing Structure by Heating Type in Meno
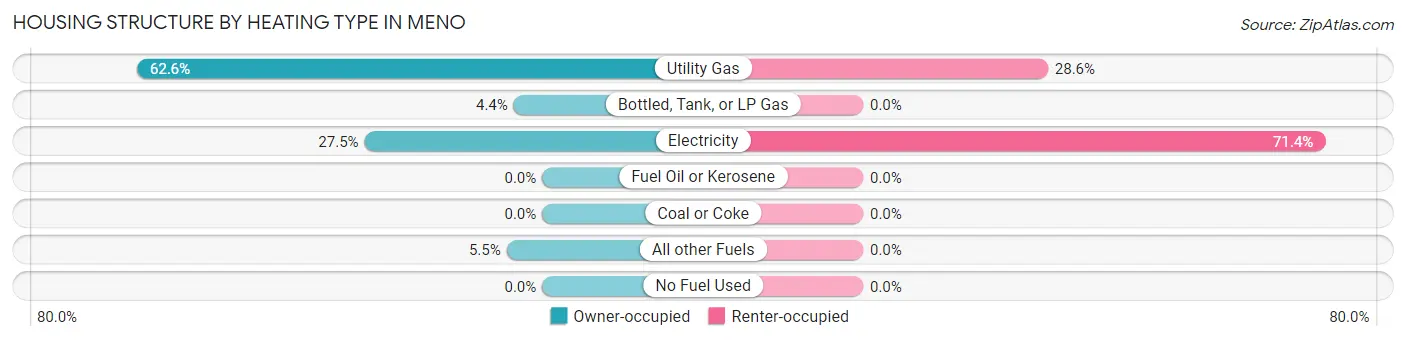
| Heating Type | Owner-occupied | Renter-occupied |
| Utility Gas | 57 (62.6%) | 2 (28.6%) |
| Bottled, Tank, or LP Gas | 4 (4.4%) | 0 (0.0%) |
| Electricity | 25 (27.5%) | 5 (71.4%) |
| Fuel Oil or Kerosene | 0 (0.0%) | 0 (0.0%) |
| Coal or Coke | 0 (0.0%) | 0 (0.0%) |
| All other Fuels | 5 (5.5%) | 0 (0.0%) |
| No Fuel Used | 0 (0.0%) | 0 (0.0%) |
| Total | 91 (100.0%) | 7 (100.0%) |
Household Vehicle Usage in Meno
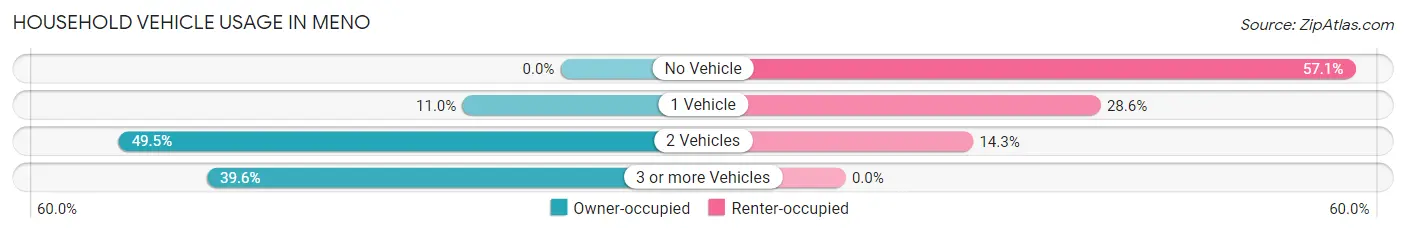
| Vehicles per Household | Owner-occupied | Renter-occupied |
| No Vehicle | 0 (0.0%) | 4 (57.1%) |
| 1 Vehicle | 10 (11.0%) | 2 (28.6%) |
| 2 Vehicles | 45 (49.4%) | 1 (14.3%) |
| 3 or more Vehicles | 36 (39.6%) | 0 (0.0%) |
| Total | 91 (100.0%) | 7 (100.0%) |
Real Estate & Mortgages in Meno
Real Estate and Mortgage Overview in Meno
| Characteristic | Without Mortgage | With Mortgage |
| Housing Units | 48 | 43 |
| Median Property Value | $137,500 | $109,200 |
| Median Household Income | $69,375 | $7 |
| Monthly Housing Costs | $275 | $0 |
| Real Estate Taxes | $610 | $2 |
Property Value by Mortgage Status in Meno
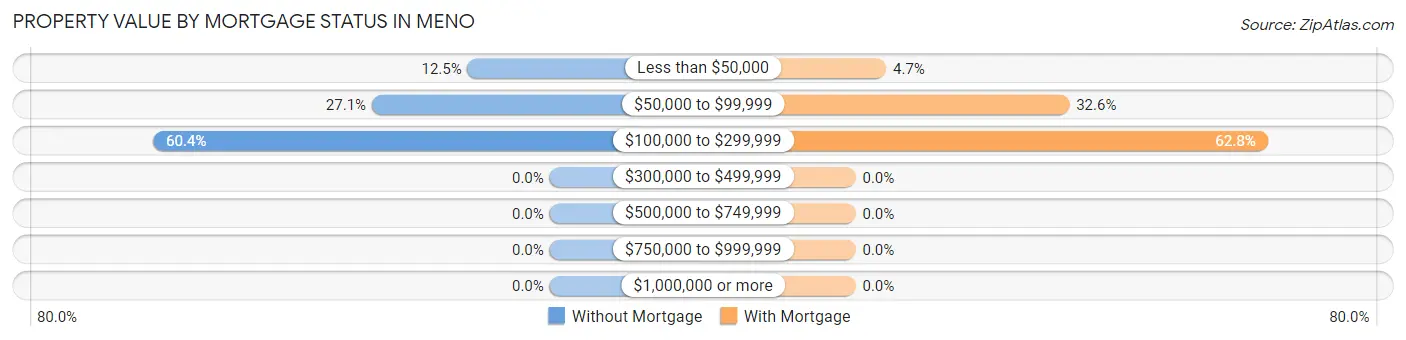
| Property Value | Without Mortgage | With Mortgage |
| Less than $50,000 | 6 (12.5%) | 2 (4.6%) |
| $50,000 to $99,999 | 13 (27.1%) | 14 (32.6%) |
| $100,000 to $299,999 | 29 (60.4%) | 27 (62.8%) |
| $300,000 to $499,999 | 0 (0.0%) | 0 (0.0%) |
| $500,000 to $749,999 | 0 (0.0%) | 0 (0.0%) |
| $750,000 to $999,999 | 0 (0.0%) | 0 (0.0%) |
| $1,000,000 or more | 0 (0.0%) | 0 (0.0%) |
| Total | 48 (100.0%) | 43 (100.0%) |
Household Income by Mortgage Status in Meno
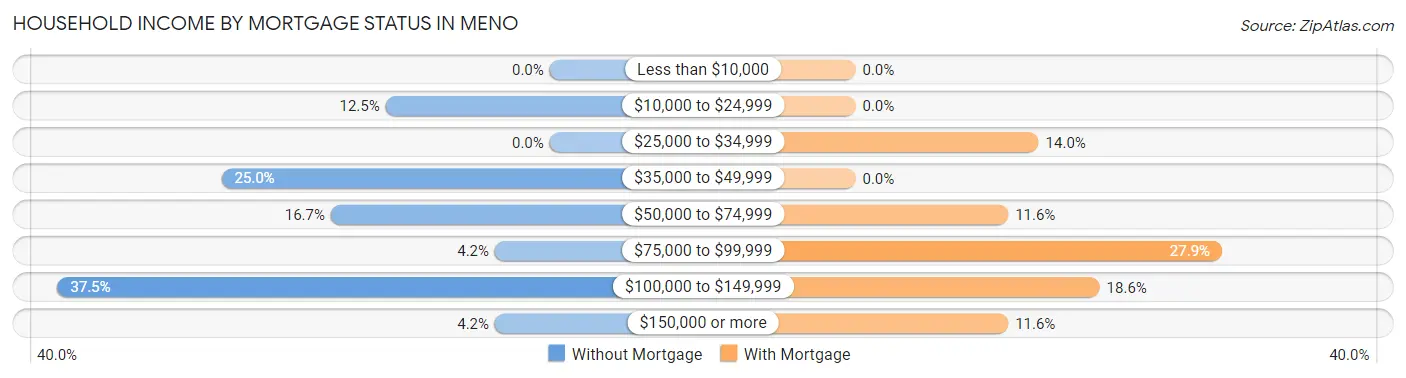
| Household Income | Without Mortgage | With Mortgage |
| Less than $10,000 | 0 (0.0%) | 0 (0.0%) |
| $10,000 to $24,999 | 6 (12.5%) | 0 (0.0%) |
| $25,000 to $34,999 | 0 (0.0%) | 6 (14.0%) |
| $35,000 to $49,999 | 12 (25.0%) | 0 (0.0%) |
| $50,000 to $74,999 | 8 (16.7%) | 5 (11.6%) |
| $75,000 to $99,999 | 2 (4.2%) | 12 (27.9%) |
| $100,000 to $149,999 | 18 (37.5%) | 8 (18.6%) |
| $150,000 or more | 2 (4.2%) | 5 (11.6%) |
| Total | 48 (100.0%) | 43 (100.0%) |
Property Value to Household Income Ratio in Meno
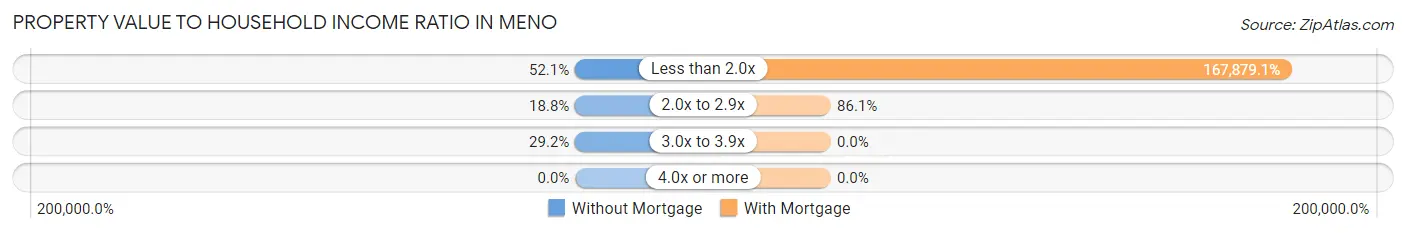
| Value-to-Income Ratio | Without Mortgage | With Mortgage |
| Less than 2.0x | 25 (52.1%) | 72,188 (167,879.1%) |
| 2.0x to 2.9x | 9 (18.8%) | 37 (86.1%) |
| 3.0x to 3.9x | 14 (29.2%) | 0 (0.0%) |
| 4.0x or more | 0 (0.0%) | 0 (0.0%) |
| Total | 48 (100.0%) | 43 (100.0%) |
Real Estate Taxes by Mortgage Status in Meno
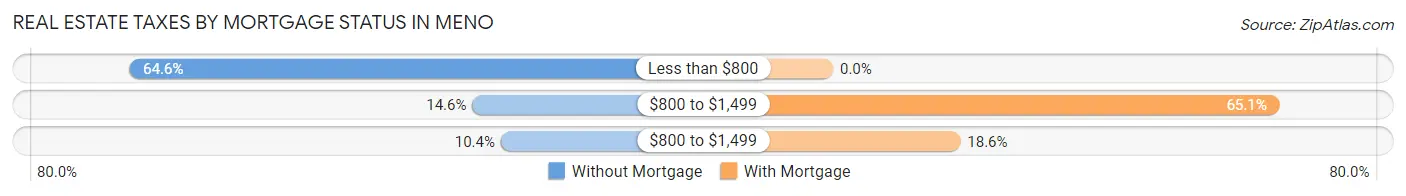
| Property Taxes | Without Mortgage | With Mortgage |
| Less than $800 | 31 (64.6%) | 0 (0.0%) |
| $800 to $1,499 | 7 (14.6%) | 28 (65.1%) |
| $800 to $1,499 | 5 (10.4%) | 8 (18.6%) |
| Total | 48 (100.0%) | 43 (100.0%) |
Health & Disability in Meno
Health Insurance Coverage by Age in Meno
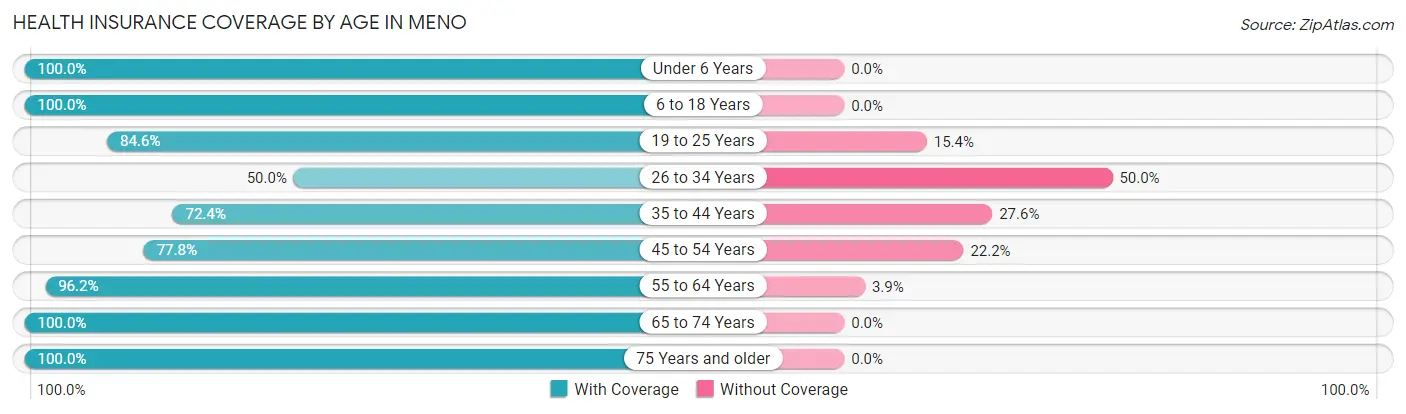
| Age Bracket | With Coverage | Without Coverage |
| Under 6 Years | 15 (100.0%) | 0 (0.0%) |
| 6 to 18 Years | 24 (100.0%) | 0 (0.0%) |
| 19 to 25 Years | 33 (84.6%) | 6 (15.4%) |
| 26 to 34 Years | 9 (50.0%) | 9 (50.0%) |
| 35 to 44 Years | 21 (72.4%) | 8 (27.6%) |
| 45 to 54 Years | 35 (77.8%) | 10 (22.2%) |
| 55 to 64 Years | 25 (96.2%) | 1 (3.8%) |
| 65 to 74 Years | 15 (100.0%) | 0 (0.0%) |
| 75 Years and older | 15 (100.0%) | 0 (0.0%) |
| Total | 192 (85.0%) | 34 (15.0%) |
Health Insurance Coverage by Citizenship Status in Meno
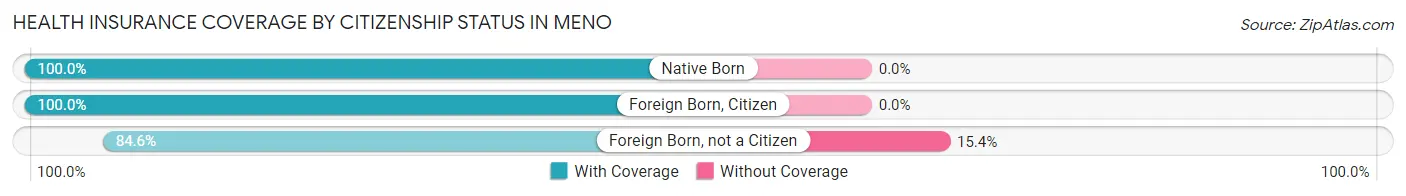
| Citizenship Status | With Coverage | Without Coverage |
| Native Born | 15 (100.0%) | 0 (0.0%) |
| Foreign Born, Citizen | 24 (100.0%) | 0 (0.0%) |
| Foreign Born, not a Citizen | 33 (84.6%) | 6 (15.4%) |
Health Insurance Coverage by Household Income in Meno
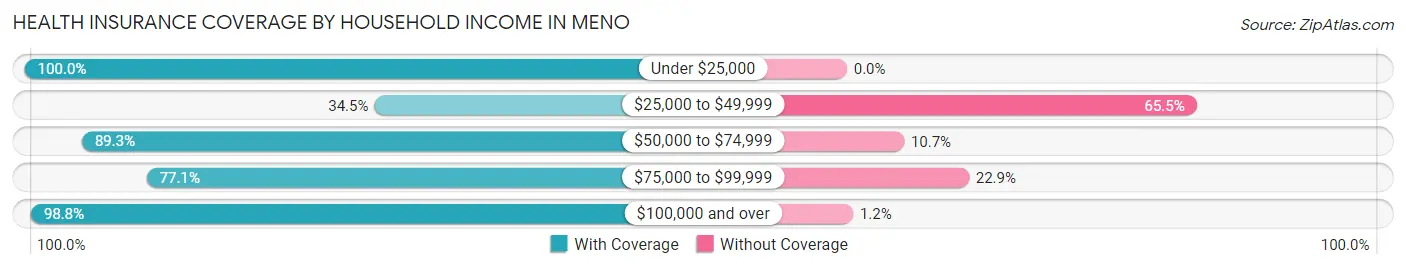
| Household Income | With Coverage | Without Coverage |
| Under $25,000 | 20 (100.0%) | 0 (0.0%) |
| $25,000 to $49,999 | 10 (34.5%) | 19 (65.5%) |
| $50,000 to $74,999 | 50 (89.3%) | 6 (10.7%) |
| $75,000 to $99,999 | 27 (77.1%) | 8 (22.9%) |
| $100,000 and over | 85 (98.8%) | 1 (1.2%) |
Public vs Private Health Insurance Coverage by Age in Meno
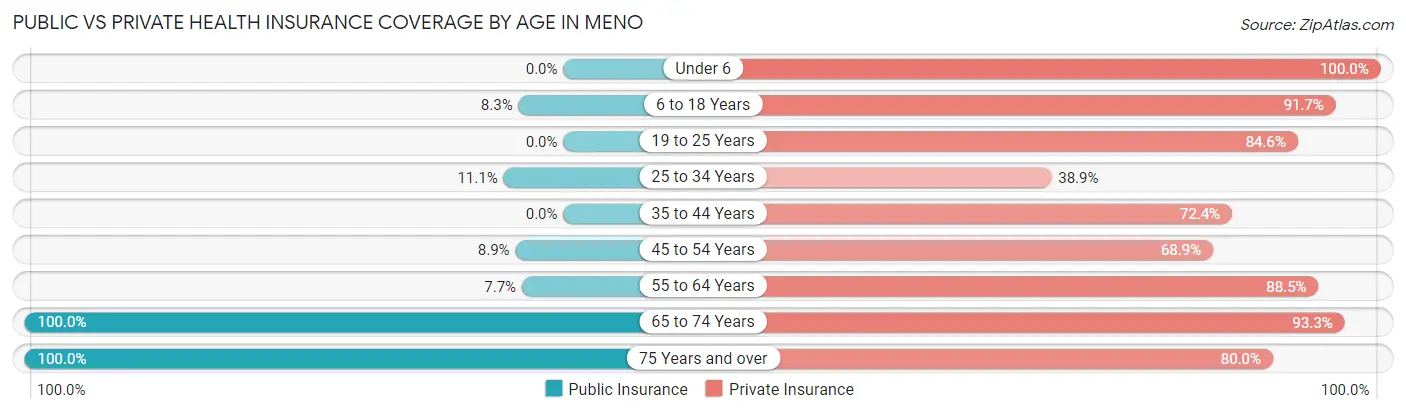
| Age Bracket | Public Insurance | Private Insurance |
| Under 6 | 0 (0.0%) | 15 (100.0%) |
| 6 to 18 Years | 2 (8.3%) | 22 (91.7%) |
| 19 to 25 Years | 0 (0.0%) | 33 (84.6%) |
| 25 to 34 Years | 2 (11.1%) | 7 (38.9%) |
| 35 to 44 Years | 0 (0.0%) | 21 (72.4%) |
| 45 to 54 Years | 4 (8.9%) | 31 (68.9%) |
| 55 to 64 Years | 2 (7.7%) | 23 (88.5%) |
| 65 to 74 Years | 15 (100.0%) | 14 (93.3%) |
| 75 Years and over | 15 (100.0%) | 12 (80.0%) |
| Total | 40 (17.7%) | 178 (78.8%) |
Disability Status by Sex by Age in Meno
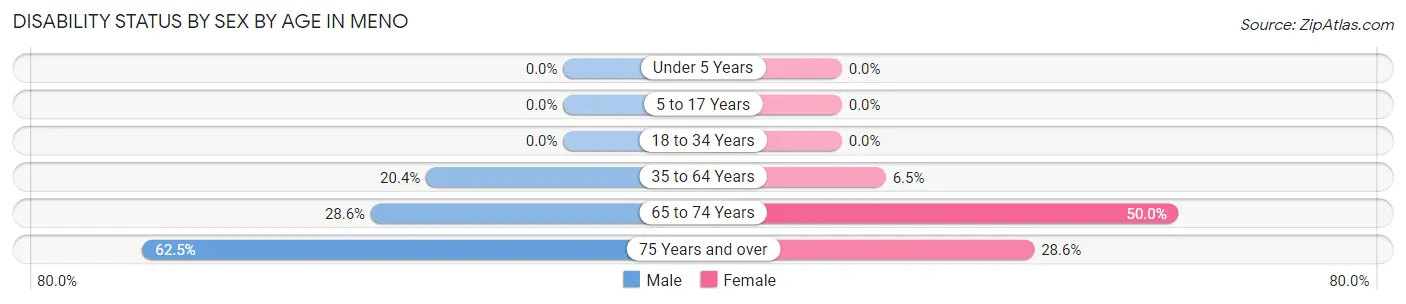
| Age Bracket | Male | Female |
| Under 5 Years | 0 (0.0%) | 0 (0.0%) |
| 5 to 17 Years | 0 (0.0%) | 0 (0.0%) |
| 18 to 34 Years | 0 (0.0%) | 0 (0.0%) |
| 35 to 64 Years | 11 (20.4%) | 3 (6.5%) |
| 65 to 74 Years | 2 (28.6%) | 4 (50.0%) |
| 75 Years and over | 5 (62.5%) | 2 (28.6%) |
Disability Class by Sex by Age in Meno
Disability Class: Hearing Difficulty
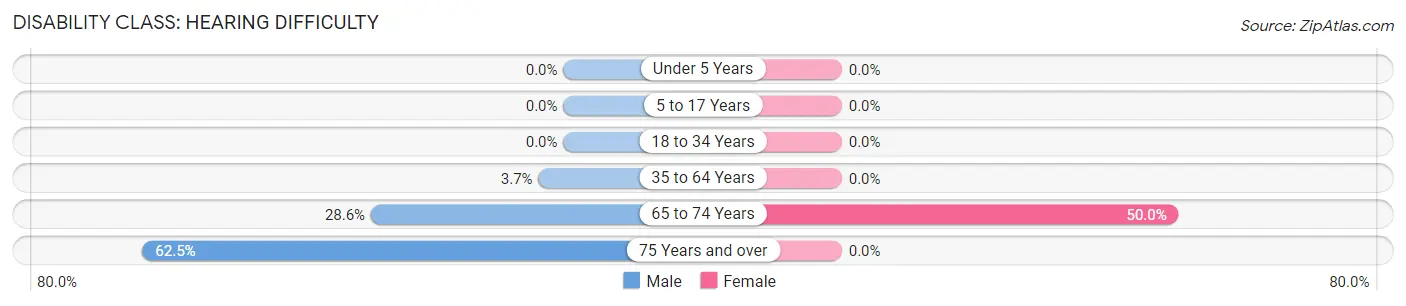
| Age Bracket | Male | Female |
| Under 5 Years | 0 (0.0%) | 0 (0.0%) |
| 5 to 17 Years | 0 (0.0%) | 0 (0.0%) |
| 18 to 34 Years | 0 (0.0%) | 0 (0.0%) |
| 35 to 64 Years | 2 (3.7%) | 0 (0.0%) |
| 65 to 74 Years | 2 (28.6%) | 4 (50.0%) |
| 75 Years and over | 5 (62.5%) | 0 (0.0%) |
Disability Class: Vision Difficulty
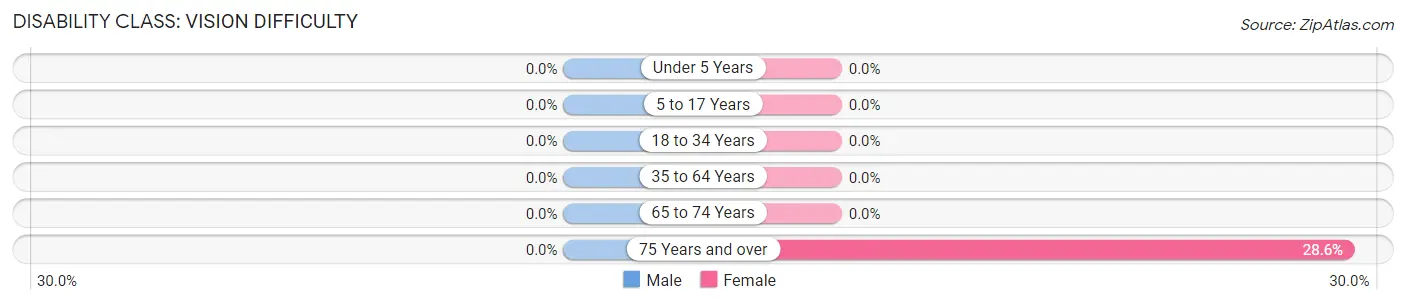
| Age Bracket | Male | Female |
| Under 5 Years | 0 (0.0%) | 0 (0.0%) |
| 5 to 17 Years | 0 (0.0%) | 0 (0.0%) |
| 18 to 34 Years | 0 (0.0%) | 0 (0.0%) |
| 35 to 64 Years | 0 (0.0%) | 0 (0.0%) |
| 65 to 74 Years | 0 (0.0%) | 0 (0.0%) |
| 75 Years and over | 0 (0.0%) | 2 (28.6%) |
Disability Class: Cognitive Difficulty
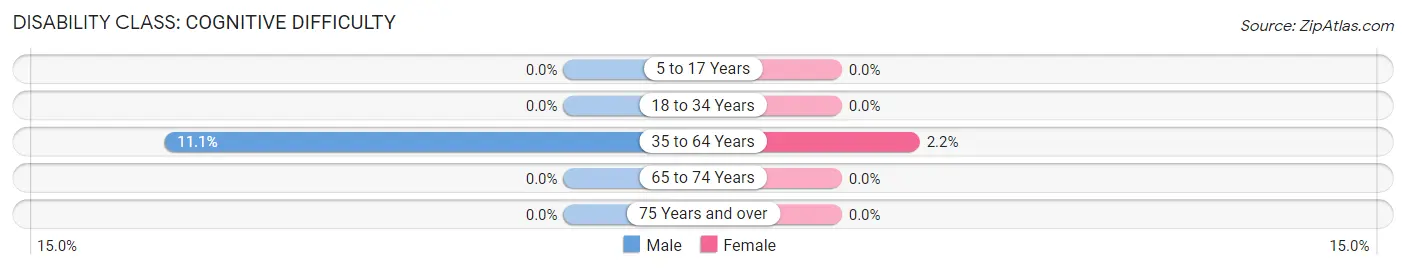
| Age Bracket | Male | Female |
| 5 to 17 Years | 0 (0.0%) | 0 (0.0%) |
| 18 to 34 Years | 0 (0.0%) | 0 (0.0%) |
| 35 to 64 Years | 6 (11.1%) | 1 (2.2%) |
| 65 to 74 Years | 0 (0.0%) | 0 (0.0%) |
| 75 Years and over | 0 (0.0%) | 0 (0.0%) |
Disability Class: Ambulatory Difficulty
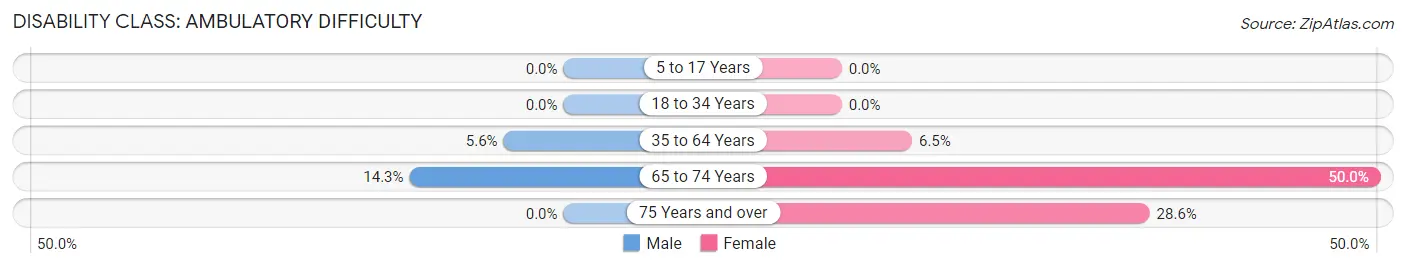
| Age Bracket | Male | Female |
| 5 to 17 Years | 0 (0.0%) | 0 (0.0%) |
| 18 to 34 Years | 0 (0.0%) | 0 (0.0%) |
| 35 to 64 Years | 3 (5.6%) | 3 (6.5%) |
| 65 to 74 Years | 1 (14.3%) | 4 (50.0%) |
| 75 Years and over | 0 (0.0%) | 2 (28.6%) |
Disability Class: Self-Care Difficulty
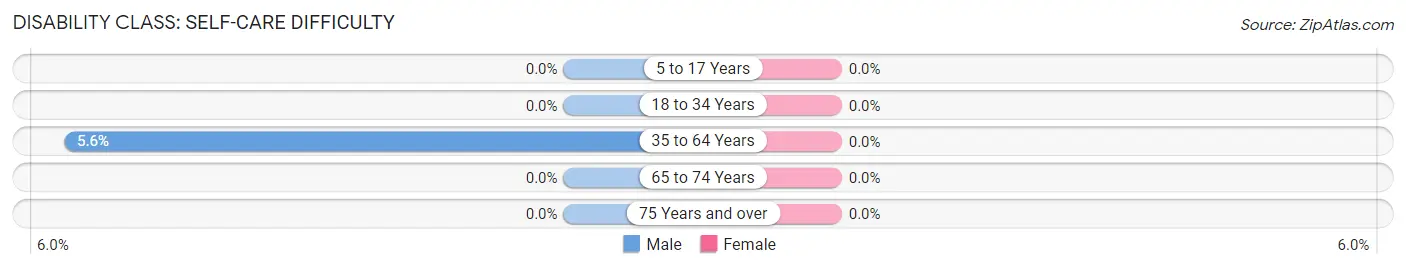
| Age Bracket | Male | Female |
| 5 to 17 Years | 0 (0.0%) | 0 (0.0%) |
| 18 to 34 Years | 0 (0.0%) | 0 (0.0%) |
| 35 to 64 Years | 3 (5.6%) | 0 (0.0%) |
| 65 to 74 Years | 0 (0.0%) | 0 (0.0%) |
| 75 Years and over | 0 (0.0%) | 0 (0.0%) |
Technology Access in Meno
Computing Device Access in Meno
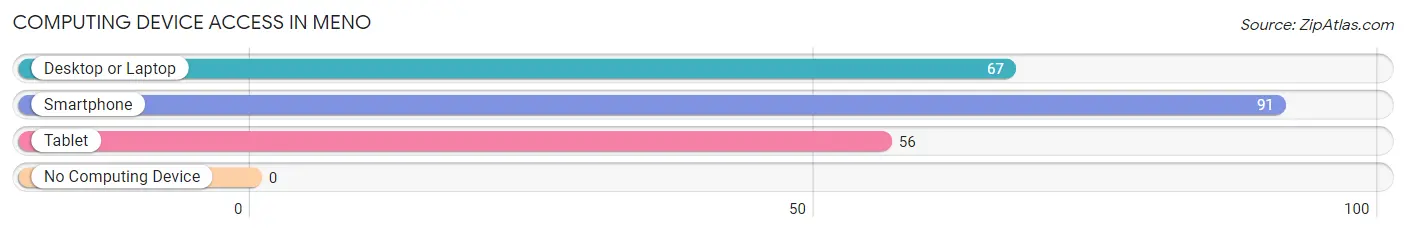
| Device Type | # Households | % Households |
| Desktop or Laptop | 67 | 68.4% |
| Smartphone | 91 | 92.9% |
| Tablet | 56 | 57.1% |
| No Computing Device | 0 | 0.0% |
| Total | 98 | 100.0% |
Internet Access in Meno
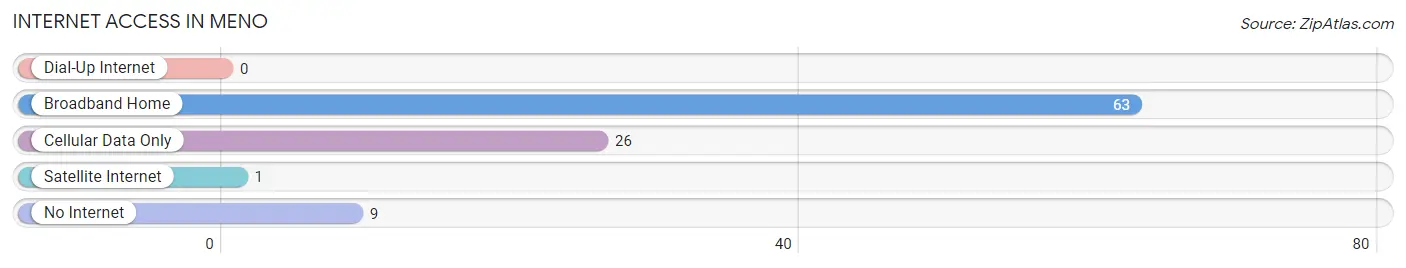
| Internet Type | # Households | % Households |
| Dial-Up Internet | 0 | 0.0% |
| Broadband Home | 63 | 64.3% |
| Cellular Data Only | 26 | 26.5% |
| Satellite Internet | 1 | 1.0% |
| No Internet | 9 | 9.2% |
| Total | 98 | 100.0% |
Meno Summary
Meno is a small town located in the state of Oklahoma in the United States. It is situated in the northwest corner of the state, near the border with Kansas. The town has a population of just over 1,000 people, and is part of the Woodward County.
History
Meno was founded in 1891 by a group of settlers from Kansas. The town was named after the nearby Meno Creek, which was named after a Native American chief. The town was originally a farming community, and the settlers grew wheat, corn, and other crops. The town was also home to a number of businesses, including a general store, a blacksmith, and a hotel.
In the early 1900s, the town began to grow and prosper. The railroad arrived in 1906, and the town was connected to the rest of the state. This allowed for the growth of the local economy, as well as the population. By 1910, the population had grown to over 500 people.
In the 1920s, the town began to decline. The Great Depression hit the town hard, and many of the businesses closed. The population dropped to just over 300 people by 1940.
Geography
Meno is located in the northwest corner of Oklahoma, near the border with Kansas. The town is situated in a flat, open area, with rolling hills to the east. The town is located in the Red Bed Plains region of Oklahoma, which is known for its red soil.
The town is located near several bodies of water, including the Cimarron River, the North Canadian River, and the Meno Creek. The town is also located near several state parks, including the Black Kettle National Grassland and the Boiling Springs State Park.
Economy
The economy of Meno is largely based on agriculture. The town is home to several farms, which grow wheat, corn, and other crops. The town is also home to a number of businesses, including a general store, a hardware store, and a restaurant.
The town is also home to a number of manufacturing businesses, including a furniture factory and a metal fabrication plant. The town is also home to a number of oil and gas companies, which are involved in the exploration and production of oil and gas in the area.
Demographics
As of the 2010 census, the population of Meno was 1,072. The town is predominantly white, with a small Hispanic population. The median household income in the town is $37,000, and the median home value is $90,000. The town has a high rate of poverty, with over 20% of the population living below the poverty line.
Conclusion
Meno is a small town located in the northwest corner of Oklahoma. The town has a population of just over 1,000 people, and is largely based on agriculture. The town is home to several businesses, and is also home to a number of oil and gas companies. The town has a predominantly white population, with a small Hispanic population. The median household income in the town is $37,000, and the median home value is $90,000.
Common Questions
What is Per Capita Income in Meno?
Per Capita income in Meno is $34,285.
What is the Median Family Income in Meno?
Median Family Income in Meno is $71,771.
What is the Median Household income in Meno?
Median Household Income in Meno is $71,458.
What is Income or Wage Gap in Meno?
Income or Wage Gap in Meno is 54.5%.
Women in Meno earn 45.5 cents for every dollar earned by a man.
What is Inequality or Gini Index in Meno?
Inequality or Gini Index in Meno is 0.34.
What is the Total Population of Meno?
Total Population of Meno is 226.
What is the Total Male Population of Meno?
Total Male Population of Meno is 125.
What is the Total Female Population of Meno?
Total Female Population of Meno is 101.
What is the Ratio of Males per 100 Females in Meno?
There are 123.76 Males per 100 Females in Meno.
What is the Ratio of Females per 100 Males in Meno?
There are 80.80 Females per 100 Males in Meno.
What is the Median Population Age in Meno?
Median Population Age in Meno is 38.5 Years.
What is the Average Family Size in Meno
Average Family Size in Meno is 2.6 People.
What is the Average Household Size in Meno
Average Household Size in Meno is 2.3 People.
How Large is the Labor Force in Meno?
There are 144 People in the Labor Forcein in Meno.
What is the Percentage of People in the Labor Force in Meno?
74.6% of People are in the Labor Force in Meno.
What is the Unemployment Rate in Meno?
Unemployment Rate in Meno is 0.7%.