Zip Codes with the Highest Percentage of Population Employed in Health Diagnosing & Treating in Steubenville, OH
RELATED REPORTS & OPTIONS
Health Diagnosing & Treating
Steubenville
Compare Zip Codes
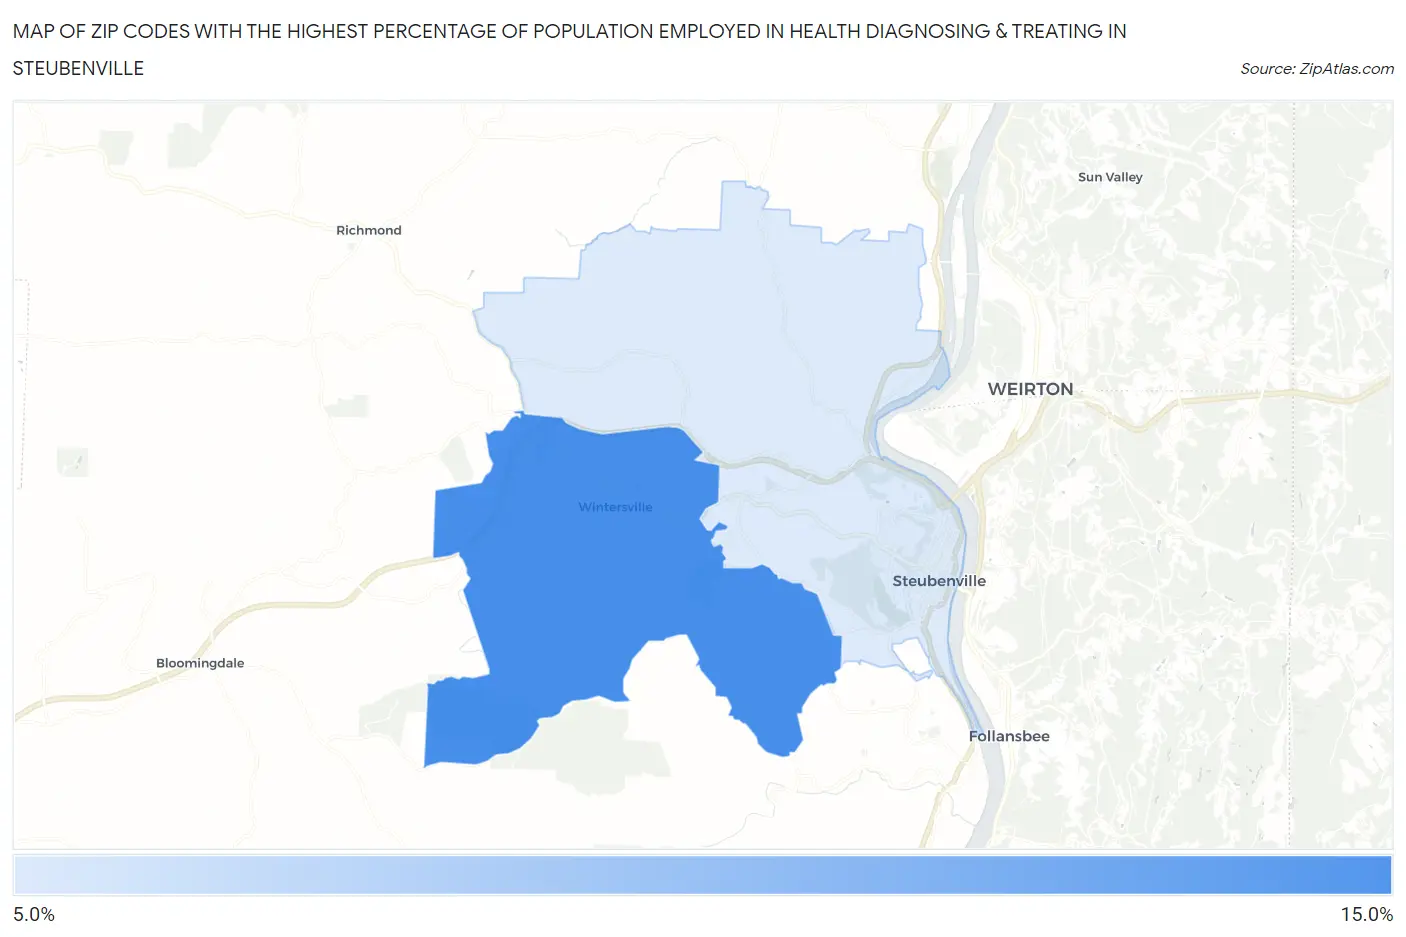
Map of Zip Codes with the Highest Percentage of Population Employed in Health Diagnosing & Treating in Steubenville
6.6%
10.8%
Zip Codes with the Highest Percentage of Population Employed in Health Diagnosing & Treating in Steubenville, OH
| Zip Code | % Employed | vs State | vs National | |
| 1. | 43953 | 10.8% | 7.2%(+3.60)#128 | 6.2%(+4.51)#3,093 |
| 2. | 43952 | 6.6% | 7.2%(-0.558)#529 | 6.2%(+0.349)#11,692 |
1
Common Questions
What are the Top Zip Codes with the Highest Percentage of Population Employed in Health Diagnosing & Treating in Steubenville, OH?
Top Zip Codes with the Highest Percentage of Population Employed in Health Diagnosing & Treating in Steubenville, OH are:
What zip code has the Highest Percentage of Population Employed in Health Diagnosing & Treating in Steubenville, OH?
43953 has the Highest Percentage of Population Employed in Health Diagnosing & Treating in Steubenville, OH with 10.8%.
What is the Percentage of Population Employed in Health Diagnosing & Treating in Steubenville, OH?
Percentage of Population Employed in Health Diagnosing & Treating in Steubenville is 6.9%.
What is the Percentage of Population Employed in Health Diagnosing & Treating in Ohio?
Percentage of Population Employed in Health Diagnosing & Treating in Ohio is 7.2%.
What is the Percentage of Population Employed in Health Diagnosing & Treating in the United States?
Percentage of Population Employed in Health Diagnosing & Treating in the United States is 6.2%.