Zip Codes with the Highest Percentage of Population Employed in Health Diagnosing & Treating in Middletown, OH
RELATED REPORTS & OPTIONS
Health Diagnosing & Treating
Middletown
Compare Zip Codes
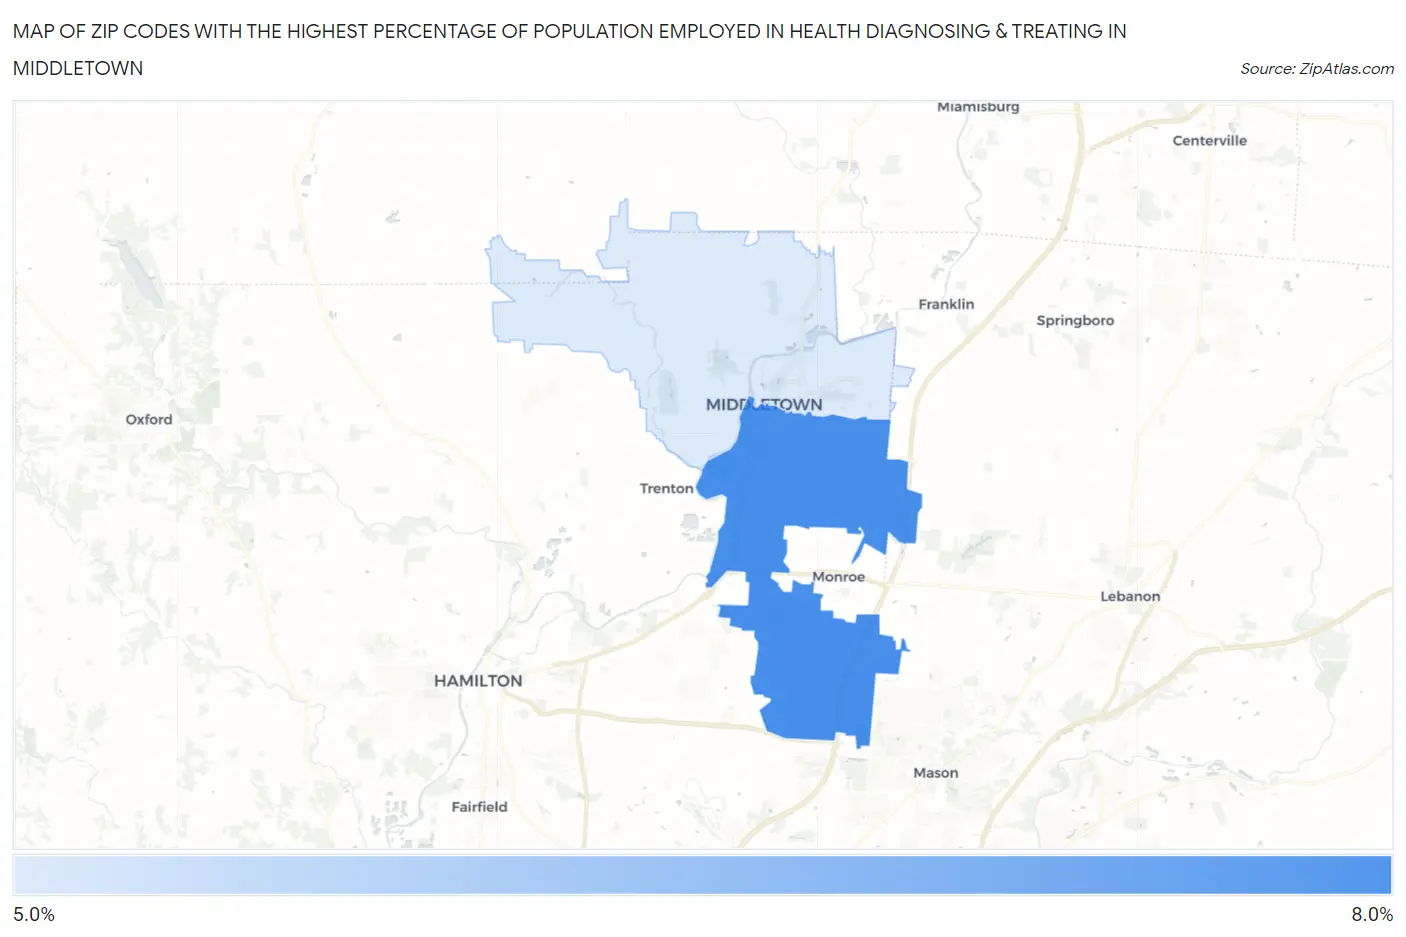
Map of Zip Codes with the Highest Percentage of Population Employed in Health Diagnosing & Treating in Middletown
5.9%
7.1%
Zip Codes with the Highest Percentage of Population Employed in Health Diagnosing & Treating in Middletown, OH
| Zip Code | % Employed | vs State | vs National | |
| 1. | 45044 | 7.1% | 7.2%(-0.002)#448 | 6.2%(+0.904)#9,867 |
| 2. | 45042 | 5.9% | 7.2%(-1.24)#628 | 6.2%(-0.335)#14,186 |
1
Common Questions
What are the Top Zip Codes with the Highest Percentage of Population Employed in Health Diagnosing & Treating in Middletown, OH?
Top Zip Codes with the Highest Percentage of Population Employed in Health Diagnosing & Treating in Middletown, OH are:
What zip code has the Highest Percentage of Population Employed in Health Diagnosing & Treating in Middletown, OH?
45044 has the Highest Percentage of Population Employed in Health Diagnosing & Treating in Middletown, OH with 7.1%.
What is the Percentage of Population Employed in Health Diagnosing & Treating in Middletown, OH?
Percentage of Population Employed in Health Diagnosing & Treating in Middletown is 4.7%.
What is the Percentage of Population Employed in Health Diagnosing & Treating in Ohio?
Percentage of Population Employed in Health Diagnosing & Treating in Ohio is 7.2%.
What is the Percentage of Population Employed in Health Diagnosing & Treating in the United States?
Percentage of Population Employed in Health Diagnosing & Treating in the United States is 6.2%.