Zip Codes with the Highest Percentage of Population Employed in Health Diagnosing & Treating in Toledo, OH
RELATED REPORTS & OPTIONS
Health Diagnosing & Treating
Toledo
Compare Zip Codes
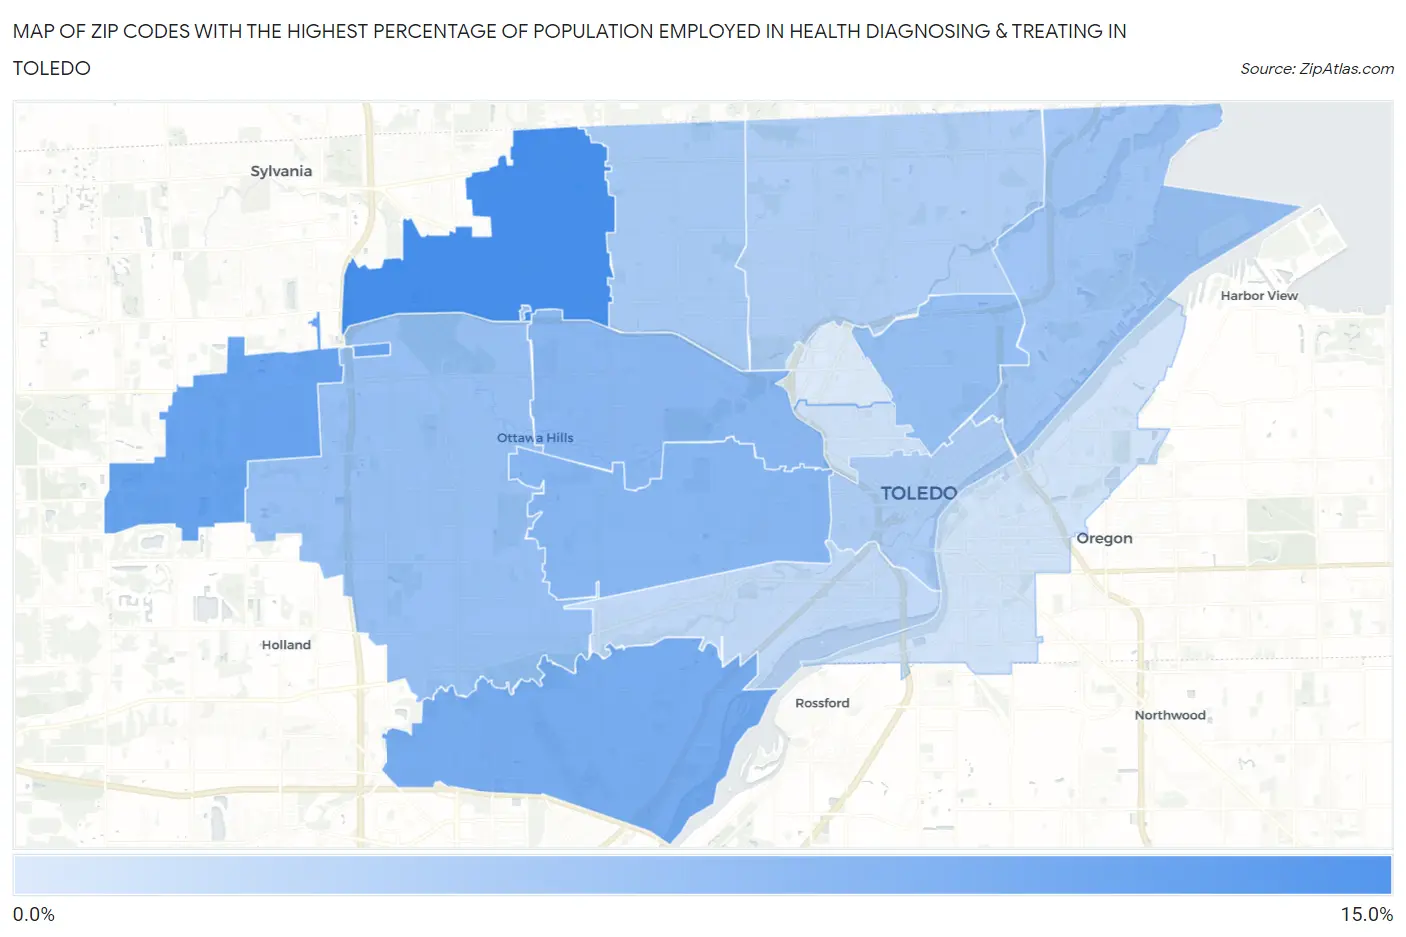
Map of Zip Codes with the Highest Percentage of Population Employed in Health Diagnosing & Treating in Toledo
3.0%
10.7%
Zip Codes with the Highest Percentage of Population Employed in Health Diagnosing & Treating in Toledo, OH
| Zip Code | % Employed | vs State | vs National | |
| 1. | 43623 | 10.7% | 7.2%(+3.51)#132 | 6.2%(+4.42)#3,166 |
| 2. | 43617 | 8.8% | 7.2%(+1.69)#254 | 6.2%(+2.59)#5,657 |
| 3. | 43614 | 8.1% | 7.2%(+0.992)#328 | 6.2%(+1.90)#7,147 |
| 4. | 43607 | 7.3% | 7.2%(+0.175)#422 | 6.2%(+1.08)#9,338 |
| 5. | 43606 | 7.2% | 7.2%(+0.070)#440 | 6.2%(+0.977)#9,659 |
| 6. | 43608 | 6.6% | 7.2%(-0.569)#530 | 6.2%(+0.338)#11,732 |
| 7. | 43615 | 6.5% | 7.2%(-0.682)#543 | 6.2%(+0.225)#12,131 |
| 8. | 43611 | 6.0% | 7.2%(-1.15)#614 | 6.2%(-0.241)#13,852 |
| 9. | 43613 | 5.6% | 7.2%(-1.54)#666 | 6.2%(-0.636)#15,361 |
| 10. | 43604 | 5.5% | 7.2%(-1.68)#681 | 6.2%(-0.776)#15,898 |
| 11. | 43612 | 5.2% | 7.2%(-1.91)#712 | 6.2%(-1.000)#16,771 |
| 12. | 43609 | 4.4% | 7.2%(-2.75)#839 | 6.2%(-1.84)#19,996 |
| 13. | 43620 | 3.7% | 7.2%(-3.49)#917 | 6.2%(-2.58)#22,406 |
| 14. | 43605 | 3.5% | 7.2%(-3.64)#927 | 6.2%(-2.73)#22,881 |
| 15. | 43610 | 3.0% | 7.2%(-4.16)#973 | 6.2%(-3.25)#24,332 |
1
Common Questions
What are the Top 10 Zip Codes with the Highest Percentage of Population Employed in Health Diagnosing & Treating in Toledo, OH?
Top 10 Zip Codes with the Highest Percentage of Population Employed in Health Diagnosing & Treating in Toledo, OH are:
What zip code has the Highest Percentage of Population Employed in Health Diagnosing & Treating in Toledo, OH?
43623 has the Highest Percentage of Population Employed in Health Diagnosing & Treating in Toledo, OH with 10.7%.
What is the Percentage of Population Employed in Health Diagnosing & Treating in Toledo, OH?
Percentage of Population Employed in Health Diagnosing & Treating in Toledo is 5.8%.
What is the Percentage of Population Employed in Health Diagnosing & Treating in Ohio?
Percentage of Population Employed in Health Diagnosing & Treating in Ohio is 7.2%.
What is the Percentage of Population Employed in Health Diagnosing & Treating in the United States?
Percentage of Population Employed in Health Diagnosing & Treating in the United States is 6.2%.