Williamstown, NJ Map & Demographics
Williamstown Map
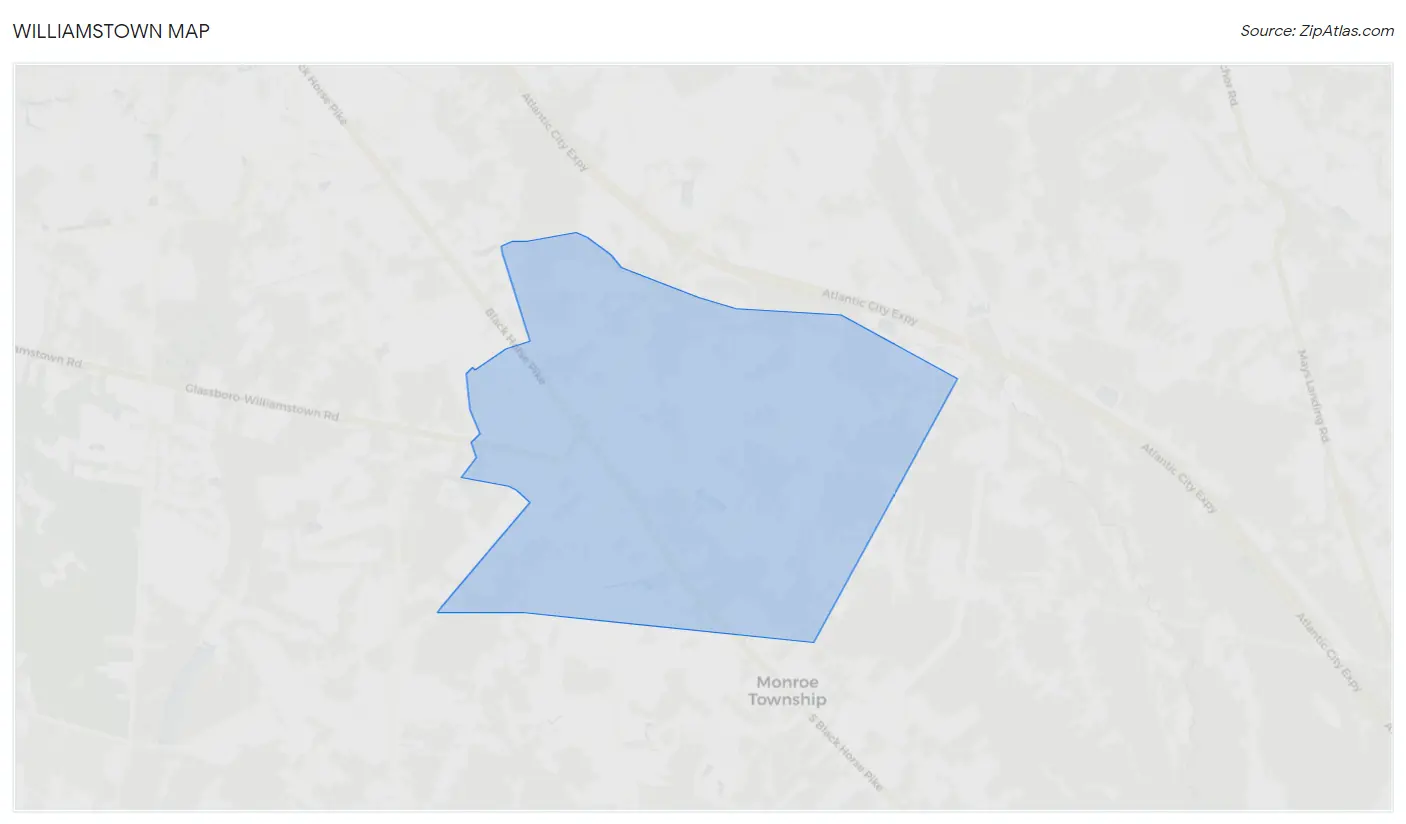
Williamstown Overview
$41,032
PER CAPITA INCOME
$114,044
AVG FAMILY INCOME
$89,567
AVG HOUSEHOLD INCOME
24.7%
WAGE / INCOME GAP [ % ]
75.3¢/ $1
WAGE / INCOME GAP [ $ ]
0.39
INEQUALITY / GINI INDEX
14,770
TOTAL POPULATION
6,622
MALE POPULATION
8,148
FEMALE POPULATION
81.27
MALES / 100 FEMALES
123.04
FEMALES / 100 MALES
39.9
MEDIAN AGE
3.3
AVG FAMILY SIZE
2.6
AVG HOUSEHOLD SIZE
7,736
LABOR FORCE [ PEOPLE ]
65.1%
PERCENT IN LABOR FORCE
5.7%
UNEMPLOYMENT RATE
Williamstown Zip Codes
Williamstown Area Codes
Income in Williamstown
Income Overview in Williamstown
Per Capita Income in Williamstown is $41,032, while median incomes of families and households are $114,044 and $89,567 respectively.
| Characteristic | Number | Measure |
| Per Capita Income | 14,770 | $41,032 |
| Median Family Income | 3,789 | $114,044 |
| Mean Family Income | 3,789 | $130,999 |
| Median Household Income | 5,585 | $89,567 |
| Mean Household Income | 5,585 | $105,697 |
| Income Deficit | 3,789 | $0 |
| Wage / Income Gap (%) | 14,770 | 24.66% |
| Wage / Income Gap ($) | 14,770 | 75.34¢ per $1 |
| Gini / Inequality Index | 14,770 | 0.39 |
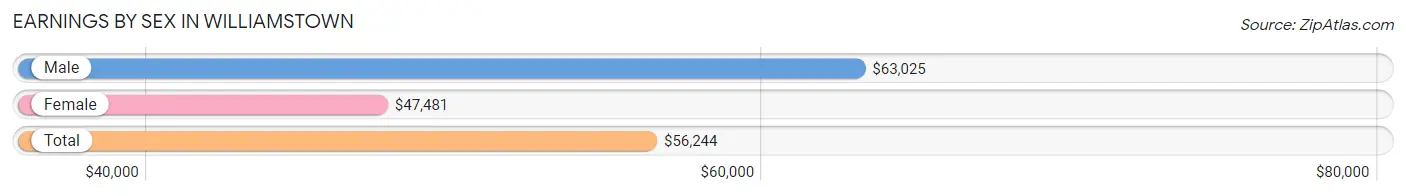
Earnings by Sex in Williamstown
Average Earnings in Williamstown are $56,244, $63,025 for men and $47,481 for women, a difference of 24.7%.
| Sex | Number | Average Earnings |
| Male | 4,073 (50.6%) | $63,025 |
| Female | 3,974 (49.4%) | $47,481 |
| Total | 8,047 (100.0%) | $56,244 |
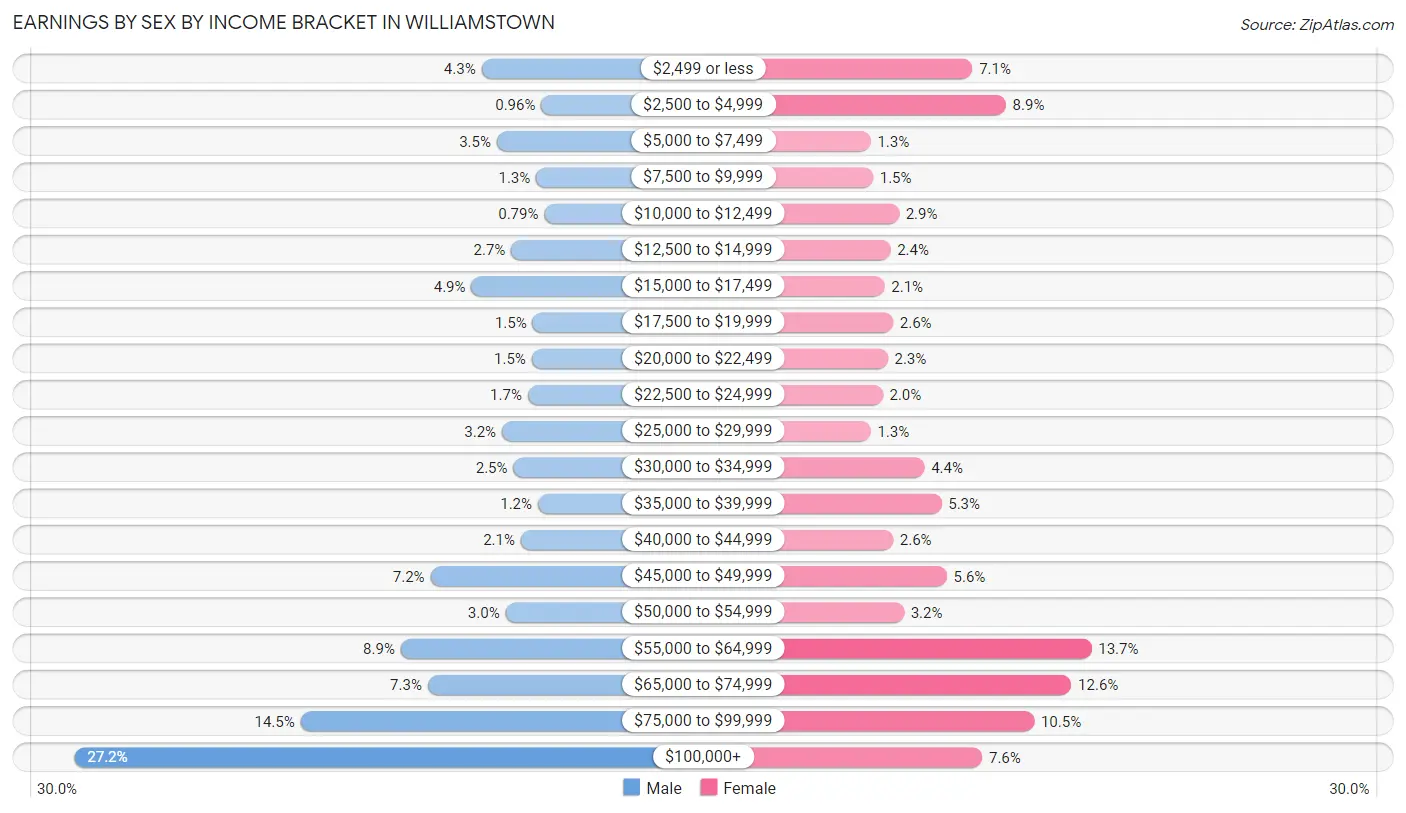
Earnings by Sex by Income Bracket in Williamstown
The most common earnings brackets in Williamstown are $100,000+ for men (1,108 | 27.2%) and $55,000 to $64,999 for women (546 | 13.7%).
| Income | Male | Female |
| $2,499 or less | 176 (4.3%) | 280 (7.0%) |
| $2,500 to $4,999 | 39 (1.0%) | 355 (8.9%) |
| $5,000 to $7,499 | 141 (3.5%) | 53 (1.3%) |
| $7,500 to $9,999 | 51 (1.3%) | 58 (1.5%) |
| $10,000 to $12,499 | 32 (0.8%) | 116 (2.9%) |
| $12,500 to $14,999 | 108 (2.6%) | 97 (2.4%) |
| $15,000 to $17,499 | 199 (4.9%) | 84 (2.1%) |
| $17,500 to $19,999 | 59 (1.5%) | 103 (2.6%) |
| $20,000 to $22,499 | 61 (1.5%) | 91 (2.3%) |
| $22,500 to $24,999 | 70 (1.7%) | 80 (2.0%) |
| $25,000 to $29,999 | 129 (3.2%) | 53 (1.3%) |
| $30,000 to $34,999 | 103 (2.5%) | 173 (4.3%) |
| $35,000 to $39,999 | 47 (1.1%) | 211 (5.3%) |
| $40,000 to $44,999 | 86 (2.1%) | 103 (2.6%) |
| $45,000 to $49,999 | 293 (7.2%) | 223 (5.6%) |
| $50,000 to $54,999 | 121 (3.0%) | 127 (3.2%) |
| $55,000 to $64,999 | 361 (8.9%) | 546 (13.7%) |
| $65,000 to $74,999 | 299 (7.3%) | 501 (12.6%) |
| $75,000 to $99,999 | 590 (14.5%) | 418 (10.5%) |
| $100,000+ | 1,108 (27.2%) | 302 (7.6%) |
| Total | 4,073 (100.0%) | 3,974 (100.0%) |
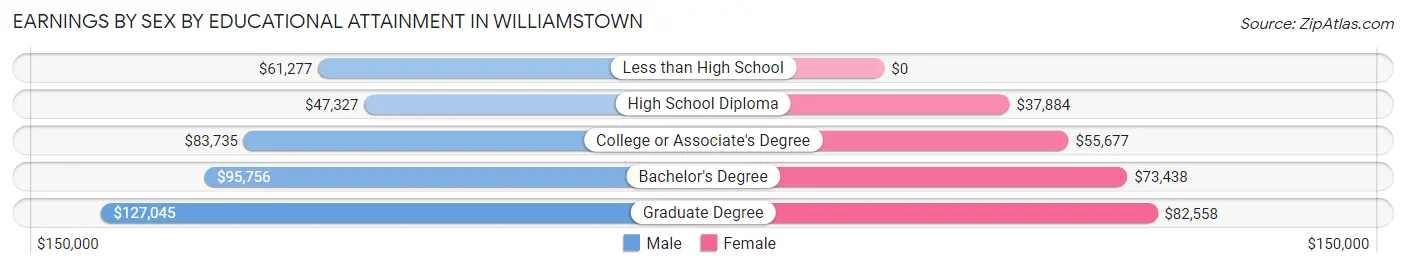
Earnings by Sex by Educational Attainment in Williamstown
Average earnings in Williamstown are $73,054 for men and $54,177 for women, a difference of 25.8%. Men with an educational attainment of graduate degree enjoy the highest average annual earnings of $127,045, while those with high school diploma education earn the least with $47,327. Women with an educational attainment of graduate degree earn the most with the average annual earnings of $82,558, while those with high school diploma education have the smallest earnings of $37,884.
| Educational Attainment | Male Income | Female Income |
| Less than High School | $61,277 | $0 |
| High School Diploma | $47,327 | $37,884 |
| College or Associate's Degree | $83,735 | $55,677 |
| Bachelor's Degree | $95,756 | $73,438 |
| Graduate Degree | $127,045 | $82,558 |
| Total | $73,054 | $54,177 |
Family Income in Williamstown
Family Income Brackets in Williamstown
According to the Williamstown family income data, there are 966 families falling into the $100,000 to $149,999 income range, which is the most common income bracket and makes up 25.5% of all families. Conversely, the $10,000 to $14,999 income bracket is the least frequent group with only 30 families (0.8%) belonging to this category.
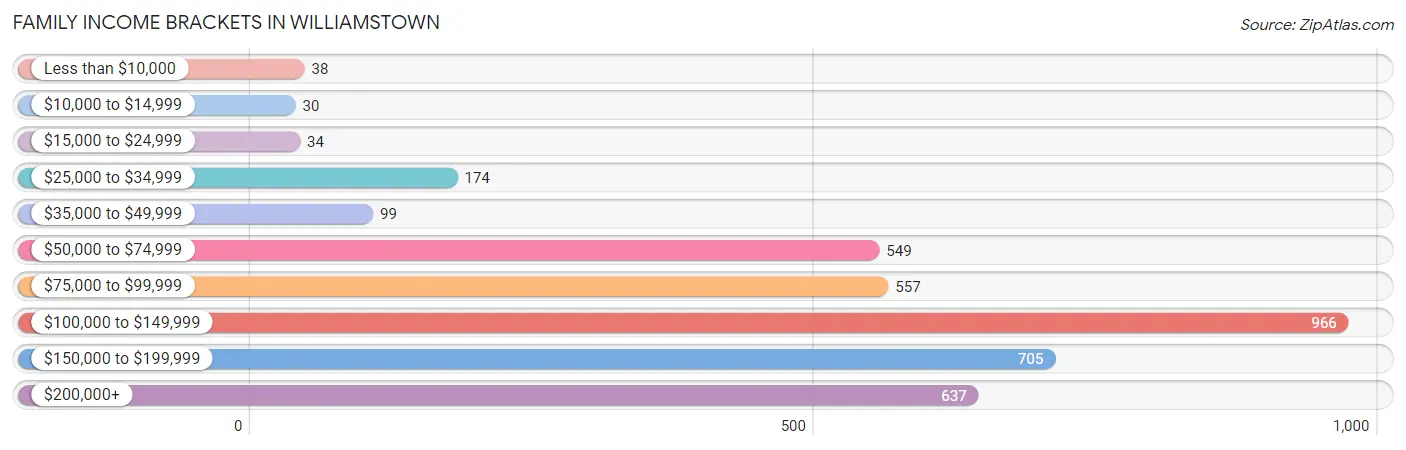
| Income Bracket | # Families | % Families |
| Less than $10,000 | 38 | 1.0% |
| $10,000 to $14,999 | 30 | 0.8% |
| $15,000 to $24,999 | 34 | 0.9% |
| $25,000 to $34,999 | 174 | 4.6% |
| $35,000 to $49,999 | 99 | 2.6% |
| $50,000 to $74,999 | 549 | 14.5% |
| $75,000 to $99,999 | 557 | 14.7% |
| $100,000 to $149,999 | 966 | 25.5% |
| $150,000 to $199,999 | 705 | 18.6% |
| $200,000+ | 637 | 16.8% |
Family Income by Famaliy Size in Williamstown
5-person families (427 | 11.3%) account for the highest median family income in Williamstown with $172,917 per family, while 2-person families (1,377 | 36.3%) have the highest median income of $49,590 per family member.
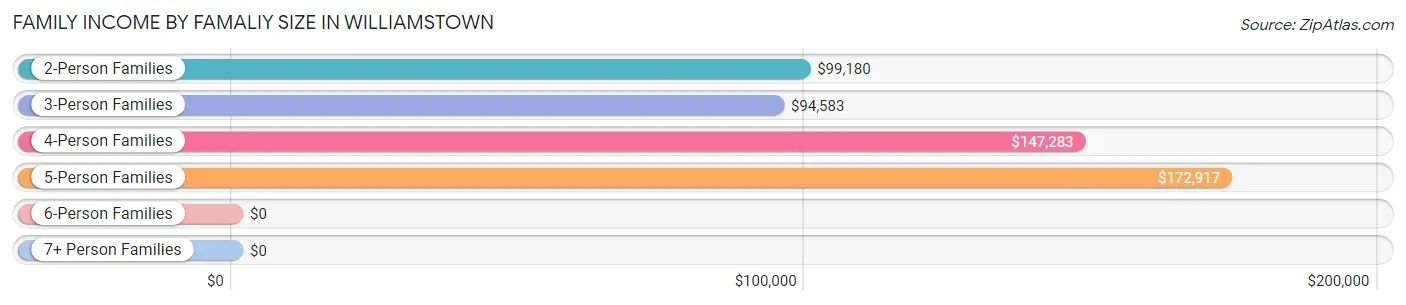
| Income Bracket | # Families | Median Income |
| 2-Person Families | 1,377 (36.3%) | $99,180 |
| 3-Person Families | 752 (19.9%) | $94,583 |
| 4-Person Families | 1,206 (31.8%) | $147,283 |
| 5-Person Families | 427 (11.3%) | $172,917 |
| 6-Person Families | 19 (0.5%) | $0 |
| 7+ Person Families | 8 (0.2%) | $0 |
| Total | 3,789 (100.0%) | $114,044 |
Family Income by Number of Earners in Williamstown
The median family income in Williamstown is $114,044, with families comprising 3+ earners (620) having the highest median family income of $217,500, while families with no earners (414) have the lowest median family income of $62,667, accounting for 16.4% and 10.9% of families, respectively.
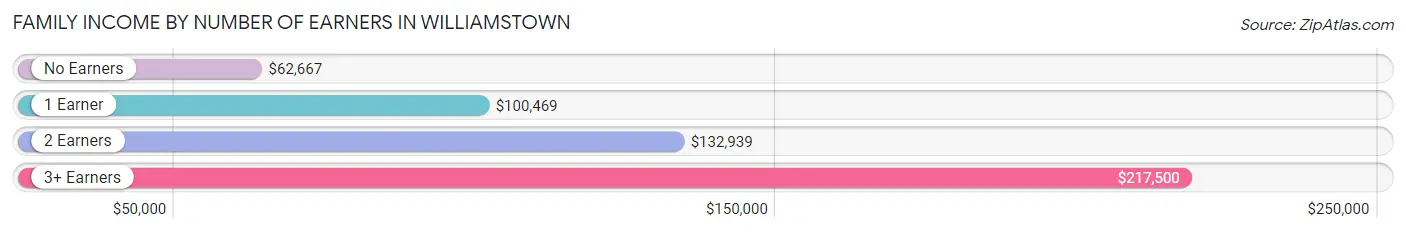
| Number of Earners | # Families | Median Income |
| No Earners | 414 (10.9%) | $62,667 |
| 1 Earner | 1,130 (29.8%) | $100,469 |
| 2 Earners | 1,625 (42.9%) | $132,939 |
| 3+ Earners | 620 (16.4%) | $217,500 |
| Total | 3,789 (100.0%) | $114,044 |
Household Income in Williamstown
Household Income Brackets in Williamstown
With 1,145 households falling in the category, the $100,000 to $149,999 income range is the most frequent in Williamstown, accounting for 20.5% of all households. In contrast, only 145 households (2.6%) fall into the $10,000 to $14,999 income bracket, making it the least populous group.
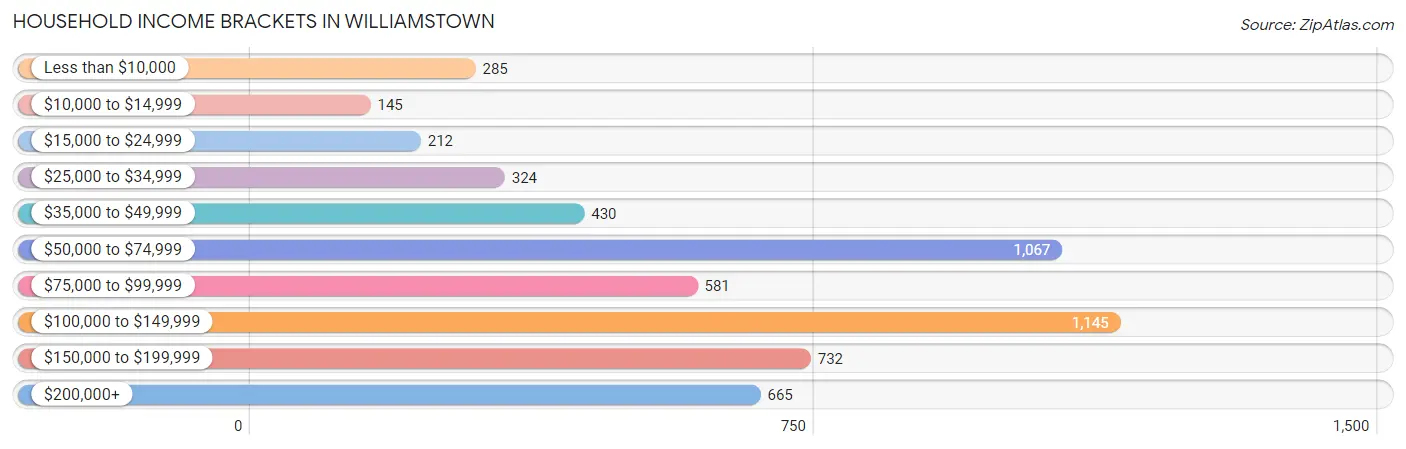
| Income Bracket | # Households | % Households |
| Less than $10,000 | 285 | 5.1% |
| $10,000 to $14,999 | 145 | 2.6% |
| $15,000 to $24,999 | 212 | 3.8% |
| $25,000 to $34,999 | 324 | 5.8% |
| $35,000 to $49,999 | 430 | 7.7% |
| $50,000 to $74,999 | 1,067 | 19.1% |
| $75,000 to $99,999 | 581 | 10.4% |
| $100,000 to $149,999 | 1,145 | 20.5% |
| $150,000 to $199,999 | 732 | 13.1% |
| $200,000+ | 665 | 11.9% |
Household Income by Householder Age in Williamstown
The median household income in Williamstown is $89,567, with the highest median household income of $121,694 found in the 45 to 64 years age bracket for the primary householder. A total of 2,264 households (40.5%) fall into this category. Meanwhile, the 15 to 24 years age bracket for the primary householder has the lowest median household income of $0, with 24 households (0.4%) in this group.
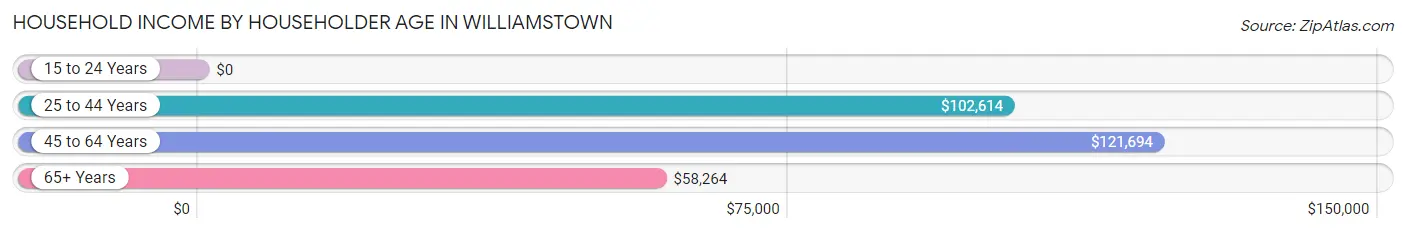
| Income Bracket | # Households | Median Income |
| 15 to 24 Years | 24 (0.4%) | $0 |
| 25 to 44 Years | 1,713 (30.7%) | $102,614 |
| 45 to 64 Years | 2,264 (40.5%) | $121,694 |
| 65+ Years | 1,584 (28.4%) | $58,264 |
| Total | 5,585 (100.0%) | $89,567 |
Poverty in Williamstown
Income Below Poverty by Sex and Age in Williamstown
With 3.7% poverty level for males and 7.8% for females among the residents of Williamstown, 25 to 34 year old males and 16 and 17 year old females are the most vulnerable to poverty, with 58 males (9.3%) and 27 females (20.0%) in their respective age groups living below the poverty level.
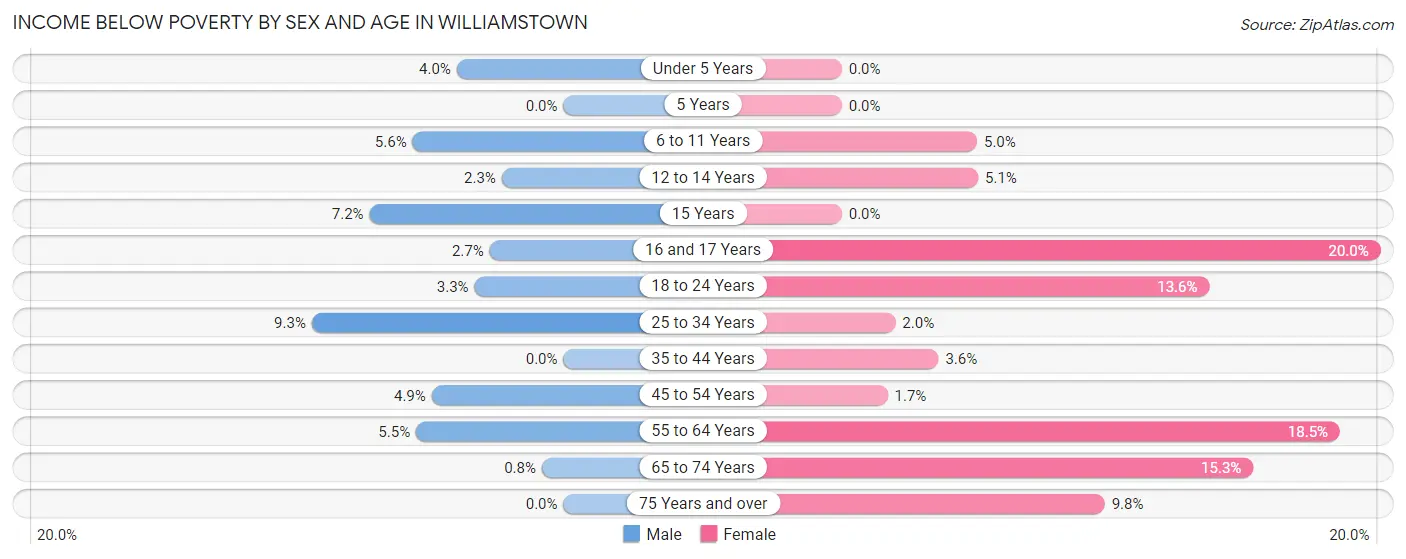
| Age Bracket | Male | Female |
| Under 5 Years | 11 (4.0%) | 0 (0.0%) |
| 5 Years | 0 (0.0%) | 0 (0.0%) |
| 6 to 11 Years | 29 (5.6%) | 37 (5.0%) |
| 12 to 14 Years | 3 (2.3%) | 12 (5.1%) |
| 15 Years | 9 (7.2%) | 0 (0.0%) |
| 16 and 17 Years | 4 (2.7%) | 27 (20.0%) |
| 18 to 24 Years | 21 (3.3%) | 90 (13.6%) |
| 25 to 34 Years | 58 (9.3%) | 21 (2.0%) |
| 35 to 44 Years | 0 (0.0%) | 36 (3.6%) |
| 45 to 54 Years | 51 (4.9%) | 17 (1.7%) |
| 55 to 64 Years | 49 (5.5%) | 196 (18.5%) |
| 65 to 74 Years | 5 (0.8%) | 122 (15.3%) |
| 75 Years and over | 0 (0.0%) | 69 (9.8%) |
| Total | 240 (3.7%) | 627 (7.8%) |
Income Above Poverty by Sex and Age in Williamstown
According to the poverty statistics in Williamstown, males aged 5 years and females aged under 5 years are the age groups that are most secure financially, with 100.0% of males and 100.0% of females in these age groups living above the poverty line.
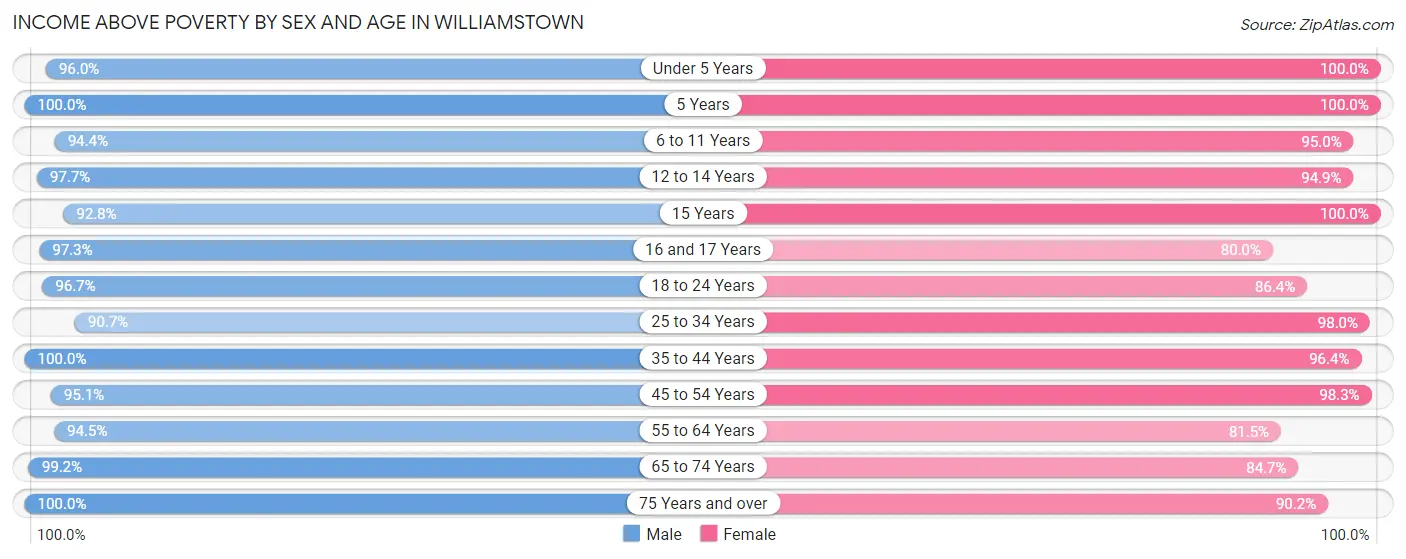
| Age Bracket | Male | Female |
| Under 5 Years | 267 (96.0%) | 420 (100.0%) |
| 5 Years | 186 (100.0%) | 43 (100.0%) |
| 6 to 11 Years | 489 (94.4%) | 700 (95.0%) |
| 12 to 14 Years | 128 (97.7%) | 225 (94.9%) |
| 15 Years | 116 (92.8%) | 211 (100.0%) |
| 16 and 17 Years | 142 (97.3%) | 108 (80.0%) |
| 18 to 24 Years | 616 (96.7%) | 570 (86.4%) |
| 25 to 34 Years | 563 (90.7%) | 1,034 (98.0%) |
| 35 to 44 Years | 1,043 (100.0%) | 966 (96.4%) |
| 45 to 54 Years | 991 (95.1%) | 984 (98.3%) |
| 55 to 64 Years | 847 (94.5%) | 864 (81.5%) |
| 65 to 74 Years | 623 (99.2%) | 677 (84.7%) |
| 75 Years and over | 296 (100.0%) | 638 (90.2%) |
| Total | 6,307 (96.3%) | 7,440 (92.2%) |
Income Below Poverty Among Married-Couple Families in Williamstown
The poverty statistics for married-couple families in Williamstown show that 0.8% or 23 of the total 2,987 families live below the poverty line. Families with no children have the highest poverty rate of 1.5%, comprising of 23 families. On the other hand, families with 1 or 2 children have the lowest poverty rate of 0.0%, which includes 0 families.
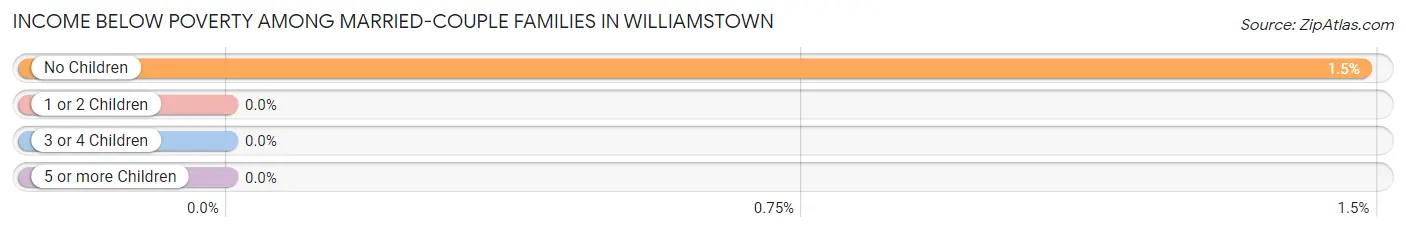
| Children | Above Poverty | Below Poverty |
| No Children | 1,531 (98.5%) | 23 (1.5%) |
| 1 or 2 Children | 1,185 (100.0%) | 0 (0.0%) |
| 3 or 4 Children | 248 (100.0%) | 0 (0.0%) |
| 5 or more Children | 0 (0.0%) | 0 (0.0%) |
| Total | 2,964 (99.2%) | 23 (0.8%) |
Income Below Poverty Among Single-Parent Households in Williamstown
According to the poverty data in Williamstown, 4.2% or 14 single-father households and 12.2% or 57 single-mother households are living below the poverty line. Among single-father households, those with no children have the highest poverty rate, with 14 households (7.1%) experiencing poverty. Likewise, among single-mother households, those with 1 or 2 children have the highest poverty rate, with 35 households (12.5%) falling below the poverty line.
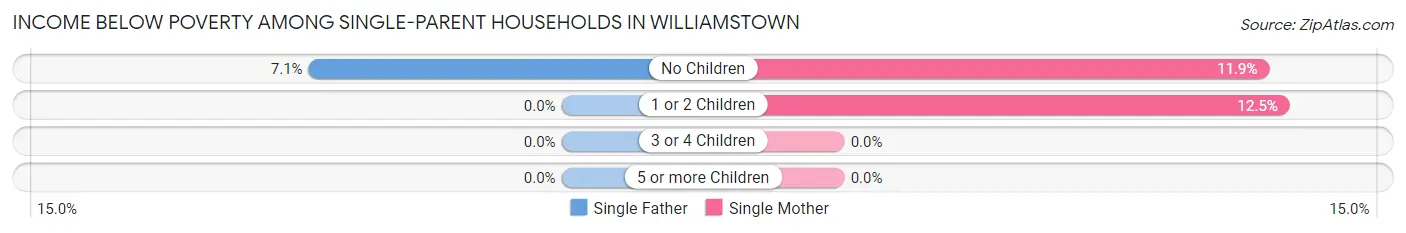
| Children | Single Father | Single Mother |
| No Children | 14 (7.1%) | 22 (11.9%) |
| 1 or 2 Children | 0 (0.0%) | 35 (12.5%) |
| 3 or 4 Children | 0 (0.0%) | 0 (0.0%) |
| 5 or more Children | 0 (0.0%) | 0 (0.0%) |
| Total | 14 (4.2%) | 57 (12.2%) |
Income Below Poverty Among Married-Couple vs Single-Parent Households in Williamstown
The poverty data for Williamstown shows that 23 of the married-couple family households (0.8%) and 71 of the single-parent households (8.8%) are living below the poverty level. Within the married-couple family households, those with no children have the highest poverty rate, with 23 households (1.5%) falling below the poverty line. Among the single-parent households, those with no children have the highest poverty rate, with 36 household (9.4%) living below poverty.
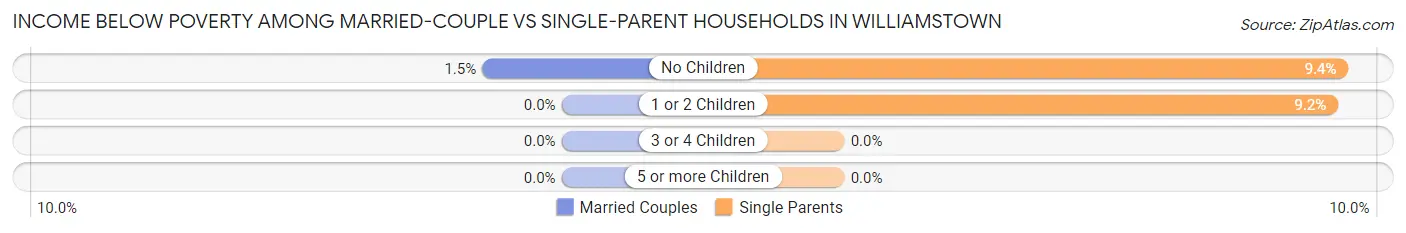
| Children | Married-Couple Families | Single-Parent Households |
| No Children | 23 (1.5%) | 36 (9.4%) |
| 1 or 2 Children | 0 (0.0%) | 35 (9.2%) |
| 3 or 4 Children | 0 (0.0%) | 0 (0.0%) |
| 5 or more Children | 0 (0.0%) | 0 (0.0%) |
| Total | 23 (0.8%) | 71 (8.8%) |
Race in Williamstown
The most populous races in Williamstown are White / Caucasian (12,065 | 81.7%), Black / African American (1,593 | 10.8%), and Two or more Races (871 | 5.9%).
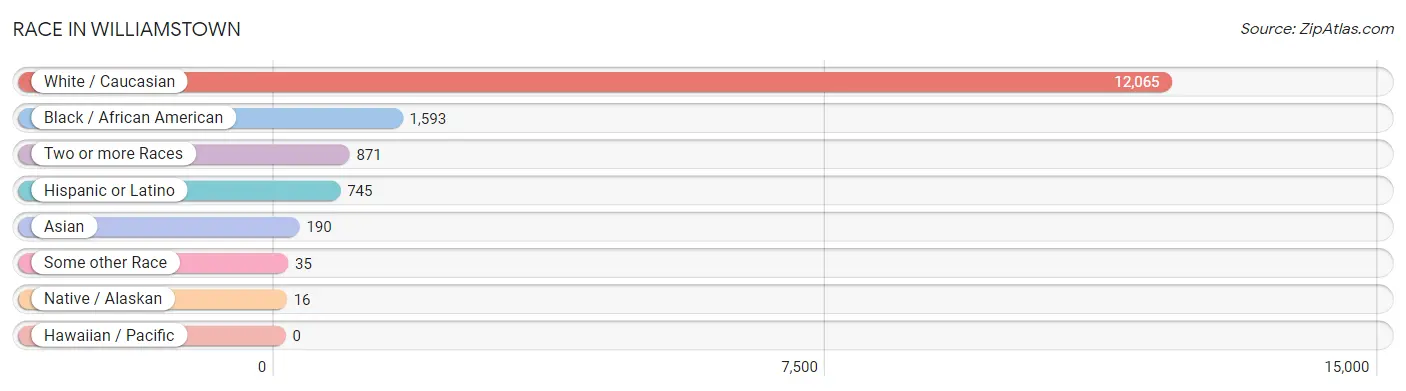
| Race | # Population | % Population |
| Asian | 190 | 1.3% |
| Black / African American | 1,593 | 10.8% |
| Hawaiian / Pacific | 0 | 0.0% |
| Hispanic or Latino | 745 | 5.0% |
| Native / Alaskan | 16 | 0.1% |
| White / Caucasian | 12,065 | 81.7% |
| Two or more Races | 871 | 5.9% |
| Some other Race | 35 | 0.2% |
| Total | 14,770 | 100.0% |
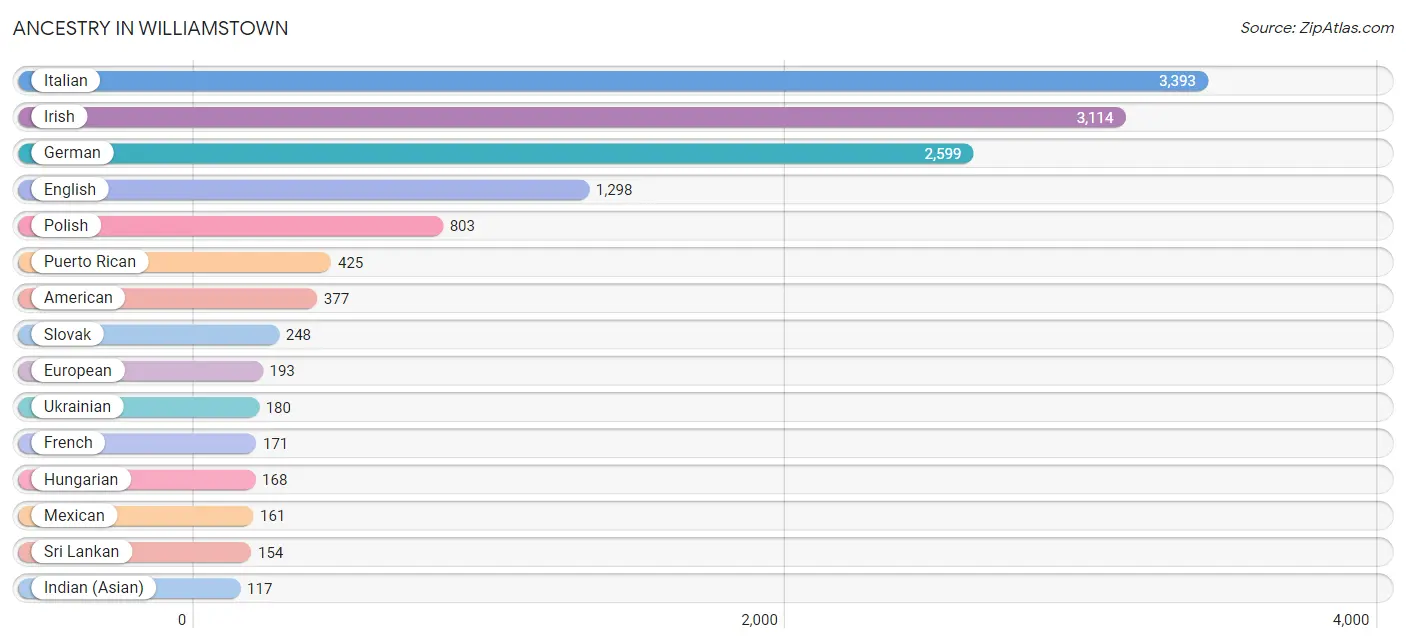
Ancestry in Williamstown
The most populous ancestries reported in Williamstown are Italian (3,393 | 23.0%), Irish (3,114 | 21.1%), German (2,599 | 17.6%), English (1,298 | 8.8%), and Polish (803 | 5.4%), together accounting for 75.9% of all Williamstown residents.
| Ancestry | # Population | % Population |
| African | 60 | 0.4% |
| American | 377 | 2.5% |
| Arab | 62 | 0.4% |
| Australian | 9 | 0.1% |
| Bhutanese | 101 | 0.7% |
| Brazilian | 51 | 0.4% |
| Burmese | 58 | 0.4% |
| Cherokee | 26 | 0.2% |
| Cuban | 45 | 0.3% |
| Czechoslovakian | 27 | 0.2% |
| Dominican | 14 | 0.1% |
| Dutch | 25 | 0.2% |
| Ecuadorian | 84 | 0.6% |
| English | 1,298 | 8.8% |
| European | 193 | 1.3% |
| French | 171 | 1.2% |
| French Canadian | 18 | 0.1% |
| German | 2,599 | 17.6% |
| Guyanese | 16 | 0.1% |
| Haitian | 84 | 0.6% |
| Hungarian | 168 | 1.1% |
| Indian (Asian) | 117 | 0.8% |
| Irish | 3,114 | 21.1% |
| Italian | 3,393 | 23.0% |
| Korean | 76 | 0.5% |
| Lebanese | 22 | 0.2% |
| Lithuanian | 60 | 0.4% |
| Mexican | 161 | 1.1% |
| Moroccan | 40 | 0.3% |
| Northern European | 11 | 0.1% |
| Norwegian | 63 | 0.4% |
| Pennsylvania German | 63 | 0.4% |
| Polish | 803 | 5.4% |
| Portuguese | 10 | 0.1% |
| Puerto Rican | 425 | 2.9% |
| Romanian | 36 | 0.2% |
| Russian | 88 | 0.6% |
| Scotch-Irish | 55 | 0.4% |
| Scottish | 47 | 0.3% |
| Slovak | 248 | 1.7% |
| Slovene | 11 | 0.1% |
| South American | 84 | 0.6% |
| South American Indian | 12 | 0.1% |
| Sri Lankan | 154 | 1.0% |
| Subsaharan African | 60 | 0.4% |
| Swedish | 77 | 0.5% |
| Turkish | 88 | 0.6% |
| Ukrainian | 180 | 1.2% |
| Welsh | 96 | 0.6% | View All 49 Rows |
Immigrants in Williamstown
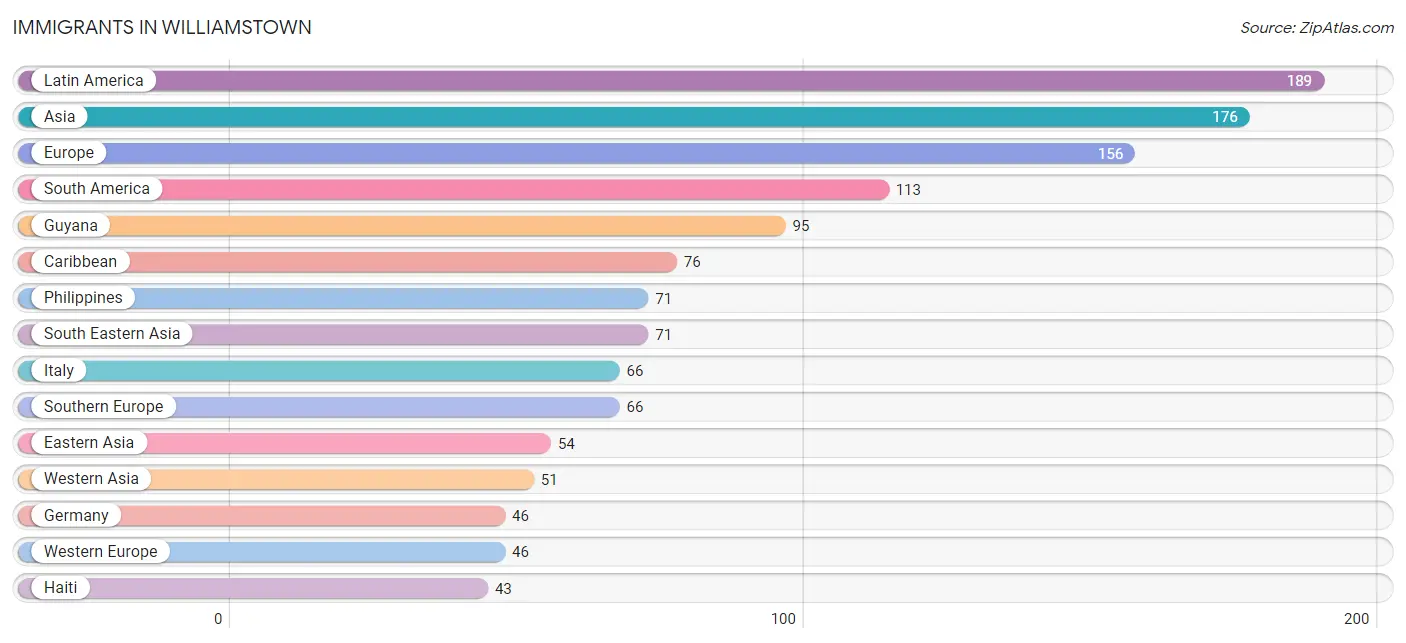
The most numerous immigrant groups reported in Williamstown came from Latin America (189 | 1.3%), Asia (176 | 1.2%), Europe (156 | 1.1%), South America (113 | 0.8%), and Guyana (95 | 0.6%), together accounting for 4.9% of all Williamstown residents.
| Immigration Origin | # Population | % Population |
| Asia | 176 | 1.2% |
| Australia | 9 | 0.1% |
| Canada | 10 | 0.1% |
| Caribbean | 76 | 0.5% |
| Cuba | 33 | 0.2% |
| Eastern Asia | 54 | 0.4% |
| Eastern Europe | 31 | 0.2% |
| Ecuador | 18 | 0.1% |
| Europe | 156 | 1.1% |
| Germany | 46 | 0.3% |
| Guyana | 95 | 0.6% |
| Haiti | 43 | 0.3% |
| Italy | 66 | 0.4% |
| Japan | 26 | 0.2% |
| Korea | 28 | 0.2% |
| Latin America | 189 | 1.3% |
| Northern Europe | 13 | 0.1% |
| Oceania | 9 | 0.1% |
| Philippines | 71 | 0.5% |
| Romania | 6 | 0.0% |
| Russia | 25 | 0.2% |
| South America | 113 | 0.8% |
| South Eastern Asia | 71 | 0.5% |
| Southern Europe | 66 | 0.4% |
| Turkey | 43 | 0.3% |
| Western Asia | 51 | 0.4% |
| Western Europe | 46 | 0.3% | View All 27 Rows |
Sex and Age in Williamstown
Sex and Age in Williamstown
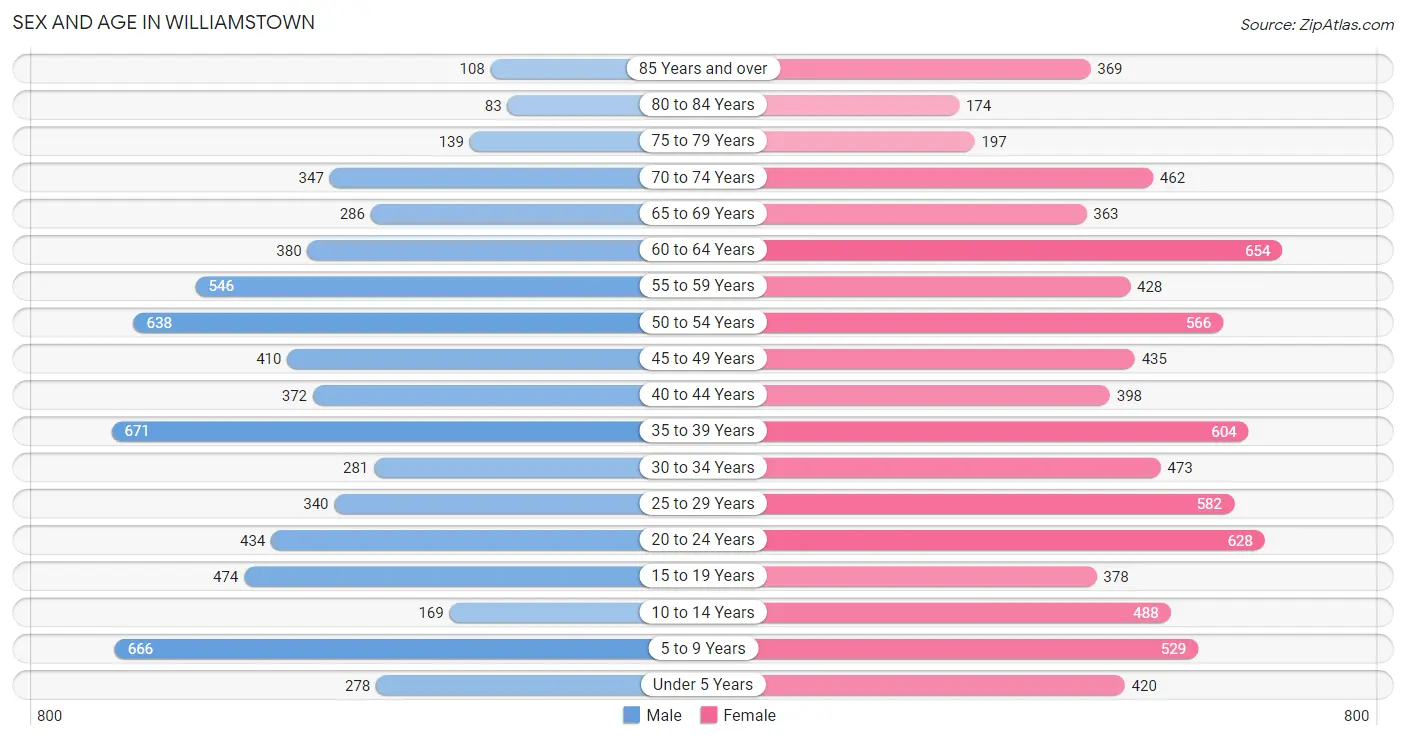
The most populous age groups in Williamstown are 35 to 39 Years (671 | 10.1%) for men and 60 to 64 Years (654 | 8.0%) for women.
| Age Bracket | Male | Female |
| Under 5 Years | 278 (4.2%) | 420 (5.1%) |
| 5 to 9 Years | 666 (10.1%) | 529 (6.5%) |
| 10 to 14 Years | 169 (2.5%) | 488 (6.0%) |
| 15 to 19 Years | 474 (7.2%) | 378 (4.6%) |
| 20 to 24 Years | 434 (6.6%) | 628 (7.7%) |
| 25 to 29 Years | 340 (5.1%) | 582 (7.1%) |
| 30 to 34 Years | 281 (4.2%) | 473 (5.8%) |
| 35 to 39 Years | 671 (10.1%) | 604 (7.4%) |
| 40 to 44 Years | 372 (5.6%) | 398 (4.9%) |
| 45 to 49 Years | 410 (6.2%) | 435 (5.3%) |
| 50 to 54 Years | 638 (9.6%) | 566 (7.0%) |
| 55 to 59 Years | 546 (8.3%) | 428 (5.2%) |
| 60 to 64 Years | 380 (5.7%) | 654 (8.0%) |
| 65 to 69 Years | 286 (4.3%) | 363 (4.5%) |
| 70 to 74 Years | 347 (5.2%) | 462 (5.7%) |
| 75 to 79 Years | 139 (2.1%) | 197 (2.4%) |
| 80 to 84 Years | 83 (1.3%) | 174 (2.1%) |
| 85 Years and over | 108 (1.6%) | 369 (4.5%) |
| Total | 6,622 (100.0%) | 8,148 (100.0%) |
Families and Households in Williamstown
Median Family Size in Williamstown
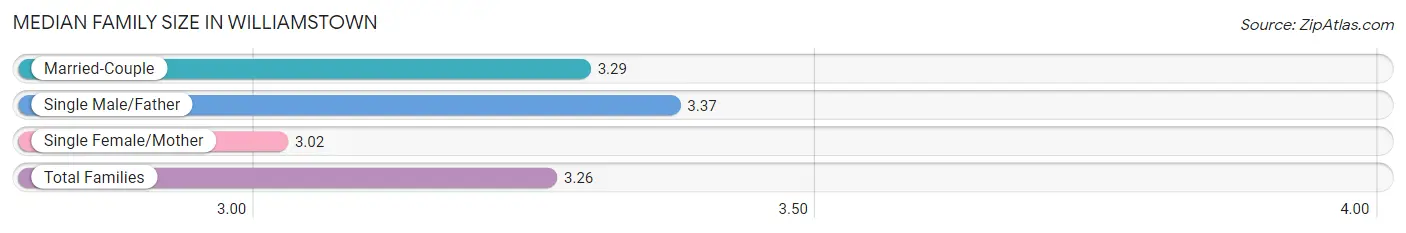
The median family size in Williamstown is 3.26 persons per family, with single male/father families (336 | 8.9%) accounting for the largest median family size of 3.37 persons per family. On the other hand, single female/mother families (466 | 12.3%) represent the smallest median family size with 3.02 persons per family.
| Family Type | # Families | Family Size |
| Married-Couple | 2,987 (78.8%) | 3.29 |
| Single Male/Father | 336 (8.9%) | 3.37 |
| Single Female/Mother | 466 (12.3%) | 3.02 |
| Total Families | 3,789 (100.0%) | 3.26 |
Median Household Size in Williamstown
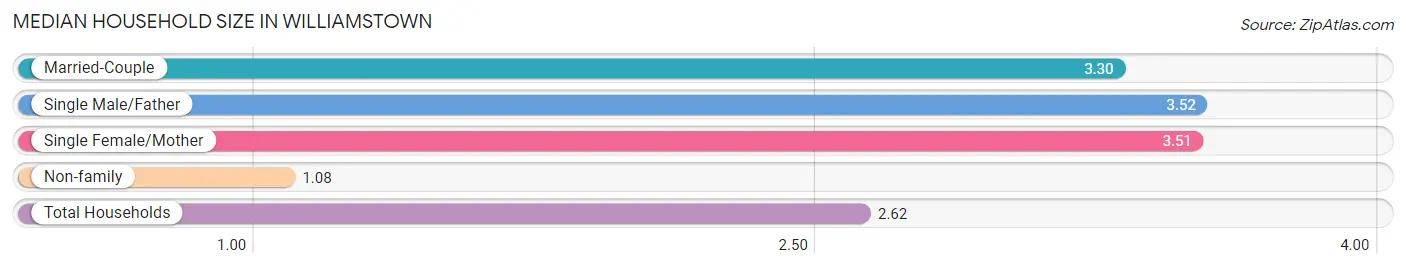
The median household size in Williamstown is 2.62 persons per household, with single male/father households (336 | 6.0%) accounting for the largest median household size of 3.52 persons per household. non-family households (1,796 | 32.2%) represent the smallest median household size with 1.08 persons per household.
| Household Type | # Households | Household Size |
| Married-Couple | 2,987 (53.5%) | 3.30 |
| Single Male/Father | 336 (6.0%) | 3.52 |
| Single Female/Mother | 466 (8.3%) | 3.51 |
| Non-family | 1,796 (32.2%) | 1.08 |
| Total Households | 5,585 (100.0%) | 2.62 |
Household Size by Marriage Status in Williamstown
Out of a total of 5,585 households in Williamstown, 3,789 (67.8%) are family households, while 1,796 (32.2%) are nonfamily households. The most numerous type of family households are 2-person households, comprising 1,343, and the most common type of nonfamily households are 1-person households, comprising 1,668.
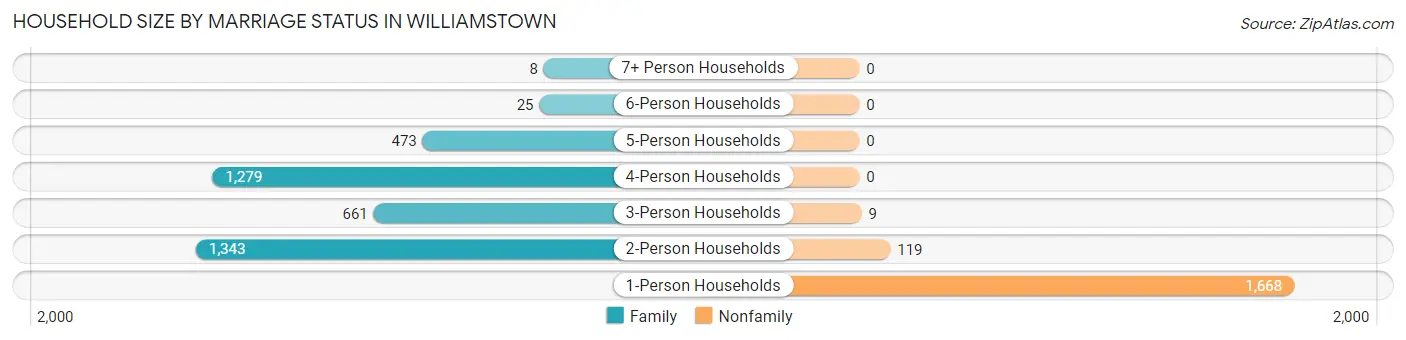
| Household Size | Family Households | Nonfamily Households |
| 1-Person Households | - | 1,668 (29.9%) |
| 2-Person Households | 1,343 (24.0%) | 119 (2.1%) |
| 3-Person Households | 661 (11.8%) | 9 (0.2%) |
| 4-Person Households | 1,279 (22.9%) | 0 (0.0%) |
| 5-Person Households | 473 (8.5%) | 0 (0.0%) |
| 6-Person Households | 25 (0.4%) | 0 (0.0%) |
| 7+ Person Households | 8 (0.1%) | 0 (0.0%) |
| Total | 3,789 (67.8%) | 1,796 (32.2%) |
Female Fertility in Williamstown
Fertility by Age in Williamstown
Average fertility rate in Williamstown is 28.0 births per 1,000 women. Women in the age bracket of 20 to 34 years have the highest fertility rate with 42.0 births per 1,000 women. Women in the age bracket of 20 to 34 years acount for 69.3% of all women with births.
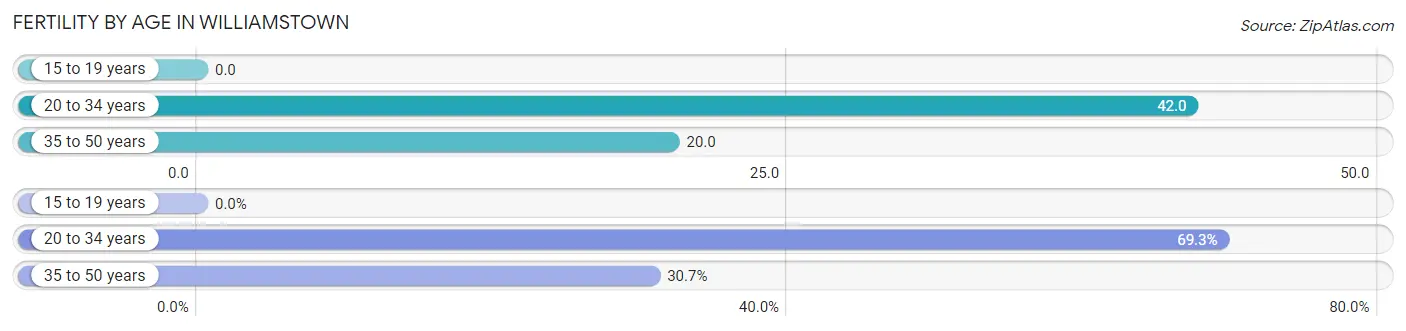
| Age Bracket | Women with Births | Births / 1,000 Women |
| 15 to 19 years | 0 (0.0%) | 0.0 |
| 20 to 34 years | 70 (69.3%) | 42.0 |
| 35 to 50 years | 31 (30.7%) | 20.0 |
| Total | 101 (100.0%) | 28.0 |
Fertility by Age by Marriage Status in Williamstown
41.6% of women with births (101) in Williamstown are married. The highest percentage of unmarried women with births falls into 35 to 50 years age bracket with 100.0% of them unmarried at the time of birth, while the lowest percentage of unmarried women with births belong to 20 to 34 years age bracket with 40.0% of them unmarried.
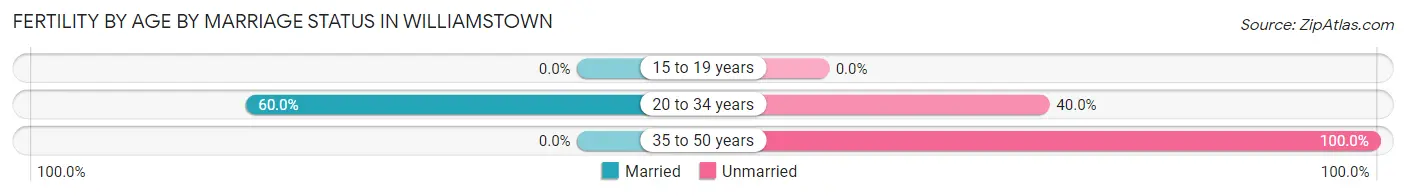
| Age Bracket | Married | Unmarried |
| 15 to 19 years | 0 (0.0%) | 0 (0.0%) |
| 20 to 34 years | 42 (60.0%) | 28 (40.0%) |
| 35 to 50 years | 0 (0.0%) | 31 (100.0%) |
| Total | 42 (41.6%) | 59 (58.4%) |
Fertility by Education in Williamstown
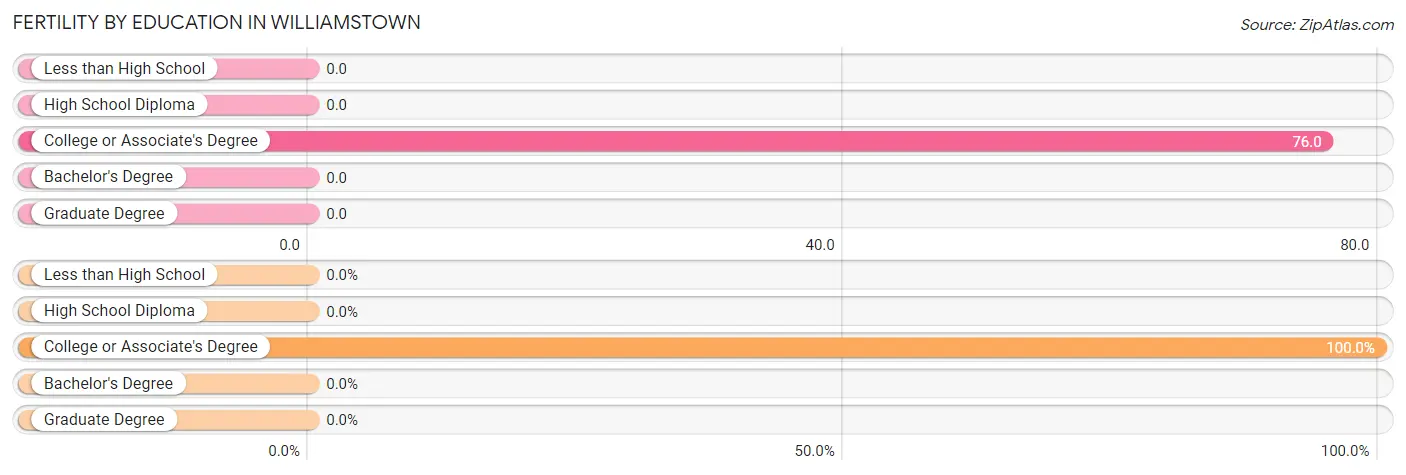
| Educational Attainment | Women with Births | Births / 1,000 Women |
| Less than High School | 0 (0.0%) | 0.0 |
| High School Diploma | 0 (0.0%) | 0.0 |
| College or Associate's Degree | 101 (100.0%) | 76.0 |
| Bachelor's Degree | 0 (0.0%) | 0.0 |
| Graduate Degree | 0 (0.0%) | 0.0 |
| Total | 101 (100.0%) | 28.0 |
Fertility by Education by Marriage Status in Williamstown
58.4% of women with births in Williamstown are unmarried. Women with the educational attainment of college or associate's degree are most likely to be married with 41.6% of them married at childbirth, while women with the educational attainment of college or associate's degree are least likely to be married with 58.4% of them unmarried at childbirth.
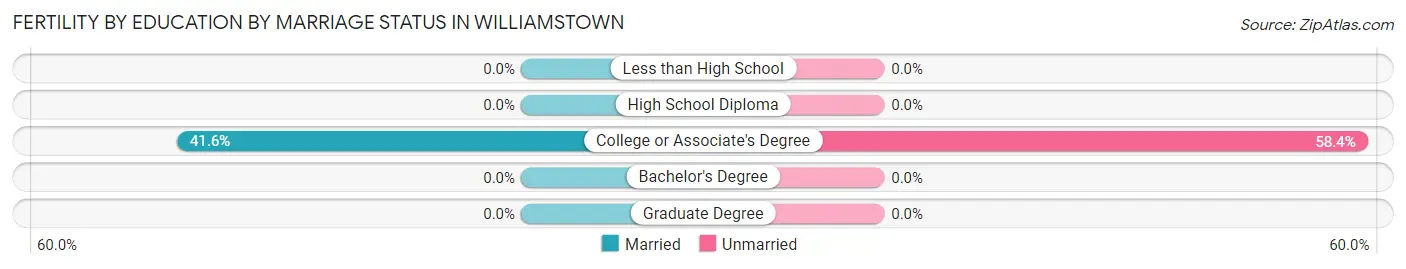
| Educational Attainment | Married | Unmarried |
| Less than High School | 0 (0.0%) | 0 (0.0%) |
| High School Diploma | 0 (0.0%) | 0 (0.0%) |
| College or Associate's Degree | 42 (41.6%) | 59 (58.4%) |
| Bachelor's Degree | 0 (0.0%) | 0 (0.0%) |
| Graduate Degree | 0 (0.0%) | 0 (0.0%) |
| Total | 42 (41.6%) | 59 (58.4%) |
Employment Characteristics in Williamstown
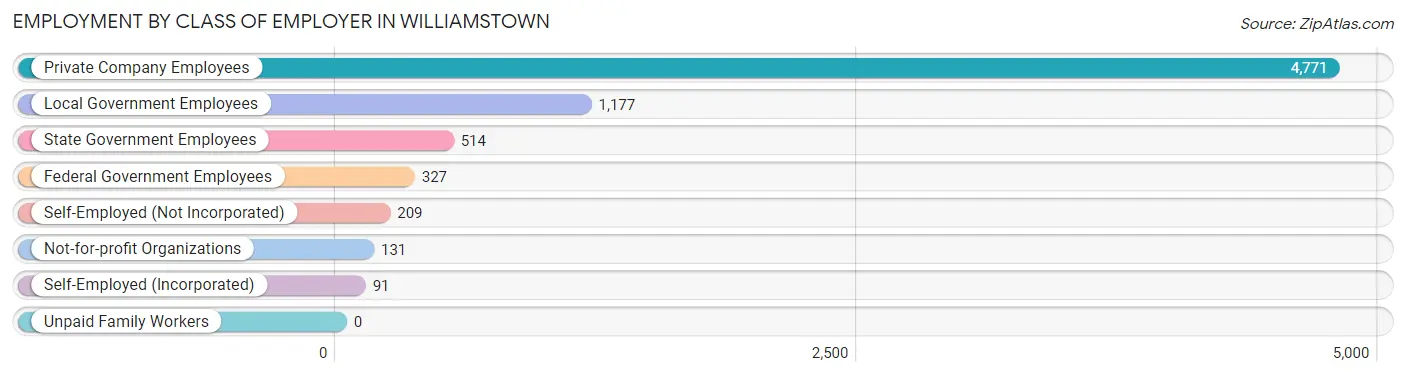
Employment by Class of Employer in Williamstown
Among the 7,220 employed individuals in Williamstown, private company employees (4,771 | 66.1%), local government employees (1,177 | 16.3%), and state government employees (514 | 7.1%) make up the most common classes of employment.
| Employer Class | # Employees | % Employees |
| Private Company Employees | 4,771 | 66.1% |
| Self-Employed (Incorporated) | 91 | 1.3% |
| Self-Employed (Not Incorporated) | 209 | 2.9% |
| Not-for-profit Organizations | 131 | 1.8% |
| Local Government Employees | 1,177 | 16.3% |
| State Government Employees | 514 | 7.1% |
| Federal Government Employees | 327 | 4.5% |
| Unpaid Family Workers | 0 | 0.0% |
| Total | 7,220 | 100.0% |
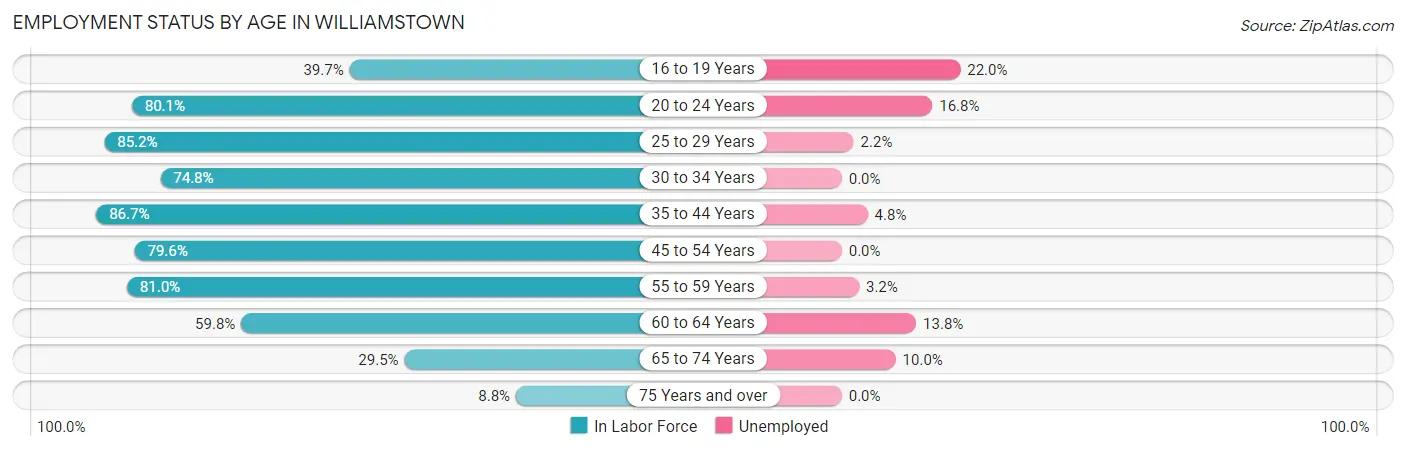
Employment Status by Age in Williamstown
According to the labor force statistics for Williamstown, out of the total population over 16 years of age (11,884), 65.1% or 7,736 individuals are in the labor force, with 5.7% or 441 of them unemployed. The age group with the highest labor force participation rate is 35 to 44 years, with 86.7% or 1,773 individuals in the labor force. Within the labor force, the 16 to 19 years age range has the highest percentage of unemployed individuals, with 22.0% or 45 of them being unemployed.
| Age Bracket | In Labor Force | Unemployed |
| 16 to 19 Years | 205 (39.7%) | 45 (22.0%) |
| 20 to 24 Years | 851 (80.1%) | 143 (16.8%) |
| 25 to 29 Years | 786 (85.2%) | 17 (2.2%) |
| 30 to 34 Years | 564 (74.8%) | 0 (0.0%) |
| 35 to 44 Years | 1,773 (86.7%) | 85 (4.8%) |
| 45 to 54 Years | 1,631 (79.6%) | 0 (0.0%) |
| 55 to 59 Years | 789 (81.0%) | 25 (3.2%) |
| 60 to 64 Years | 618 (59.8%) | 85 (13.8%) |
| 65 to 74 Years | 430 (29.5%) | 43 (10.0%) |
| 75 Years and over | 94 (8.8%) | 0 (0.0%) |
| Total | 7,736 (65.1%) | 441 (5.7%) |
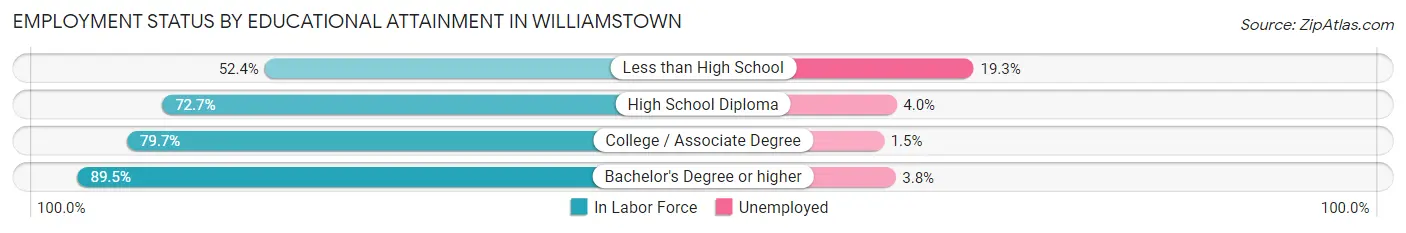
Employment Status by Educational Attainment in Williamstown
According to labor force statistics for Williamstown, 79.2% of individuals (6,160) out of the total population between 25 and 64 years of age (7,778) are in the labor force, with 3.5% or 216 of them being unemployed. The group with the highest labor force participation rate are those with the educational attainment of bachelor's degree or higher, with 89.5% or 1,985 individuals in the labor force. Within the labor force, individuals with less than high school education have the highest percentage of unemployment, with 19.3% or 36 of them being unemployed.
| Educational Attainment | In Labor Force | Unemployed |
| Less than High School | 187 (52.4%) | 69 (19.3%) |
| High School Diploma | 1,631 (72.7%) | 90 (4.0%) |
| College / Associate Degree | 2,359 (79.7%) | 44 (1.5%) |
| Bachelor's Degree or higher | 1,985 (89.5%) | 84 (3.8%) |
| Total | 6,160 (79.2%) | 272 (3.5%) |
Employment Occupations by Sex in Williamstown
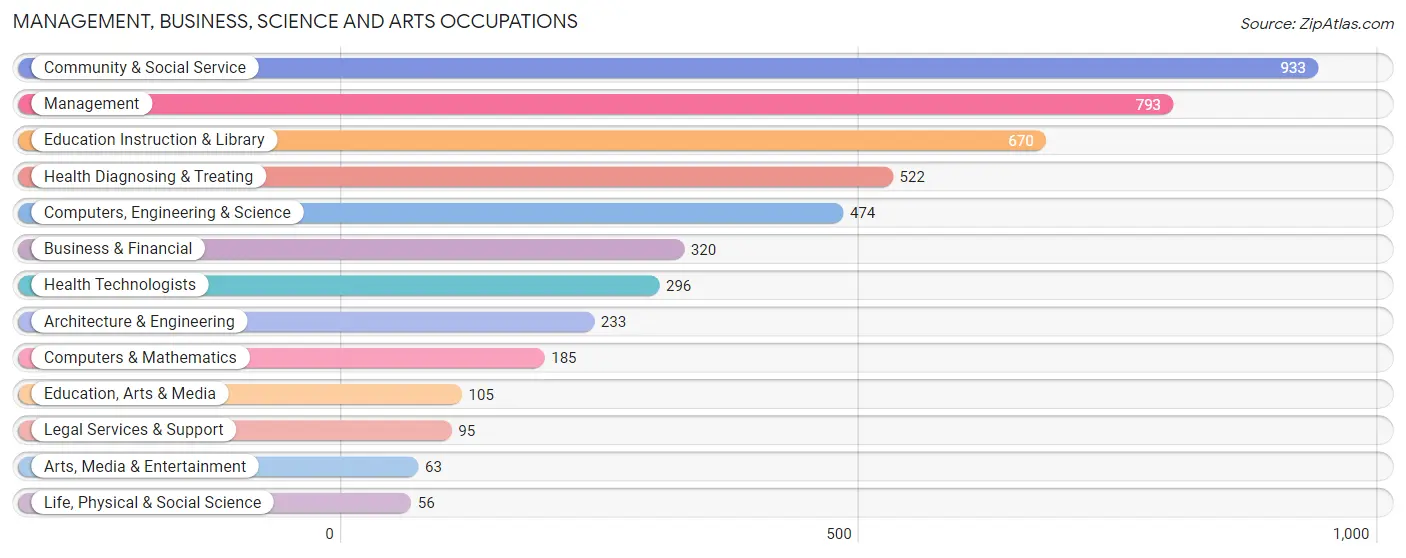
Management, Business, Science and Arts Occupations
The most common Management, Business, Science and Arts occupations in Williamstown are Community & Social Service (933 | 12.8%), Management (793 | 10.9%), Education Instruction & Library (670 | 9.2%), Health Diagnosing & Treating (522 | 7.2%), and Computers, Engineering & Science (474 | 6.5%).
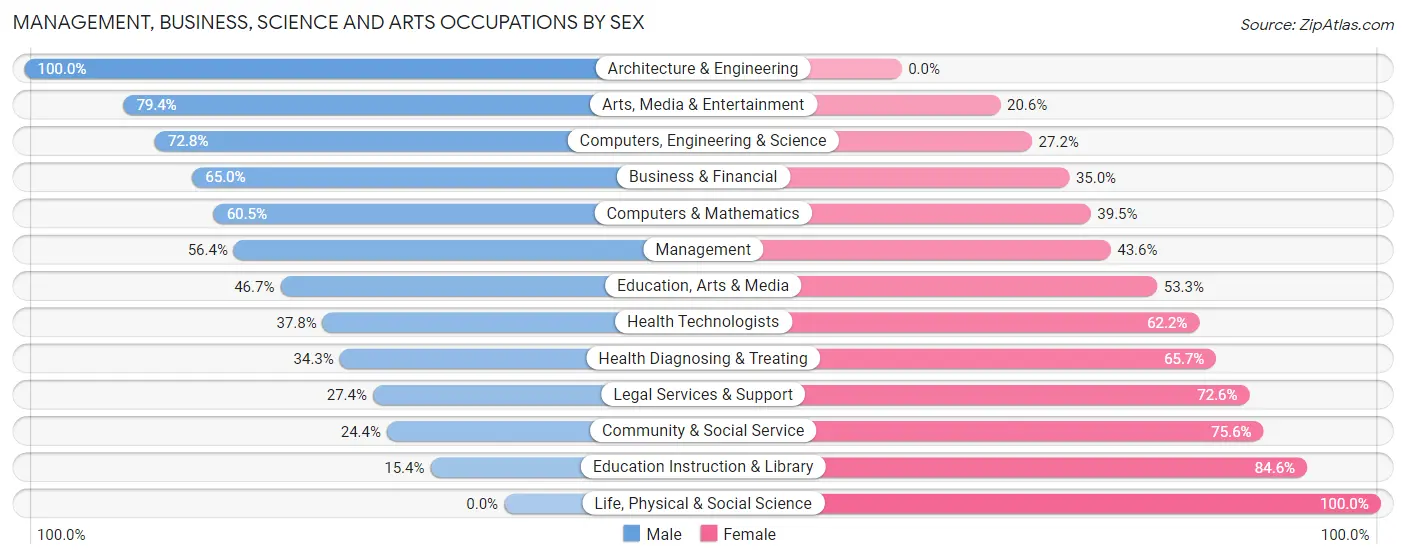
Management, Business, Science and Arts Occupations by Sex
Within the Management, Business, Science and Arts occupations in Williamstown, the most male-oriented occupations are Architecture & Engineering (100.0%), Arts, Media & Entertainment (79.4%), and Computers, Engineering & Science (72.8%), while the most female-oriented occupations are Life, Physical & Social Science (100.0%), Education Instruction & Library (84.6%), and Community & Social Service (75.6%).
| Occupation | Male | Female |
| Management | 447 (56.4%) | 346 (43.6%) |
| Business & Financial | 208 (65.0%) | 112 (35.0%) |
| Computers, Engineering & Science | 345 (72.8%) | 129 (27.2%) |
| Computers & Mathematics | 112 (60.5%) | 73 (39.5%) |
| Architecture & Engineering | 233 (100.0%) | 0 (0.0%) |
| Life, Physical & Social Science | 0 (0.0%) | 56 (100.0%) |
| Community & Social Service | 228 (24.4%) | 705 (75.6%) |
| Education, Arts & Media | 49 (46.7%) | 56 (53.3%) |
| Legal Services & Support | 26 (27.4%) | 69 (72.6%) |
| Education Instruction & Library | 103 (15.4%) | 567 (84.6%) |
| Arts, Media & Entertainment | 50 (79.4%) | 13 (20.6%) |
| Health Diagnosing & Treating | 179 (34.3%) | 343 (65.7%) |
| Health Technologists | 112 (37.8%) | 184 (62.2%) |
| Total (Category) | 1,407 (46.3%) | 1,635 (53.7%) |
| Total (Overall) | 3,794 (52.1%) | 3,483 (47.9%) |
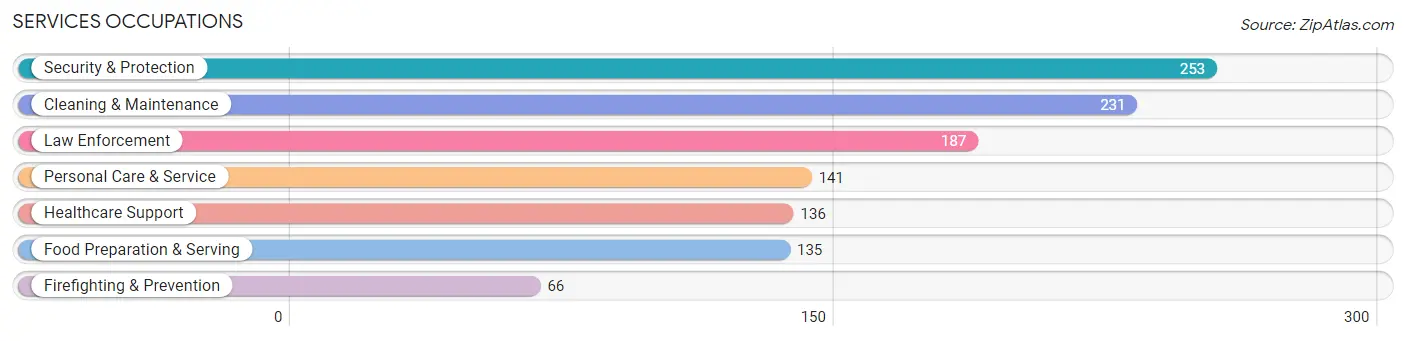
Services Occupations
The most common Services occupations in Williamstown are Security & Protection (253 | 3.5%), Cleaning & Maintenance (231 | 3.2%), Law Enforcement (187 | 2.6%), Personal Care & Service (141 | 1.9%), and Healthcare Support (136 | 1.9%).
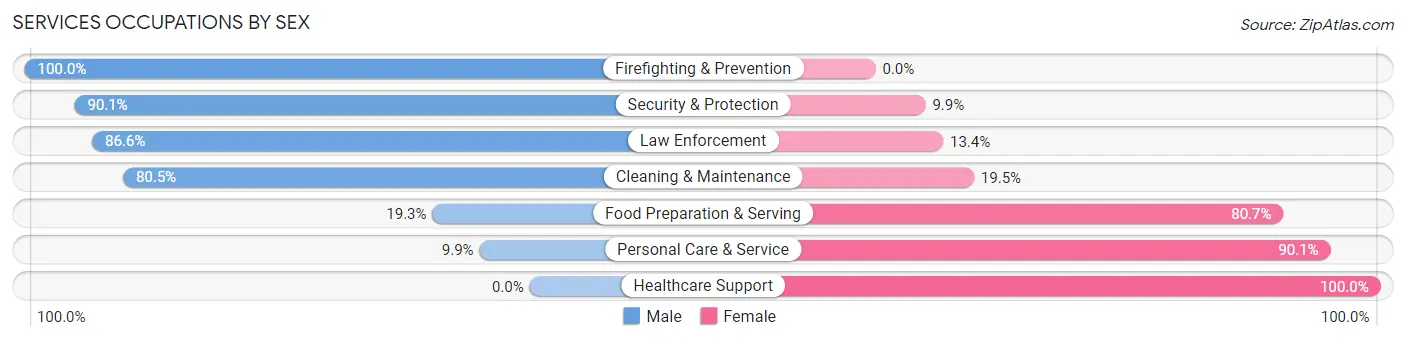
Services Occupations by Sex
Within the Services occupations in Williamstown, the most male-oriented occupations are Firefighting & Prevention (100.0%), Security & Protection (90.1%), and Law Enforcement (86.6%), while the most female-oriented occupations are Healthcare Support (100.0%), Personal Care & Service (90.1%), and Food Preparation & Serving (80.7%).
| Occupation | Male | Female |
| Healthcare Support | 0 (0.0%) | 136 (100.0%) |
| Security & Protection | 228 (90.1%) | 25 (9.9%) |
| Firefighting & Prevention | 66 (100.0%) | 0 (0.0%) |
| Law Enforcement | 162 (86.6%) | 25 (13.4%) |
| Food Preparation & Serving | 26 (19.3%) | 109 (80.7%) |
| Cleaning & Maintenance | 186 (80.5%) | 45 (19.5%) |
| Personal Care & Service | 14 (9.9%) | 127 (90.1%) |
| Total (Category) | 454 (50.7%) | 442 (49.3%) |
| Total (Overall) | 3,794 (52.1%) | 3,483 (47.9%) |
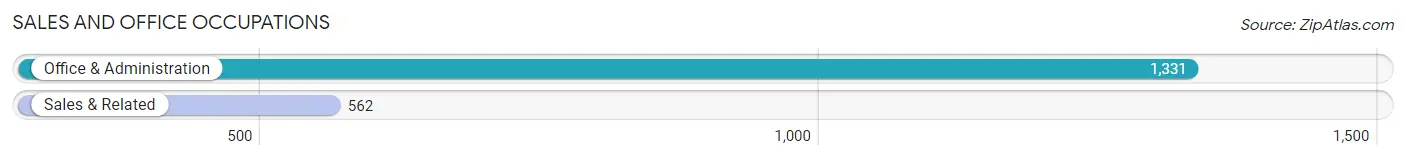
Sales and Office Occupations
The most common Sales and Office occupations in Williamstown are Office & Administration (1,331 | 18.3%), and Sales & Related (562 | 7.7%).
Sales and Office Occupations by Sex
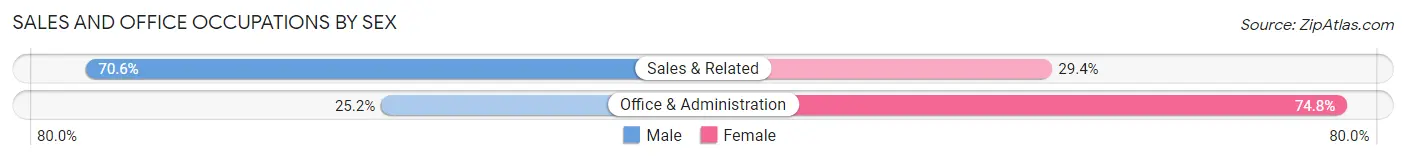
| Occupation | Male | Female |
| Sales & Related | 397 (70.6%) | 165 (29.4%) |
| Office & Administration | 335 (25.2%) | 996 (74.8%) |
| Total (Category) | 732 (38.7%) | 1,161 (61.3%) |
| Total (Overall) | 3,794 (52.1%) | 3,483 (47.9%) |
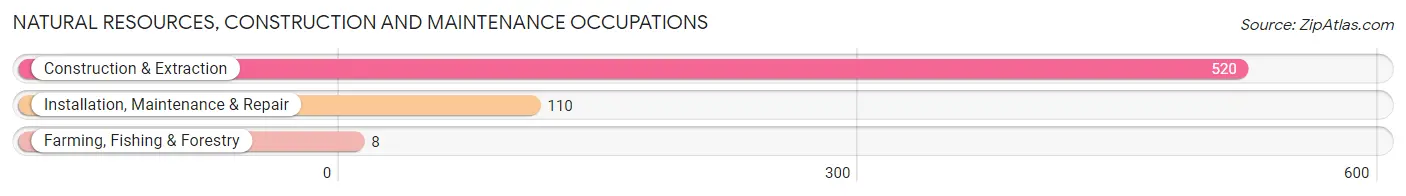
Natural Resources, Construction and Maintenance Occupations
The most common Natural Resources, Construction and Maintenance occupations in Williamstown are Construction & Extraction (520 | 7.1%), Installation, Maintenance & Repair (110 | 1.5%), and Farming, Fishing & Forestry (8 | 0.1%).
Natural Resources, Construction and Maintenance Occupations by Sex
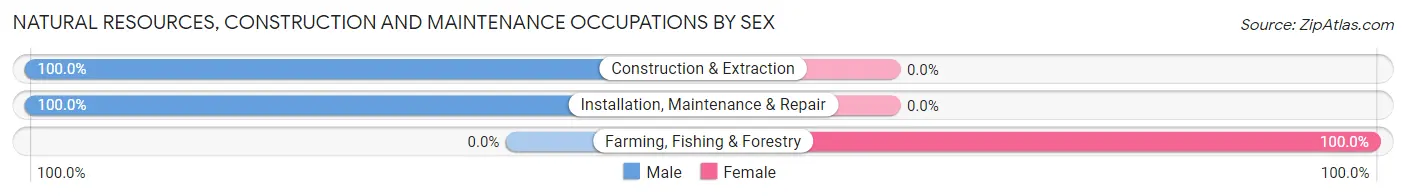
| Occupation | Male | Female |
| Farming, Fishing & Forestry | 0 (0.0%) | 8 (100.0%) |
| Construction & Extraction | 520 (100.0%) | 0 (0.0%) |
| Installation, Maintenance & Repair | 110 (100.0%) | 0 (0.0%) |
| Total (Category) | 630 (98.8%) | 8 (1.3%) |
| Total (Overall) | 3,794 (52.1%) | 3,483 (47.9%) |
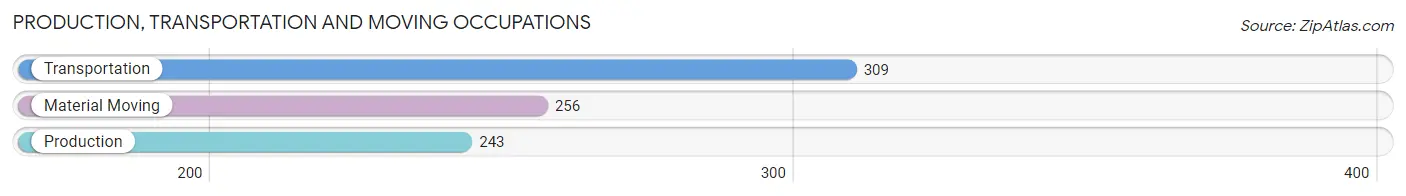
Production, Transportation and Moving Occupations
The most common Production, Transportation and Moving occupations in Williamstown are Transportation (309 | 4.3%), Material Moving (256 | 3.5%), and Production (243 | 3.3%).
Production, Transportation and Moving Occupations by Sex
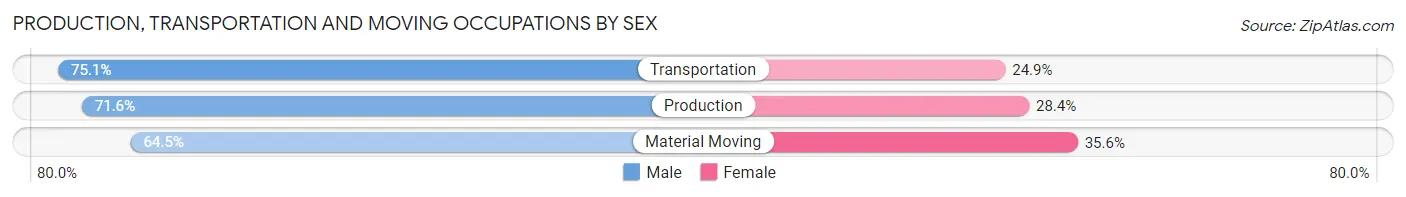
| Occupation | Male | Female |
| Production | 174 (71.6%) | 69 (28.4%) |
| Transportation | 232 (75.1%) | 77 (24.9%) |
| Material Moving | 165 (64.4%) | 91 (35.5%) |
| Total (Category) | 571 (70.7%) | 237 (29.3%) |
| Total (Overall) | 3,794 (52.1%) | 3,483 (47.9%) |
Employment Industries by Sex in Williamstown
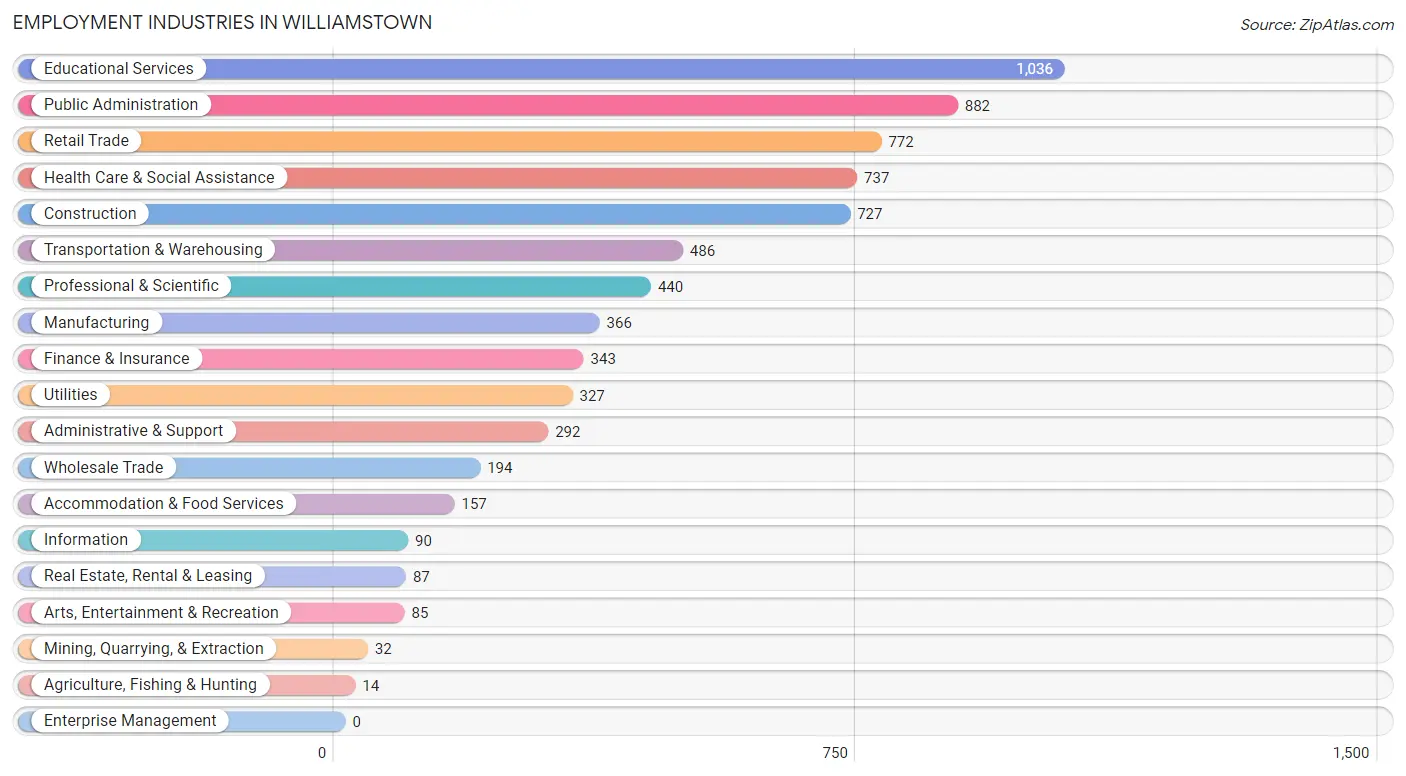
Employment Industries in Williamstown
The major employment industries in Williamstown include Educational Services (1,036 | 14.2%), Public Administration (882 | 12.1%), Retail Trade (772 | 10.6%), Health Care & Social Assistance (737 | 10.1%), and Construction (727 | 10.0%).
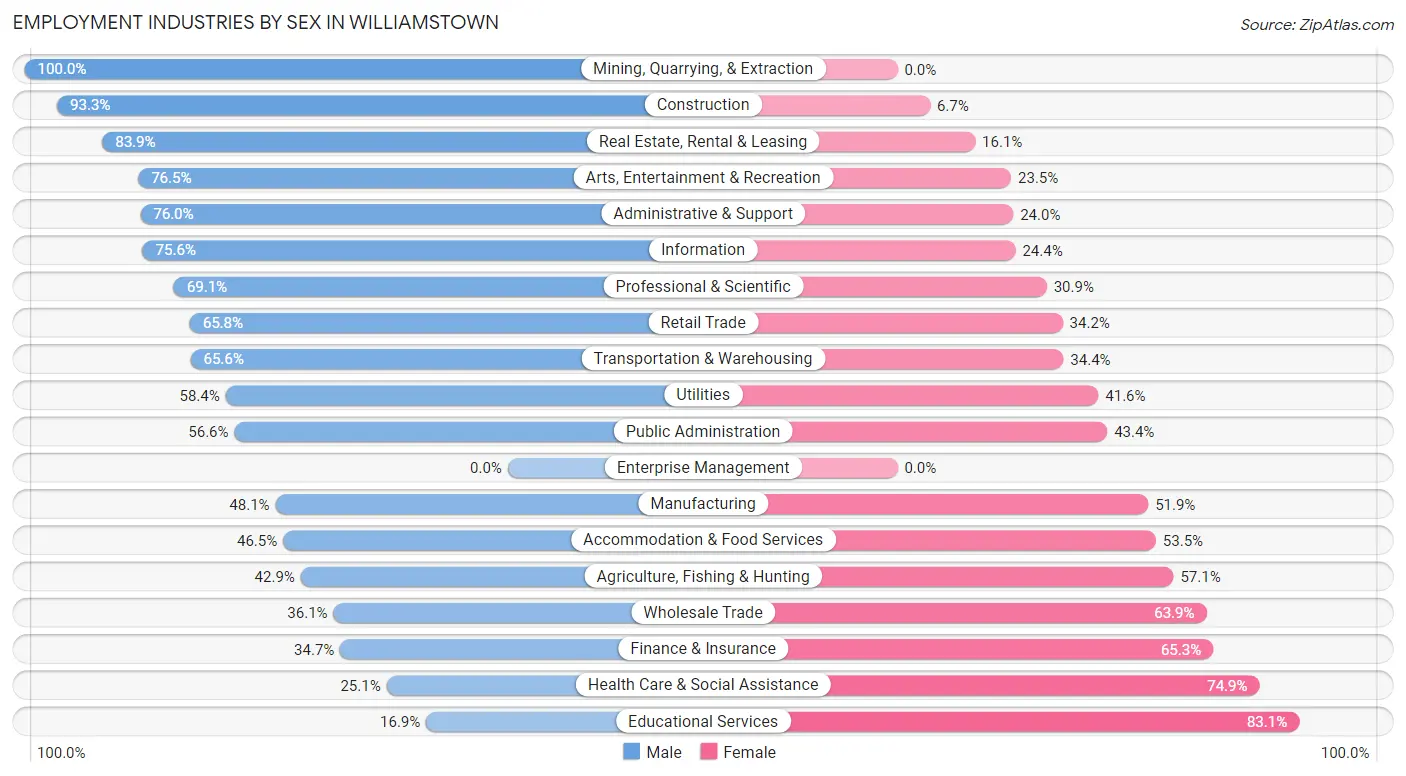
Employment Industries by Sex in Williamstown
The Williamstown industries that see more men than women are Mining, Quarrying, & Extraction (100.0%), Construction (93.3%), and Real Estate, Rental & Leasing (83.9%), whereas the industries that tend to have a higher number of women are Educational Services (83.1%), Health Care & Social Assistance (74.9%), and Finance & Insurance (65.3%).
| Industry | Male | Female |
| Agriculture, Fishing & Hunting | 6 (42.9%) | 8 (57.1%) |
| Mining, Quarrying, & Extraction | 32 (100.0%) | 0 (0.0%) |
| Construction | 678 (93.3%) | 49 (6.7%) |
| Manufacturing | 176 (48.1%) | 190 (51.9%) |
| Wholesale Trade | 70 (36.1%) | 124 (63.9%) |
| Retail Trade | 508 (65.8%) | 264 (34.2%) |
| Transportation & Warehousing | 319 (65.6%) | 167 (34.4%) |
| Utilities | 191 (58.4%) | 136 (41.6%) |
| Information | 68 (75.6%) | 22 (24.4%) |
| Finance & Insurance | 119 (34.7%) | 224 (65.3%) |
| Real Estate, Rental & Leasing | 73 (83.9%) | 14 (16.1%) |
| Professional & Scientific | 304 (69.1%) | 136 (30.9%) |
| Enterprise Management | 0 (0.0%) | 0 (0.0%) |
| Administrative & Support | 222 (76.0%) | 70 (24.0%) |
| Educational Services | 175 (16.9%) | 861 (83.1%) |
| Health Care & Social Assistance | 185 (25.1%) | 552 (74.9%) |
| Arts, Entertainment & Recreation | 65 (76.5%) | 20 (23.5%) |
| Accommodation & Food Services | 73 (46.5%) | 84 (53.5%) |
| Public Administration | 499 (56.6%) | 383 (43.4%) |
| Total | 3,794 (52.1%) | 3,483 (47.9%) |
Education in Williamstown
School Enrollment in Williamstown
The most common levels of schooling among the 3,952 students in Williamstown are college / undergraduate (1,094 | 27.7%), elementary school (731 | 18.5%), and high school (685 | 17.3%).
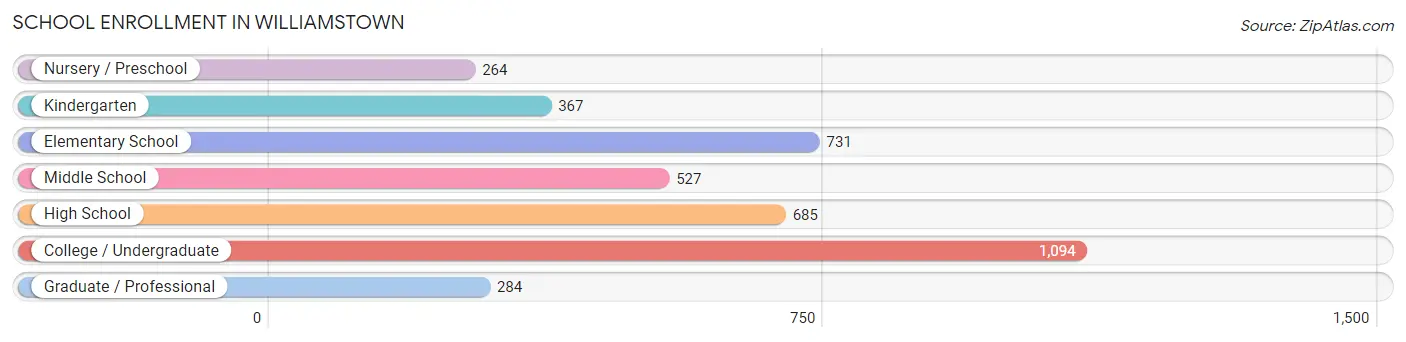
| School Level | # Students | % Students |
| Nursery / Preschool | 264 | 6.7% |
| Kindergarten | 367 | 9.3% |
| Elementary School | 731 | 18.5% |
| Middle School | 527 | 13.3% |
| High School | 685 | 17.3% |
| College / Undergraduate | 1,094 | 27.7% |
| Graduate / Professional | 284 | 7.2% |
| Total | 3,952 | 100.0% |
School Enrollment by Age by Funding Source in Williamstown
Out of a total of 3,952 students who are enrolled in schools in Williamstown, 486 (12.3%) attend a private institution, while the remaining 3,466 (87.7%) are enrolled in public schools. The age group of 3 to 4 year olds has the highest likelihood of being enrolled in private schools, with 108 (67.5% in the age bracket) enrolled. Conversely, the age group of 5 to 9 year old has the lowest likelihood of being enrolled in a private school, with 1,159 (97.0% in the age bracket) attending a public institution.
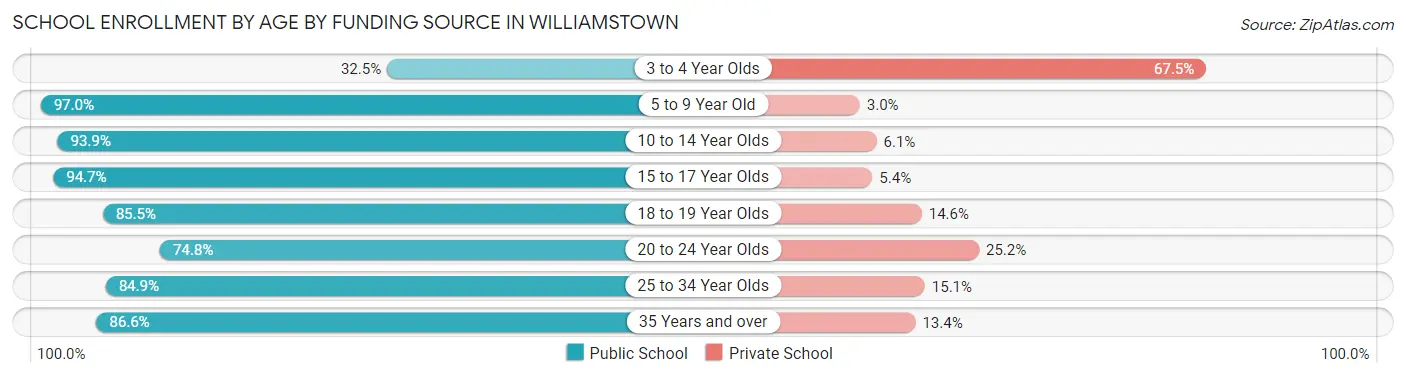
| Age Bracket | Public School | Private School |
| 3 to 4 Year Olds | 52 (32.5%) | 108 (67.5%) |
| 5 to 9 Year Old | 1,159 (97.0%) | 36 (3.0%) |
| 10 to 14 Year Olds | 551 (93.9%) | 36 (6.1%) |
| 15 to 17 Year Olds | 584 (94.7%) | 33 (5.3%) |
| 18 to 19 Year Olds | 141 (85.5%) | 24 (14.5%) |
| 20 to 24 Year Olds | 513 (74.8%) | 173 (25.2%) |
| 25 to 34 Year Olds | 219 (84.9%) | 39 (15.1%) |
| 35 Years and over | 246 (86.6%) | 38 (13.4%) |
| Total | 3,466 (87.7%) | 486 (12.3%) |
Educational Attainment by Field of Study in Williamstown
Business (468 | 16.0%), education (461 | 15.8%), science & technology (367 | 12.6%), engineering (299 | 10.2%), and arts & humanities (265 | 9.1%) are the most common fields of study among 2,924 individuals in Williamstown who have obtained a bachelor's degree or higher.
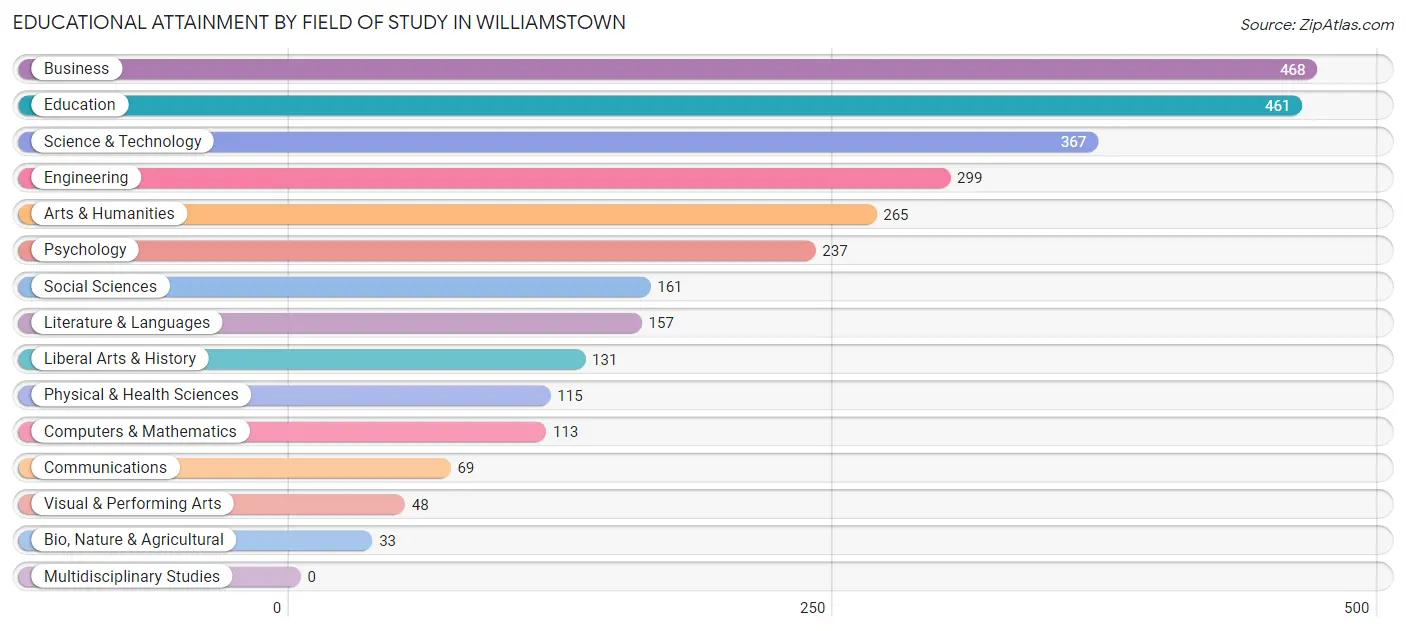
| Field of Study | # Graduates | % Graduates |
| Computers & Mathematics | 113 | 3.9% |
| Bio, Nature & Agricultural | 33 | 1.1% |
| Physical & Health Sciences | 115 | 3.9% |
| Psychology | 237 | 8.1% |
| Social Sciences | 161 | 5.5% |
| Engineering | 299 | 10.2% |
| Multidisciplinary Studies | 0 | 0.0% |
| Science & Technology | 367 | 12.6% |
| Business | 468 | 16.0% |
| Education | 461 | 15.8% |
| Literature & Languages | 157 | 5.4% |
| Liberal Arts & History | 131 | 4.5% |
| Visual & Performing Arts | 48 | 1.6% |
| Communications | 69 | 2.4% |
| Arts & Humanities | 265 | 9.1% |
| Total | 2,924 | 100.0% |
Transportation & Commute in Williamstown
Vehicle Availability by Sex in Williamstown
The most prevalent vehicle ownership categories in Williamstown are males with 2 vehicles (1,553, accounting for 40.7%) and females with 2 vehicles (1,241, making up 45.6%).
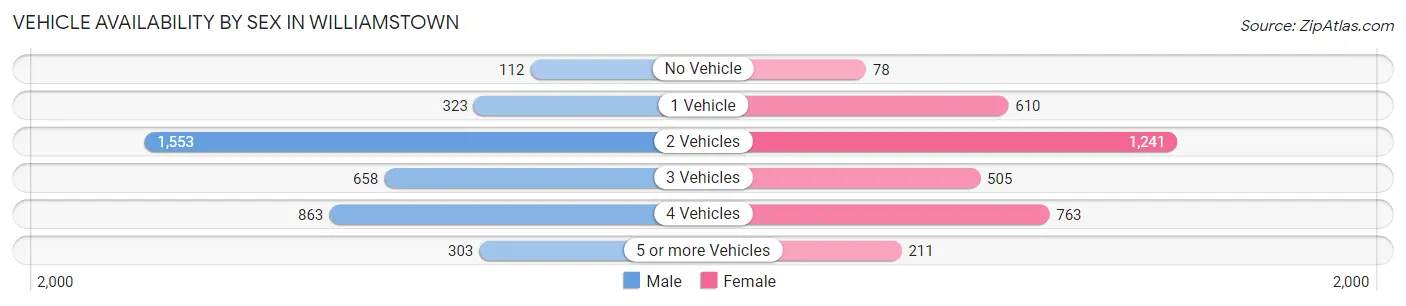
| Vehicles Available | Male | Female |
| No Vehicle | 112 (2.9%) | 78 (2.3%) |
| 1 Vehicle | 323 (8.5%) | 610 (17.9%) |
| 2 Vehicles | 1,553 (40.7%) | 1,241 (36.4%) |
| 3 Vehicles | 658 (17.3%) | 505 (14.8%) |
| 4 Vehicles | 863 (22.6%) | 763 (22.4%) |
| 5 or more Vehicles | 303 (8.0%) | 211 (6.2%) |
| Total | 3,812 (100.0%) | 3,408 (100.0%) |
Commute Time in Williamstown
The most frequently occuring commute durations in Williamstown are 30 to 34 minutes (1,285 commuters, 19.4%), 45 to 59 minutes (968 commuters, 14.6%), and 60 to 89 minutes (675 commuters, 10.2%).
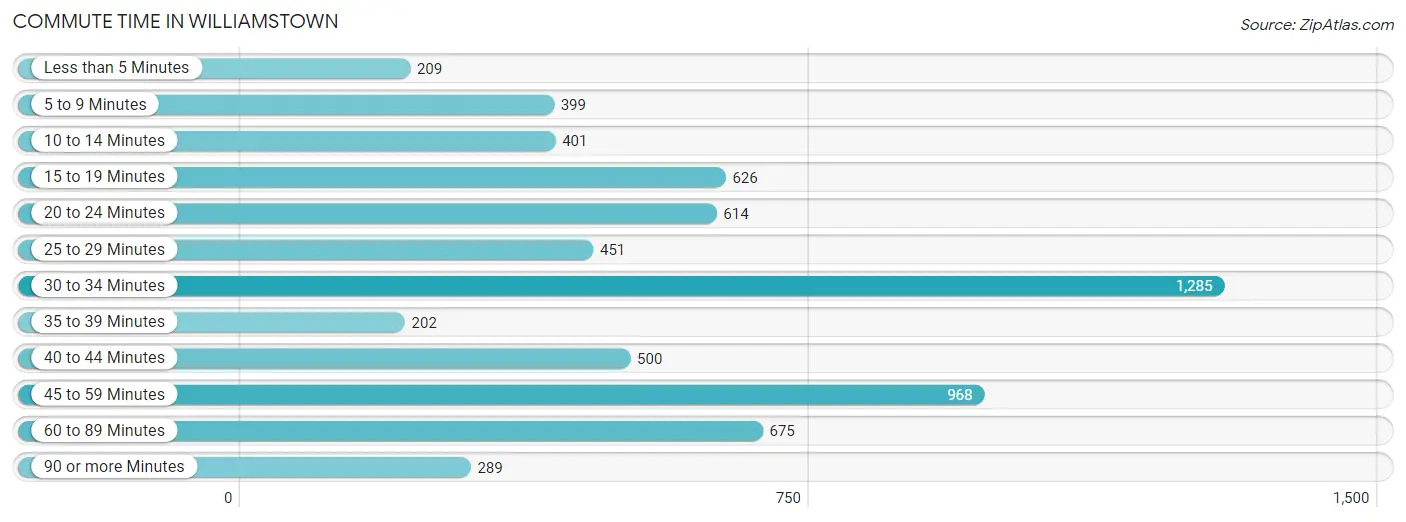
| Commute Time | # Commuters | % Commuters |
| Less than 5 Minutes | 209 | 3.2% |
| 5 to 9 Minutes | 399 | 6.0% |
| 10 to 14 Minutes | 401 | 6.1% |
| 15 to 19 Minutes | 626 | 9.5% |
| 20 to 24 Minutes | 614 | 9.3% |
| 25 to 29 Minutes | 451 | 6.8% |
| 30 to 34 Minutes | 1,285 | 19.4% |
| 35 to 39 Minutes | 202 | 3.0% |
| 40 to 44 Minutes | 500 | 7.5% |
| 45 to 59 Minutes | 968 | 14.6% |
| 60 to 89 Minutes | 675 | 10.2% |
| 90 or more Minutes | 289 | 4.4% |
Commute Time by Sex in Williamstown
The most common commute times in Williamstown are 45 to 59 minutes (741 commuters, 21.1%) for males and 30 to 34 minutes (930 commuters, 30.0%) for females.
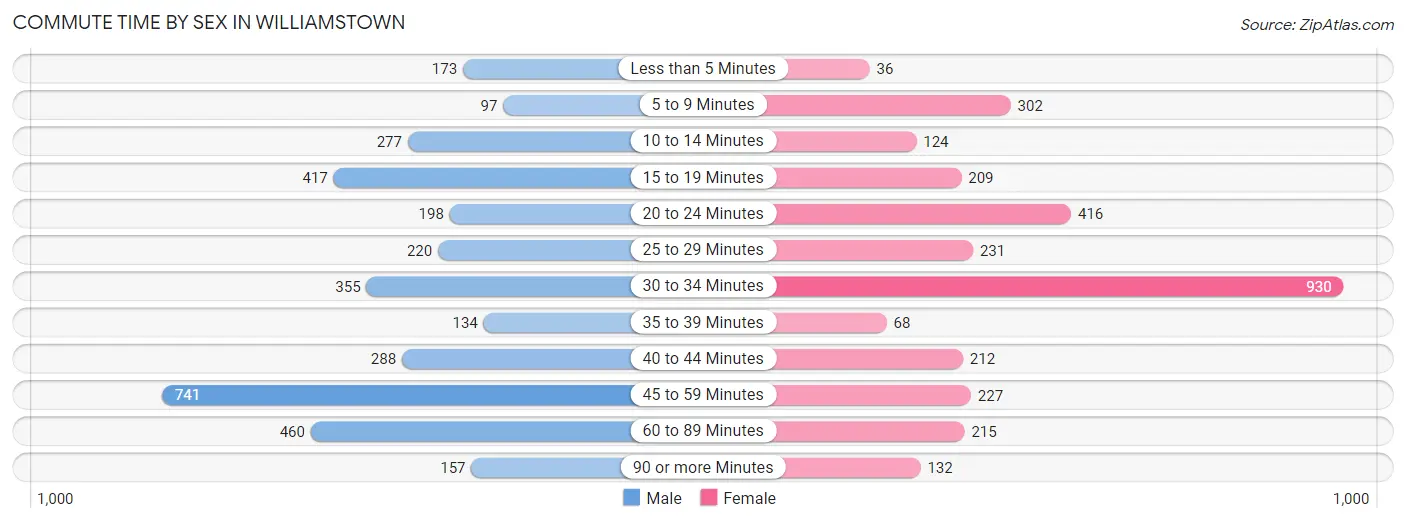
| Commute Time | Male | Female |
| Less than 5 Minutes | 173 (4.9%) | 36 (1.2%) |
| 5 to 9 Minutes | 97 (2.8%) | 302 (9.7%) |
| 10 to 14 Minutes | 277 (7.9%) | 124 (4.0%) |
| 15 to 19 Minutes | 417 (11.9%) | 209 (6.7%) |
| 20 to 24 Minutes | 198 (5.6%) | 416 (13.4%) |
| 25 to 29 Minutes | 220 (6.3%) | 231 (7.4%) |
| 30 to 34 Minutes | 355 (10.1%) | 930 (30.0%) |
| 35 to 39 Minutes | 134 (3.8%) | 68 (2.2%) |
| 40 to 44 Minutes | 288 (8.2%) | 212 (6.8%) |
| 45 to 59 Minutes | 741 (21.1%) | 227 (7.3%) |
| 60 to 89 Minutes | 460 (13.1%) | 215 (6.9%) |
| 90 or more Minutes | 157 (4.5%) | 132 (4.3%) |
Time of Departure to Work by Sex in Williamstown
The most frequent times of departure to work in Williamstown are 7:30 AM to 7:59 AM (620, 17.6%) for males and 7:30 AM to 7:59 AM (789, 25.4%) for females.
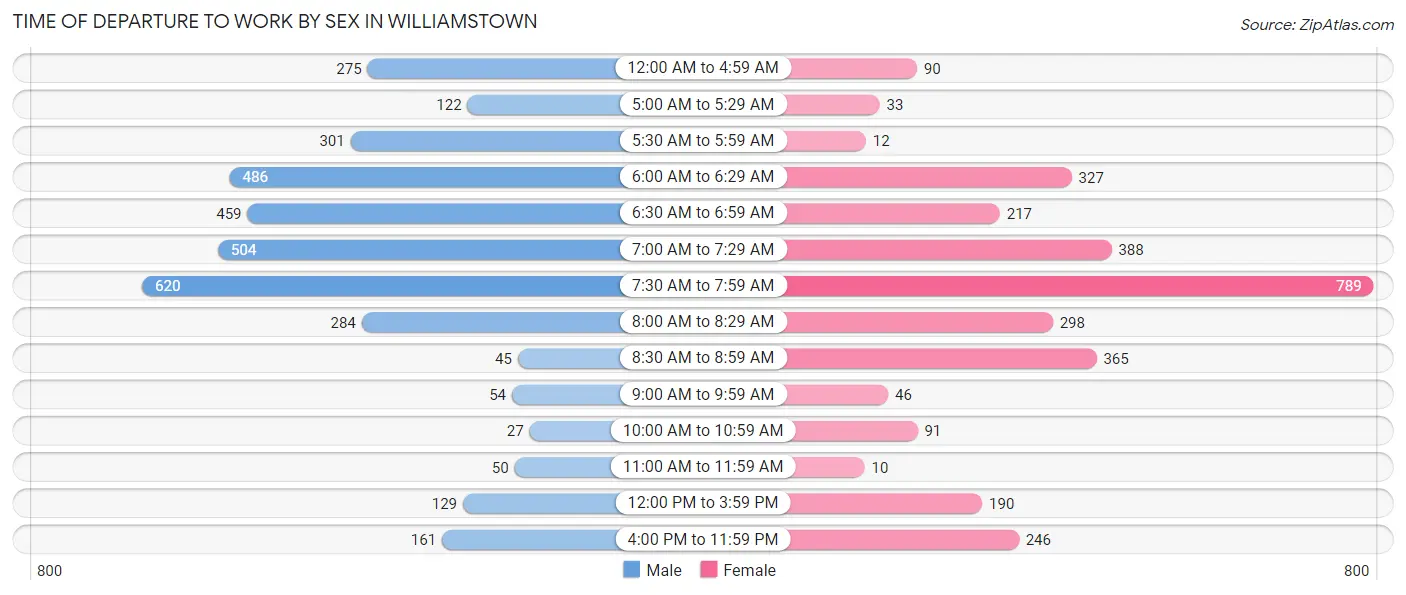
| Time of Departure | Male | Female |
| 12:00 AM to 4:59 AM | 275 (7.8%) | 90 (2.9%) |
| 5:00 AM to 5:29 AM | 122 (3.5%) | 33 (1.1%) |
| 5:30 AM to 5:59 AM | 301 (8.6%) | 12 (0.4%) |
| 6:00 AM to 6:29 AM | 486 (13.8%) | 327 (10.5%) |
| 6:30 AM to 6:59 AM | 459 (13.1%) | 217 (7.0%) |
| 7:00 AM to 7:29 AM | 504 (14.3%) | 388 (12.5%) |
| 7:30 AM to 7:59 AM | 620 (17.6%) | 789 (25.4%) |
| 8:00 AM to 8:29 AM | 284 (8.1%) | 298 (9.6%) |
| 8:30 AM to 8:59 AM | 45 (1.3%) | 365 (11.8%) |
| 9:00 AM to 9:59 AM | 54 (1.5%) | 46 (1.5%) |
| 10:00 AM to 10:59 AM | 27 (0.8%) | 91 (2.9%) |
| 11:00 AM to 11:59 AM | 50 (1.4%) | 10 (0.3%) |
| 12:00 PM to 3:59 PM | 129 (3.7%) | 190 (6.1%) |
| 4:00 PM to 11:59 PM | 161 (4.6%) | 246 (7.9%) |
| Total | 3,517 (100.0%) | 3,102 (100.0%) |
Housing Occupancy in Williamstown
Occupancy by Ownership in Williamstown
Of the total 5,585 dwellings in Williamstown, owner-occupied units account for 4,618 (82.7%), while renter-occupied units make up 967 (17.3%).
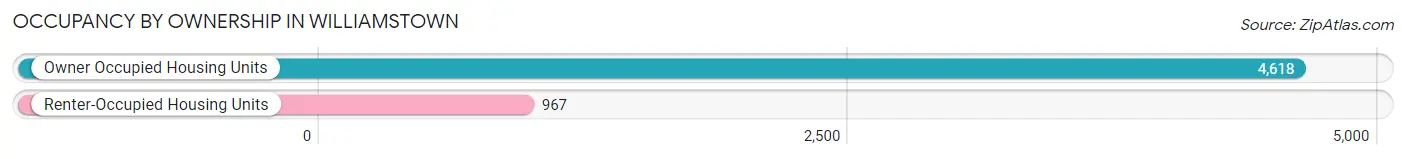
| Occupancy | # Housing Units | % Housing Units |
| Owner Occupied Housing Units | 4,618 | 82.7% |
| Renter-Occupied Housing Units | 967 | 17.3% |
| Total Occupied Housing Units | 5,585 | 100.0% |
Occupancy by Household Size in Williamstown
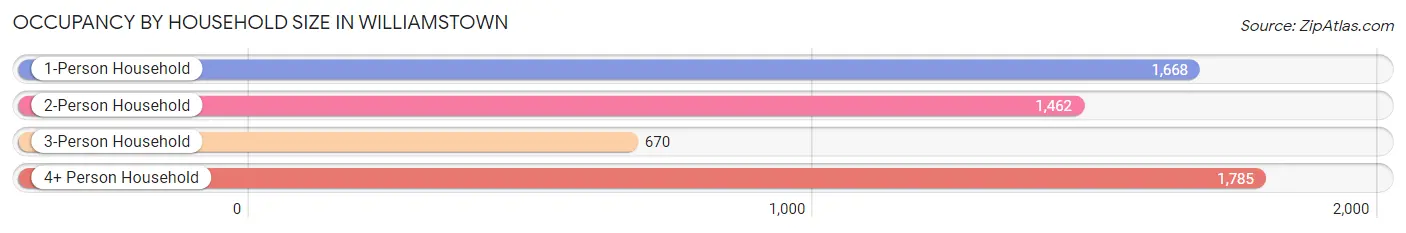
| Household Size | # Housing Units | % Housing Units |
| 1-Person Household | 1,668 | 29.9% |
| 2-Person Household | 1,462 | 26.2% |
| 3-Person Household | 670 | 12.0% |
| 4+ Person Household | 1,785 | 32.0% |
| Total Housing Units | 5,585 | 100.0% |
Occupancy by Ownership by Household Size in Williamstown
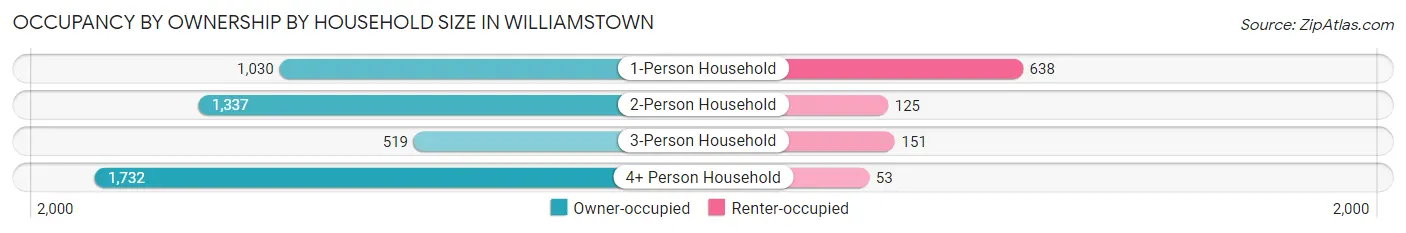
| Household Size | Owner-occupied | Renter-occupied |
| 1-Person Household | 1,030 (61.8%) | 638 (38.3%) |
| 2-Person Household | 1,337 (91.4%) | 125 (8.6%) |
| 3-Person Household | 519 (77.5%) | 151 (22.5%) |
| 4+ Person Household | 1,732 (97.0%) | 53 (3.0%) |
| Total Housing Units | 4,618 (82.7%) | 967 (17.3%) |
Occupancy by Educational Attainment in Williamstown
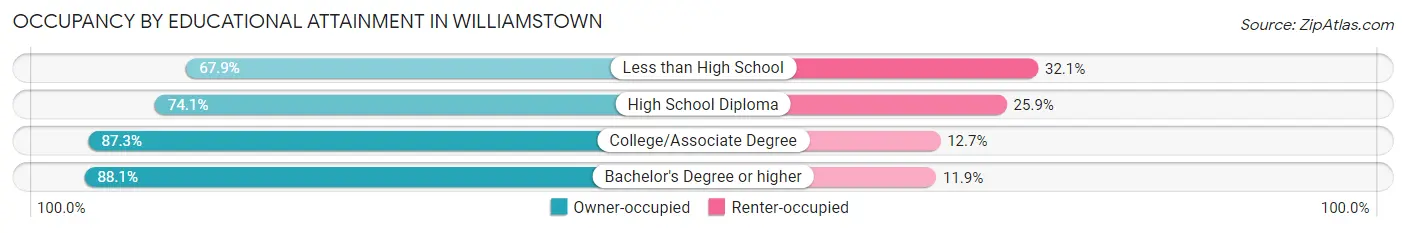
| Household Size | Owner-occupied | Renter-occupied |
| Less than High School | 91 (67.9%) | 43 (32.1%) |
| High School Diploma | 1,381 (74.1%) | 482 (25.9%) |
| College/Associate Degree | 1,670 (87.3%) | 243 (12.7%) |
| Bachelor's Degree or higher | 1,476 (88.1%) | 199 (11.9%) |
Occupancy by Age of Householder in Williamstown
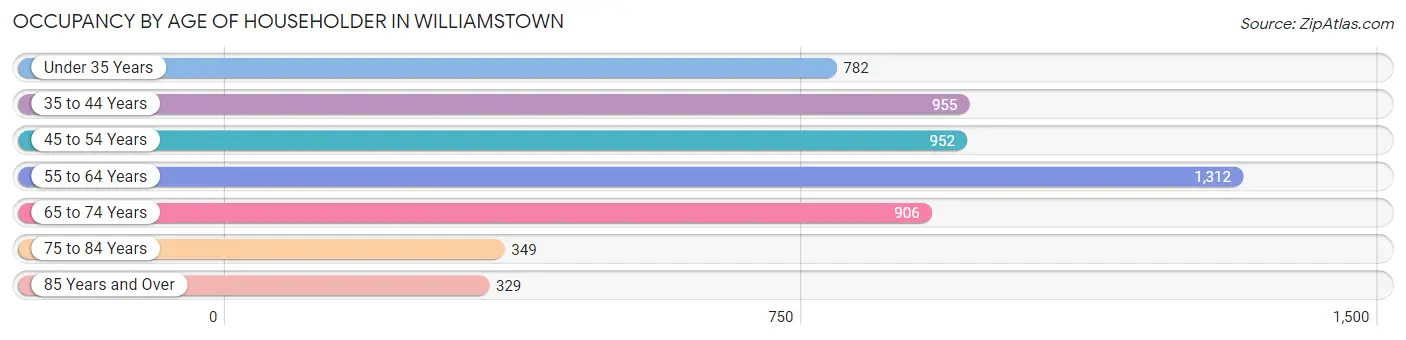
| Age Bracket | # Households | % Households |
| Under 35 Years | 782 | 14.0% |
| 35 to 44 Years | 955 | 17.1% |
| 45 to 54 Years | 952 | 17.1% |
| 55 to 64 Years | 1,312 | 23.5% |
| 65 to 74 Years | 906 | 16.2% |
| 75 to 84 Years | 349 | 6.2% |
| 85 Years and Over | 329 | 5.9% |
| Total | 5,585 | 100.0% |
Housing Finances in Williamstown
Median Income by Occupancy in Williamstown
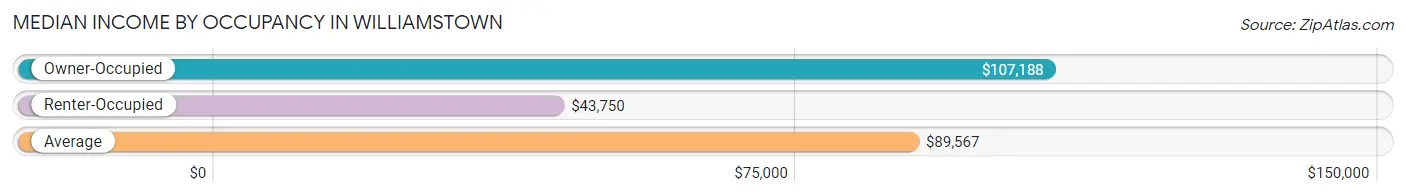
| Occupancy Type | # Households | Median Income |
| Owner-Occupied | 4,618 (82.7%) | $107,188 |
| Renter-Occupied | 967 (17.3%) | $43,750 |
| Average | 5,585 (100.0%) | $89,567 |
Occupancy by Householder Income Bracket in Williamstown
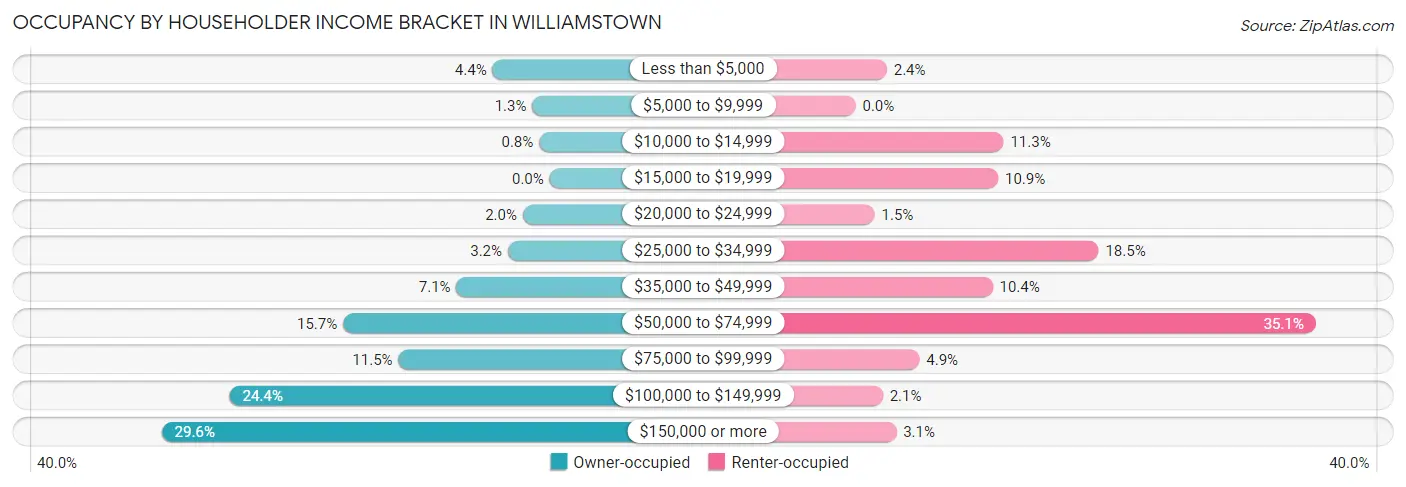
| Income Bracket | Owner-occupied | Renter-occupied |
| Less than $5,000 | 201 (4.3%) | 23 (2.4%) |
| $5,000 to $9,999 | 61 (1.3%) | 0 (0.0%) |
| $10,000 to $14,999 | 37 (0.8%) | 109 (11.3%) |
| $15,000 to $19,999 | 0 (0.0%) | 105 (10.9%) |
| $20,000 to $24,999 | 94 (2.0%) | 14 (1.5%) |
| $25,000 to $34,999 | 147 (3.2%) | 179 (18.5%) |
| $35,000 to $49,999 | 328 (7.1%) | 101 (10.4%) |
| $50,000 to $74,999 | 727 (15.7%) | 339 (35.1%) |
| $75,000 to $99,999 | 532 (11.5%) | 47 (4.9%) |
| $100,000 to $149,999 | 1,126 (24.4%) | 20 (2.1%) |
| $150,000 or more | 1,365 (29.6%) | 30 (3.1%) |
| Total | 4,618 (100.0%) | 967 (100.0%) |
Monthly Housing Cost Tiers in Williamstown
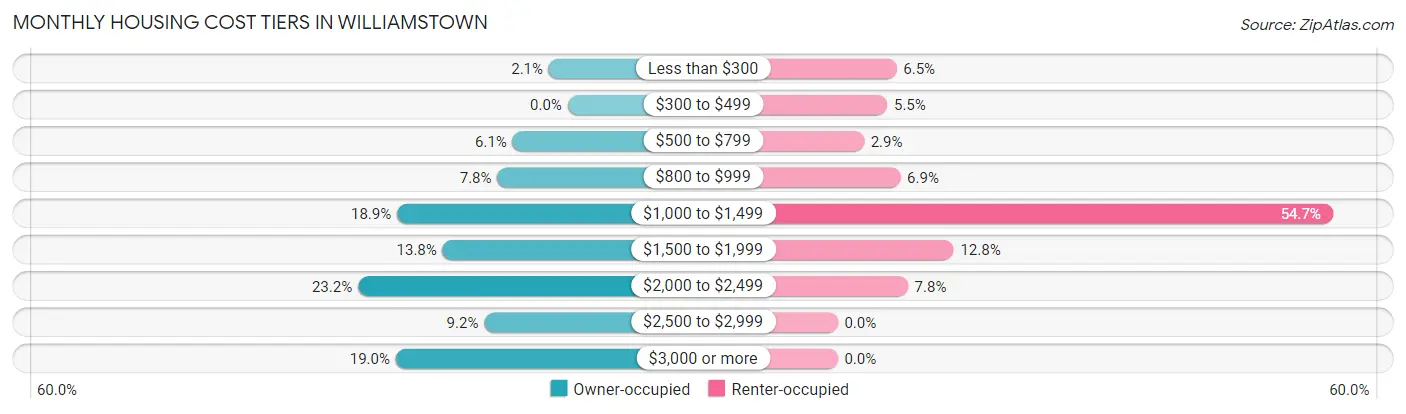
| Monthly Cost | Owner-occupied | Renter-occupied |
| Less than $300 | 96 (2.1%) | 63 (6.5%) |
| $300 to $499 | 0 (0.0%) | 53 (5.5%) |
| $500 to $799 | 281 (6.1%) | 28 (2.9%) |
| $800 to $999 | 359 (7.8%) | 67 (6.9%) |
| $1,000 to $1,499 | 871 (18.9%) | 529 (54.7%) |
| $1,500 to $1,999 | 638 (13.8%) | 124 (12.8%) |
| $2,000 to $2,499 | 1,070 (23.2%) | 75 (7.8%) |
| $2,500 to $2,999 | 426 (9.2%) | 0 (0.0%) |
| $3,000 or more | 877 (19.0%) | 0 (0.0%) |
| Total | 4,618 (100.0%) | 967 (100.0%) |
Physical Housing Characteristics in Williamstown
Housing Structures in Williamstown
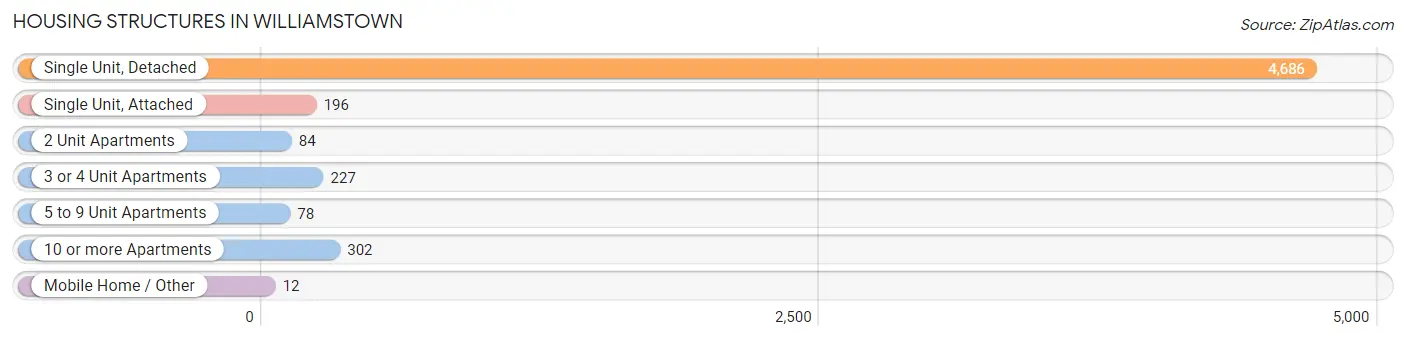
| Structure Type | # Housing Units | % Housing Units |
| Single Unit, Detached | 4,686 | 83.9% |
| Single Unit, Attached | 196 | 3.5% |
| 2 Unit Apartments | 84 | 1.5% |
| 3 or 4 Unit Apartments | 227 | 4.1% |
| 5 to 9 Unit Apartments | 78 | 1.4% |
| 10 or more Apartments | 302 | 5.4% |
| Mobile Home / Other | 12 | 0.2% |
| Total | 5,585 | 100.0% |
Housing Structures by Occupancy in Williamstown
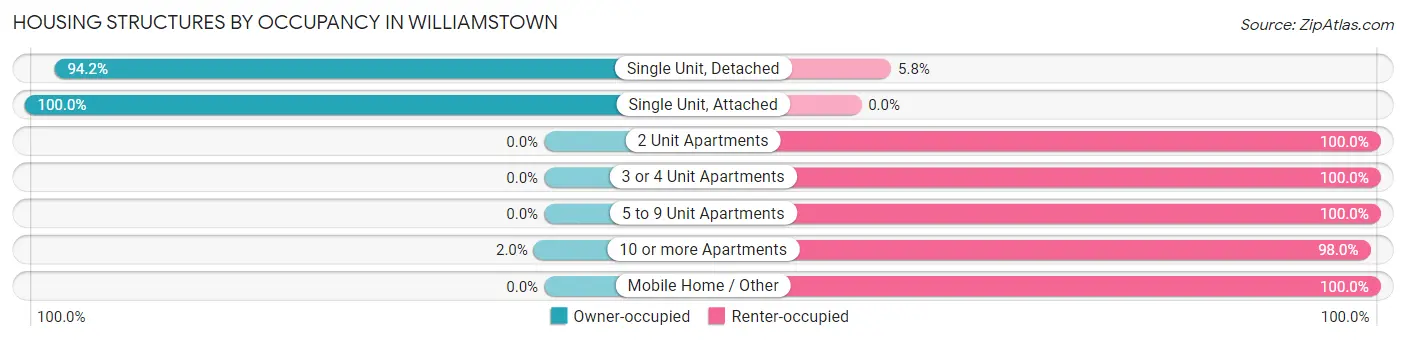
| Structure Type | Owner-occupied | Renter-occupied |
| Single Unit, Detached | 4,416 (94.2%) | 270 (5.8%) |
| Single Unit, Attached | 196 (100.0%) | 0 (0.0%) |
| 2 Unit Apartments | 0 (0.0%) | 84 (100.0%) |
| 3 or 4 Unit Apartments | 0 (0.0%) | 227 (100.0%) |
| 5 to 9 Unit Apartments | 0 (0.0%) | 78 (100.0%) |
| 10 or more Apartments | 6 (2.0%) | 296 (98.0%) |
| Mobile Home / Other | 0 (0.0%) | 12 (100.0%) |
| Total | 4,618 (82.7%) | 967 (17.3%) |
Housing Structures by Number of Rooms in Williamstown
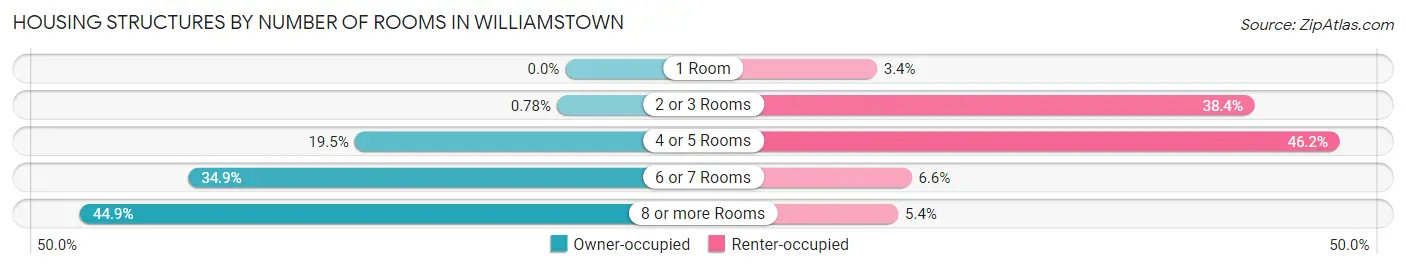
| Number of Rooms | Owner-occupied | Renter-occupied |
| 1 Room | 0 (0.0%) | 33 (3.4%) |
| 2 or 3 Rooms | 36 (0.8%) | 371 (38.4%) |
| 4 or 5 Rooms | 900 (19.5%) | 447 (46.2%) |
| 6 or 7 Rooms | 1,610 (34.9%) | 64 (6.6%) |
| 8 or more Rooms | 2,072 (44.9%) | 52 (5.4%) |
| Total | 4,618 (100.0%) | 967 (100.0%) |
Housing Structure by Heating Type in Williamstown
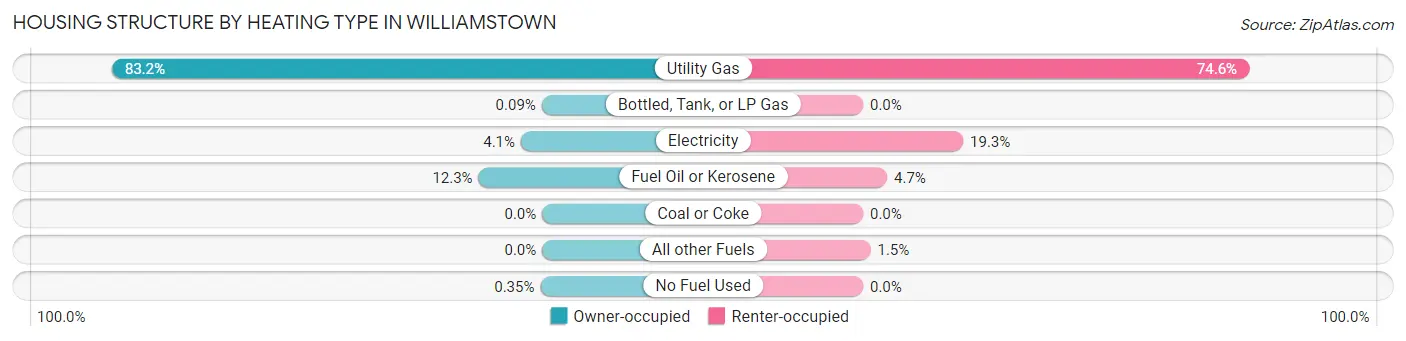
| Heating Type | Owner-occupied | Renter-occupied |
| Utility Gas | 3,840 (83.2%) | 721 (74.6%) |
| Bottled, Tank, or LP Gas | 4 (0.1%) | 0 (0.0%) |
| Electricity | 190 (4.1%) | 187 (19.3%) |
| Fuel Oil or Kerosene | 568 (12.3%) | 45 (4.6%) |
| Coal or Coke | 0 (0.0%) | 0 (0.0%) |
| All other Fuels | 0 (0.0%) | 14 (1.5%) |
| No Fuel Used | 16 (0.4%) | 0 (0.0%) |
| Total | 4,618 (100.0%) | 967 (100.0%) |
Household Vehicle Usage in Williamstown
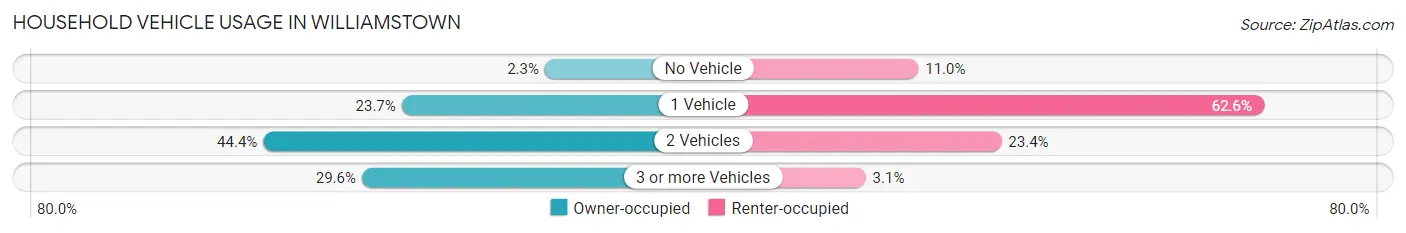
| Vehicles per Household | Owner-occupied | Renter-occupied |
| No Vehicle | 106 (2.3%) | 106 (11.0%) |
| 1 Vehicle | 1,094 (23.7%) | 605 (62.6%) |
| 2 Vehicles | 2,049 (44.4%) | 226 (23.4%) |
| 3 or more Vehicles | 1,369 (29.6%) | 30 (3.1%) |
| Total | 4,618 (100.0%) | 967 (100.0%) |
Real Estate & Mortgages in Williamstown
Real Estate and Mortgage Overview in Williamstown
| Characteristic | Without Mortgage | With Mortgage |
| Housing Units | 1,233 | 3,385 |
| Median Property Value | $220,200 | $248,900 |
| Median Household Income | $86,597 | $1,082 |
| Monthly Housing Costs | $984 | $877 |
| Real Estate Taxes | $7,183 | $135 |
Property Value by Mortgage Status in Williamstown
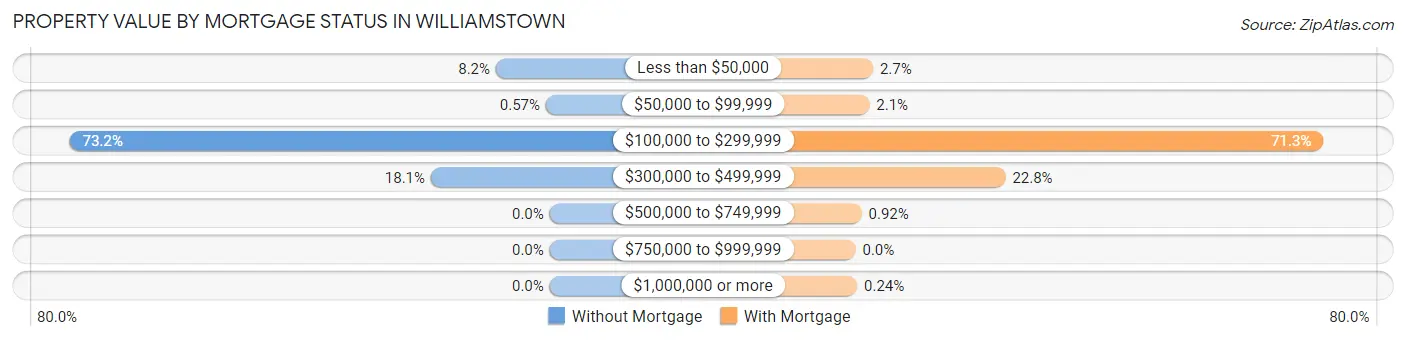
| Property Value | Without Mortgage | With Mortgage |
| Less than $50,000 | 101 (8.2%) | 90 (2.7%) |
| $50,000 to $99,999 | 7 (0.6%) | 71 (2.1%) |
| $100,000 to $299,999 | 902 (73.2%) | 2,412 (71.3%) |
| $300,000 to $499,999 | 223 (18.1%) | 773 (22.8%) |
| $500,000 to $749,999 | 0 (0.0%) | 31 (0.9%) |
| $750,000 to $999,999 | 0 (0.0%) | 0 (0.0%) |
| $1,000,000 or more | 0 (0.0%) | 8 (0.2%) |
| Total | 1,233 (100.0%) | 3,385 (100.0%) |
Household Income by Mortgage Status in Williamstown
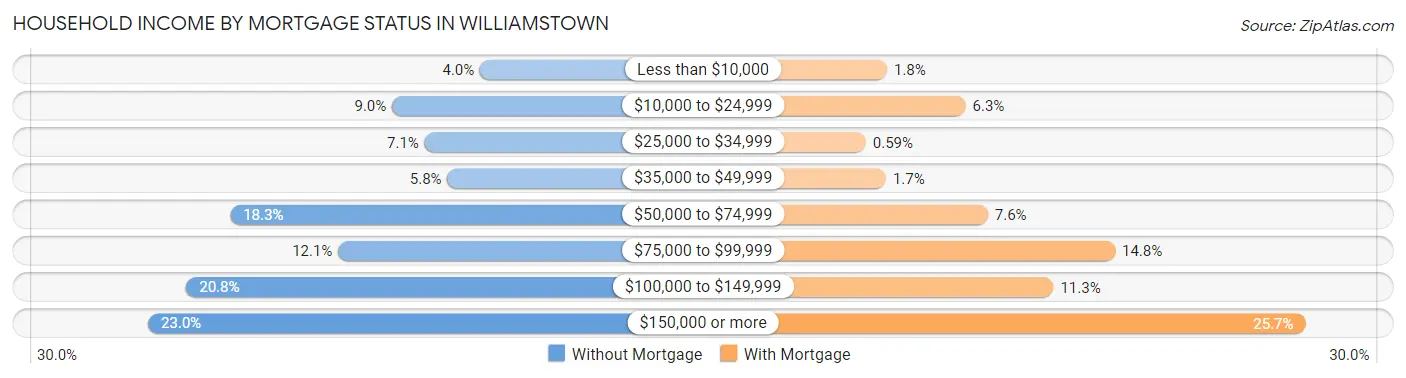
| Household Income | Without Mortgage | With Mortgage |
| Less than $10,000 | 49 (4.0%) | 61 (1.8%) |
| $10,000 to $24,999 | 111 (9.0%) | 213 (6.3%) |
| $25,000 to $34,999 | 88 (7.1%) | 20 (0.6%) |
| $35,000 to $49,999 | 72 (5.8%) | 59 (1.7%) |
| $50,000 to $74,999 | 225 (18.2%) | 256 (7.6%) |
| $75,000 to $99,999 | 149 (12.1%) | 502 (14.8%) |
| $100,000 to $149,999 | 256 (20.8%) | 383 (11.3%) |
| $150,000 or more | 283 (23.0%) | 870 (25.7%) |
| Total | 1,233 (100.0%) | 3,385 (100.0%) |
Property Value to Household Income Ratio in Williamstown
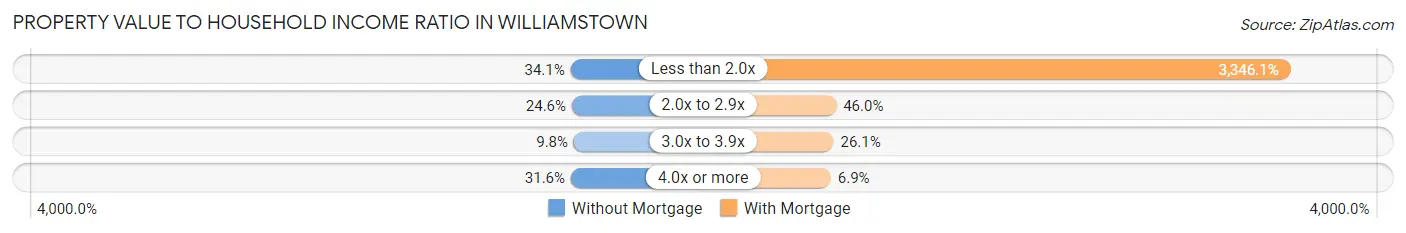
| Value-to-Income Ratio | Without Mortgage | With Mortgage |
| Less than 2.0x | 420 (34.1%) | 113,267 (3,346.1%) |
| 2.0x to 2.9x | 303 (24.6%) | 1,556 (46.0%) |
| 3.0x to 3.9x | 121 (9.8%) | 884 (26.1%) |
| 4.0x or more | 389 (31.6%) | 232 (6.9%) |
| Total | 1,233 (100.0%) | 3,385 (100.0%) |
Real Estate Taxes by Mortgage Status in Williamstown
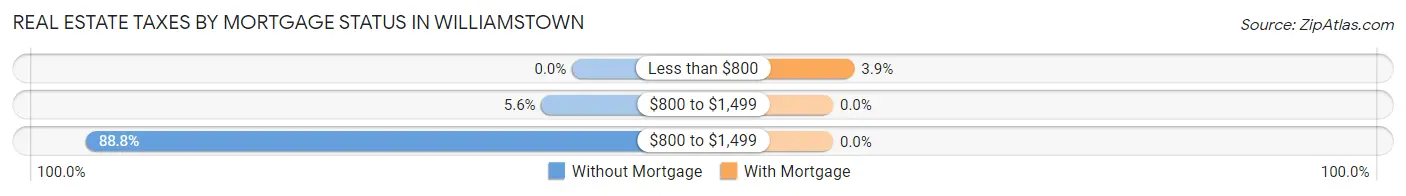
| Property Taxes | Without Mortgage | With Mortgage |
| Less than $800 | 0 (0.0%) | 132 (3.9%) |
| $800 to $1,499 | 69 (5.6%) | 0 (0.0%) |
| $800 to $1,499 | 1,095 (88.8%) | 0 (0.0%) |
| Total | 1,233 (100.0%) | 3,385 (100.0%) |
Health & Disability in Williamstown
Health Insurance Coverage by Age in Williamstown
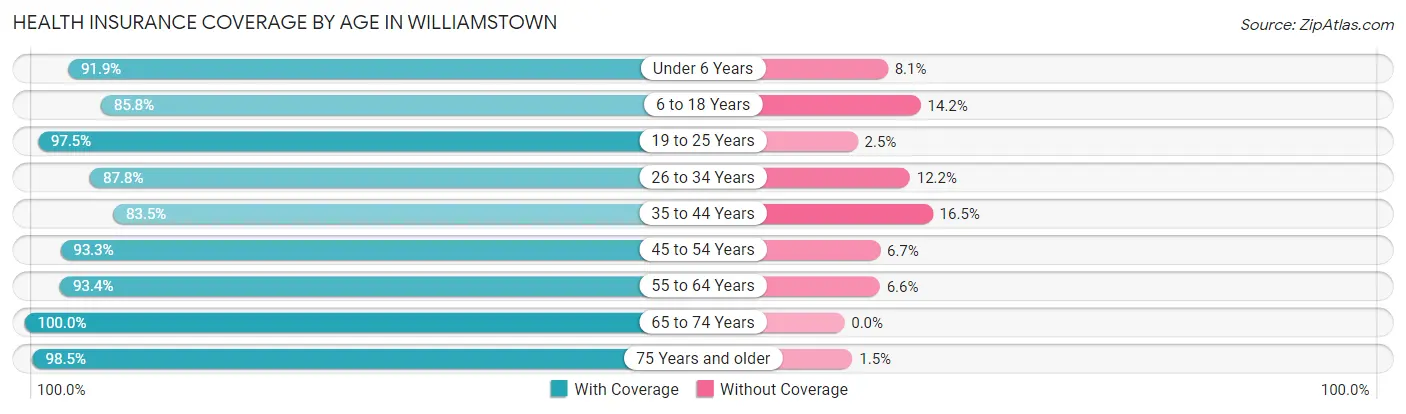
| Age Bracket | With Coverage | Without Coverage |
| Under 6 Years | 852 (91.9%) | 75 (8.1%) |
| 6 to 18 Years | 2,025 (85.8%) | 336 (14.2%) |
| 19 to 25 Years | 1,258 (97.5%) | 32 (2.5%) |
| 26 to 34 Years | 1,352 (87.8%) | 188 (12.2%) |
| 35 to 44 Years | 1,708 (83.5%) | 337 (16.5%) |
| 45 to 54 Years | 1,907 (93.3%) | 136 (6.7%) |
| 55 to 64 Years | 1,827 (93.4%) | 129 (6.6%) |
| 65 to 74 Years | 1,427 (100.0%) | 0 (0.0%) |
| 75 Years and older | 988 (98.5%) | 15 (1.5%) |
| Total | 13,344 (91.4%) | 1,248 (8.6%) |
Health Insurance Coverage by Citizenship Status in Williamstown
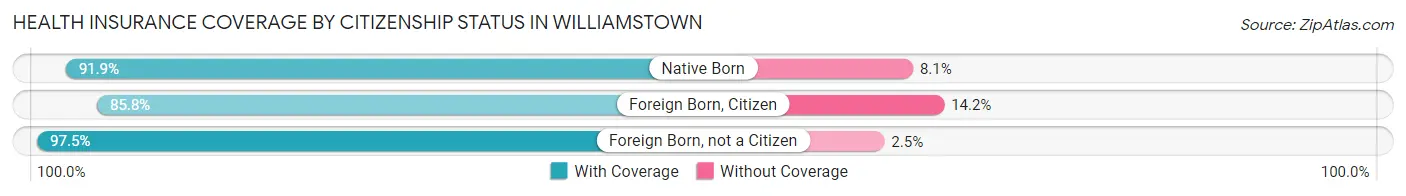
| Citizenship Status | With Coverage | Without Coverage |
| Native Born | 852 (91.9%) | 75 (8.1%) |
| Foreign Born, Citizen | 2,025 (85.8%) | 336 (14.2%) |
| Foreign Born, not a Citizen | 1,258 (97.5%) | 32 (2.5%) |
Health Insurance Coverage by Household Income in Williamstown
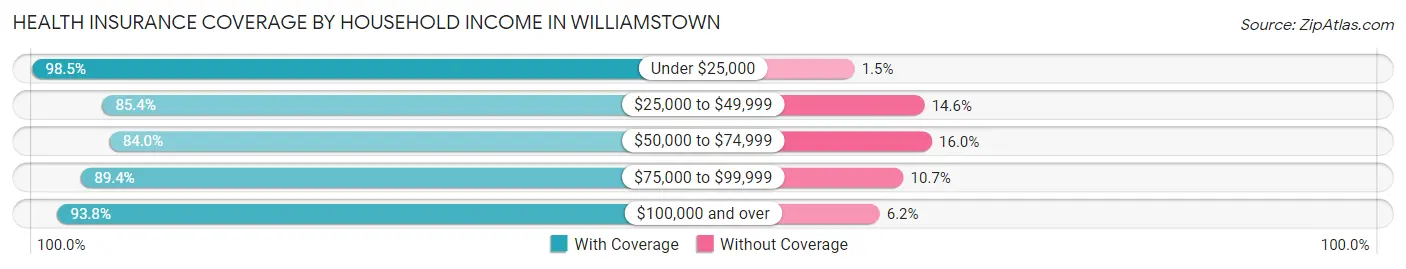
| Household Income | With Coverage | Without Coverage |
| Under $25,000 | 860 (98.5%) | 13 (1.5%) |
| $25,000 to $49,999 | 1,035 (85.4%) | 177 (14.6%) |
| $50,000 to $74,999 | 1,830 (84.0%) | 348 (16.0%) |
| $75,000 to $99,999 | 1,434 (89.3%) | 171 (10.6%) |
| $100,000 and over | 8,182 (93.8%) | 539 (6.2%) |
Public vs Private Health Insurance Coverage by Age in Williamstown
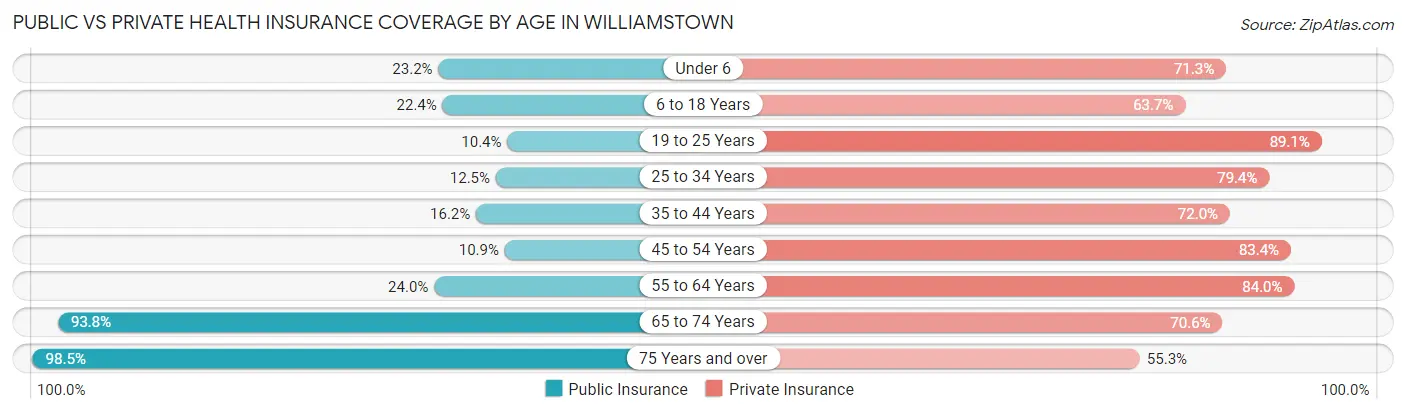
| Age Bracket | Public Insurance | Private Insurance |
| Under 6 | 215 (23.2%) | 661 (71.3%) |
| 6 to 18 Years | 529 (22.4%) | 1,505 (63.7%) |
| 19 to 25 Years | 134 (10.4%) | 1,149 (89.1%) |
| 25 to 34 Years | 193 (12.5%) | 1,222 (79.3%) |
| 35 to 44 Years | 331 (16.2%) | 1,473 (72.0%) |
| 45 to 54 Years | 222 (10.9%) | 1,703 (83.4%) |
| 55 to 64 Years | 469 (24.0%) | 1,643 (84.0%) |
| 65 to 74 Years | 1,339 (93.8%) | 1,008 (70.6%) |
| 75 Years and over | 988 (98.5%) | 555 (55.3%) |
| Total | 4,420 (30.3%) | 10,919 (74.8%) |
Disability Status by Sex by Age in Williamstown
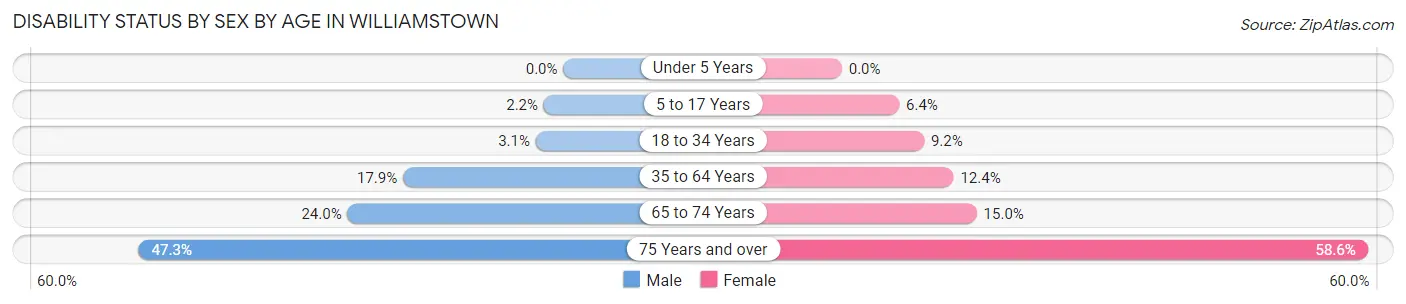
| Age Bracket | Male | Female |
| Under 5 Years | 0 (0.0%) | 0 (0.0%) |
| 5 to 17 Years | 24 (2.2%) | 87 (6.4%) |
| 18 to 34 Years | 38 (3.1%) | 157 (9.1%) |
| 35 to 64 Years | 532 (17.8%) | 381 (12.4%) |
| 65 to 74 Years | 151 (24.0%) | 120 (15.0%) |
| 75 Years and over | 140 (47.3%) | 414 (58.6%) |
Disability Class by Sex by Age in Williamstown
Disability Class: Hearing Difficulty
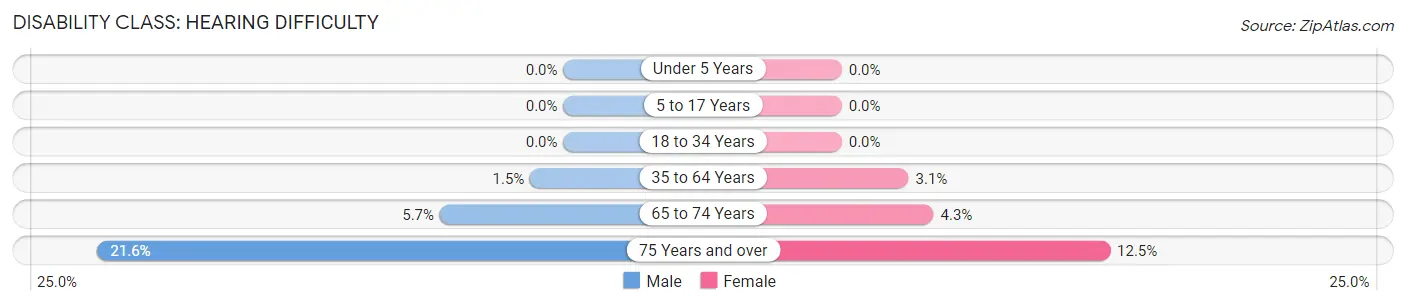
| Age Bracket | Male | Female |
| Under 5 Years | 0 (0.0%) | 0 (0.0%) |
| 5 to 17 Years | 0 (0.0%) | 0 (0.0%) |
| 18 to 34 Years | 0 (0.0%) | 0 (0.0%) |
| 35 to 64 Years | 46 (1.5%) | 95 (3.1%) |
| 65 to 74 Years | 36 (5.7%) | 34 (4.3%) |
| 75 Years and over | 64 (21.6%) | 88 (12.4%) |
Disability Class: Vision Difficulty
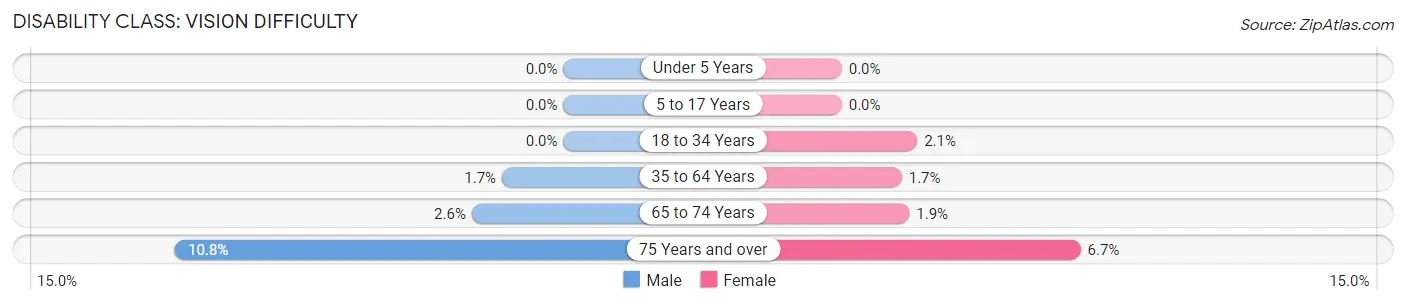
| Age Bracket | Male | Female |
| Under 5 Years | 0 (0.0%) | 0 (0.0%) |
| 5 to 17 Years | 0 (0.0%) | 0 (0.0%) |
| 18 to 34 Years | 0 (0.0%) | 36 (2.1%) |
| 35 to 64 Years | 51 (1.7%) | 51 (1.7%) |
| 65 to 74 Years | 16 (2.5%) | 15 (1.9%) |
| 75 Years and over | 32 (10.8%) | 47 (6.7%) |
Disability Class: Cognitive Difficulty
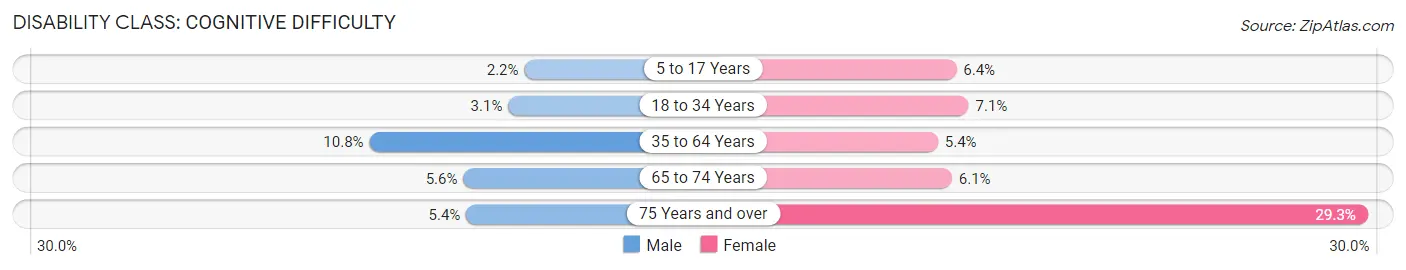
| Age Bracket | Male | Female |
| 5 to 17 Years | 24 (2.2%) | 87 (6.4%) |
| 18 to 34 Years | 38 (3.1%) | 121 (7.1%) |
| 35 to 64 Years | 322 (10.8%) | 164 (5.3%) |
| 65 to 74 Years | 35 (5.6%) | 49 (6.1%) |
| 75 Years and over | 16 (5.4%) | 207 (29.3%) |
Disability Class: Ambulatory Difficulty
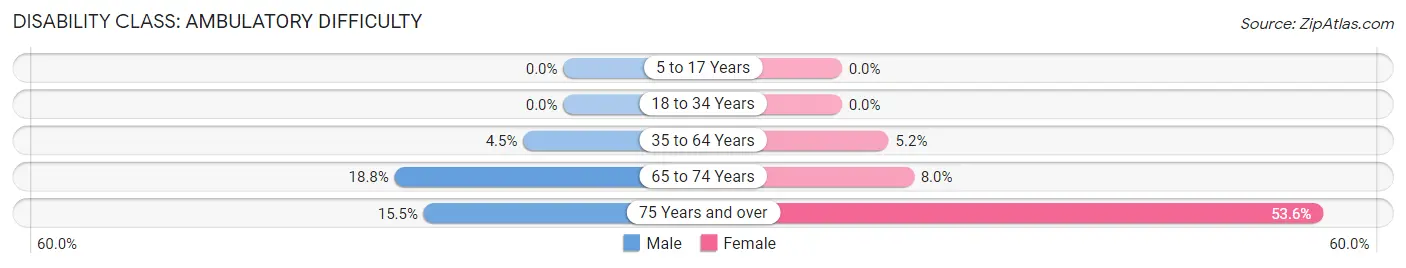
| Age Bracket | Male | Female |
| 5 to 17 Years | 0 (0.0%) | 0 (0.0%) |
| 18 to 34 Years | 0 (0.0%) | 0 (0.0%) |
| 35 to 64 Years | 133 (4.5%) | 160 (5.2%) |
| 65 to 74 Years | 118 (18.8%) | 64 (8.0%) |
| 75 Years and over | 46 (15.5%) | 379 (53.6%) |
Disability Class: Self-Care Difficulty
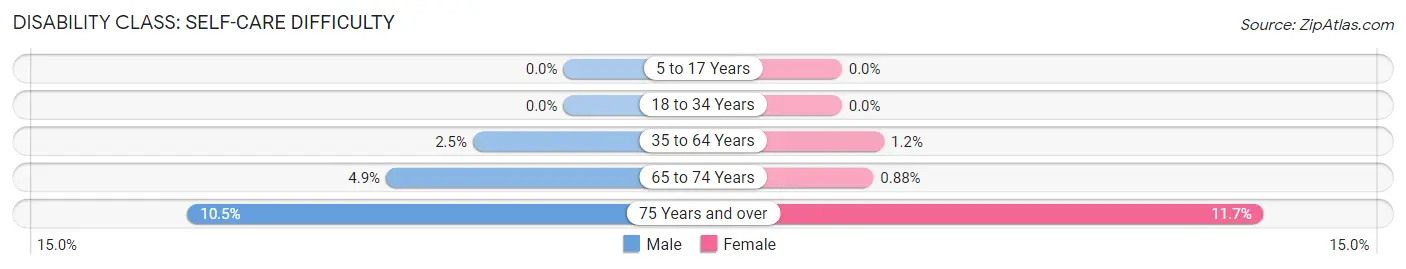
| Age Bracket | Male | Female |
| 5 to 17 Years | 0 (0.0%) | 0 (0.0%) |
| 18 to 34 Years | 0 (0.0%) | 0 (0.0%) |
| 35 to 64 Years | 75 (2.5%) | 36 (1.2%) |
| 65 to 74 Years | 31 (4.9%) | 7 (0.9%) |
| 75 Years and over | 31 (10.5%) | 83 (11.7%) |
Technology Access in Williamstown
Computing Device Access in Williamstown
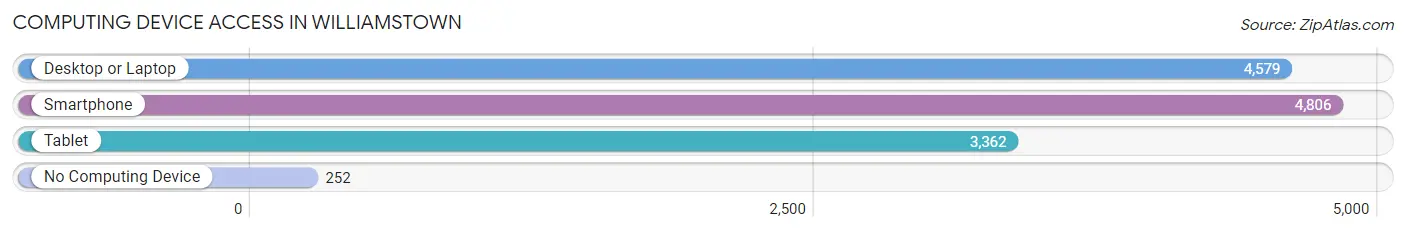
| Device Type | # Households | % Households |
| Desktop or Laptop | 4,579 | 82.0% |
| Smartphone | 4,806 | 86.1% |
| Tablet | 3,362 | 60.2% |
| No Computing Device | 252 | 4.5% |
| Total | 5,585 | 100.0% |
Internet Access in Williamstown
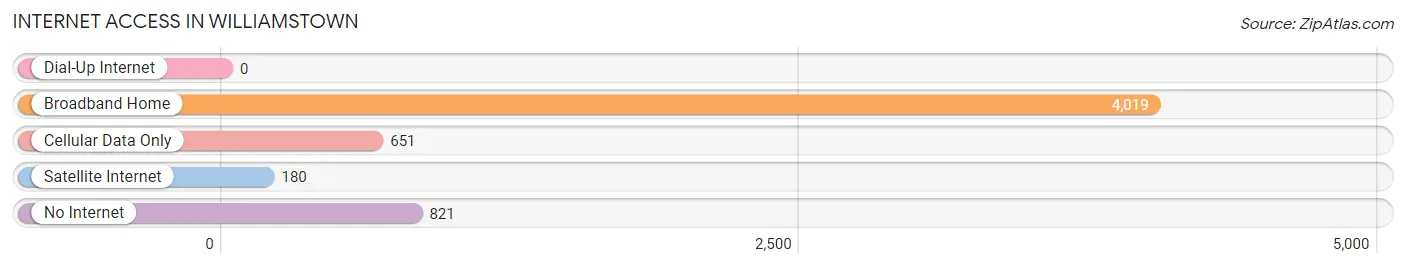
| Internet Type | # Households | % Households |
| Dial-Up Internet | 0 | 0.0% |
| Broadband Home | 4,019 | 72.0% |
| Cellular Data Only | 651 | 11.7% |
| Satellite Internet | 180 | 3.2% |
| No Internet | 821 | 14.7% |
| Total | 5,585 | 100.0% |
Williamstown Summary
Williamstown is a small town located in Gloucester County, New Jersey. It is situated in the southwestern part of the state, about 20 miles southeast of Philadelphia. The town has a population of 15,569, according to the 2010 census.
History
Williamstown was first settled in 1686 by William Cooper, who purchased land from the local Native Americans. The town was originally known as “Cooper’s Ferry” and was later renamed “Williamstown” in honor of its founder. The town was officially incorporated in 1844.
In the 19th century, Williamstown was a major center for the production of glass and pottery. The town was also home to several large farms, which provided food for the local population.
Geography
Williamstown is located in the southwestern part of New Jersey, about 20 miles southeast of Philadelphia. The town is situated on the banks of the Big Timber Creek, which flows through the center of town. The town is bordered by Monroe Township to the north, Washington Township to the east, and Monroe Township to the south.
The town has a total area of 8.3 square miles, of which 8.2 square miles is land and 0.1 square miles is water. The town is located in the Atlantic Coastal Plain, and is characterized by flat terrain and sandy soil.
Economy
Williamstown’s economy is largely based on manufacturing and retail. The town is home to several large factories, including a glass factory, a pottery factory, and a paper mill. The town is also home to several large retail stores, including a Walmart Supercenter and a Lowe’s Home Improvement store.
The town is also home to several small businesses, including restaurants, bars, and shops. The town is also home to several large employers, including the Williamstown School District, the Williamstown Fire Department, and the Williamstown Police Department.
Demographics
According to the 2010 census, Williamstown has a population of 15,569. The town has a median household income of $60,945, and a median family income of $71,945. The town has a poverty rate of 8.3%, and a unemployment rate of 6.2%.
The town is predominantly white, with a population that is 88.3% white, 5.2% Hispanic, 2.7% African American, and 1.7% Asian. The town is also home to a large number of immigrants, with a population that is 8.3% foreign-born.
Conclusion
Williamstown is a small town located in Gloucester County, New Jersey. The town has a population of 15,569, and is situated on the banks of the Big Timber Creek. The town’s economy is largely based on manufacturing and retail, and the town is home to several large employers. The town is predominantly white, with a population that is 88.3% white, 5.2% Hispanic, 2.7% African American, and 1.7% Asian. The town has a median household income of $60,945, and a median family income of $71,945.
Common Questions
What is Per Capita Income in Williamstown?
Per Capita income in Williamstown is $41,032.
What is the Median Family Income in Williamstown?
Median Family Income in Williamstown is $114,044.
What is the Median Household income in Williamstown?
Median Household Income in Williamstown is $89,567.
What is Income or Wage Gap in Williamstown?
Income or Wage Gap in Williamstown is 24.7%.
Women in Williamstown earn 75.3 cents for every dollar earned by a man.
What is Inequality or Gini Index in Williamstown?
Inequality or Gini Index in Williamstown is 0.39.
What is the Total Population of Williamstown?
Total Population of Williamstown is 14,770.
What is the Total Male Population of Williamstown?
Total Male Population of Williamstown is 6,622.
What is the Total Female Population of Williamstown?
Total Female Population of Williamstown is 8,148.
What is the Ratio of Males per 100 Females in Williamstown?
There are 81.27 Males per 100 Females in Williamstown.
What is the Ratio of Females per 100 Males in Williamstown?
There are 123.04 Females per 100 Males in Williamstown.
What is the Median Population Age in Williamstown?
Median Population Age in Williamstown is 39.9 Years.
What is the Average Family Size in Williamstown
Average Family Size in Williamstown is 3.3 People.
What is the Average Household Size in Williamstown
Average Household Size in Williamstown is 2.6 People.
How Large is the Labor Force in Williamstown?
There are 7,736 People in the Labor Forcein in Williamstown.
What is the Percentage of People in the Labor Force in Williamstown?
65.1% of People are in the Labor Force in Williamstown.
What is the Unemployment Rate in Williamstown?
Unemployment Rate in Williamstown is 5.7%.