Hancocks Bridge, NJ Map & Demographics
Hancocks Bridge Map
Hancocks Bridge Overview
$39,591
PER CAPITA INCOME
$100,938
AVG FAMILY INCOME
$72,917
AVG HOUSEHOLD INCOME
43.9%
WAGE / INCOME GAP [ % ]
56.1¢/ $1
WAGE / INCOME GAP [ $ ]
0.35
INEQUALITY / GINI INDEX
348
TOTAL POPULATION
225
MALE POPULATION
123
FEMALE POPULATION
182.93
MALES / 100 FEMALES
54.67
FEMALES / 100 MALES
37.6
MEDIAN AGE
3.1
AVG FAMILY SIZE
2.5
AVG HOUSEHOLD SIZE
243
LABOR FORCE [ PEOPLE ]
85.3%
PERCENT IN LABOR FORCE
5.8%
UNEMPLOYMENT RATE
Hancocks Bridge Zip Codes
Hancocks Bridge Area Codes
Income in Hancocks Bridge
Income Overview in Hancocks Bridge
Per Capita Income in Hancocks Bridge is $39,591, while median incomes of families and households are $100,938 and $72,917 respectively.
| Characteristic | Number | Measure |
| Per Capita Income | 348 | $39,591 |
| Median Family Income | 84 | $100,938 |
| Mean Family Income | 84 | $103,883 |
| Median Household Income | 141 | $72,917 |
| Mean Household Income | 141 | $80,574 |
| Income Deficit | 84 | $0 |
| Wage / Income Gap (%) | 348 | 43.89% |
| Wage / Income Gap ($) | 348 | 56.11¢ per $1 |
| Gini / Inequality Index | 348 | 0.35 |
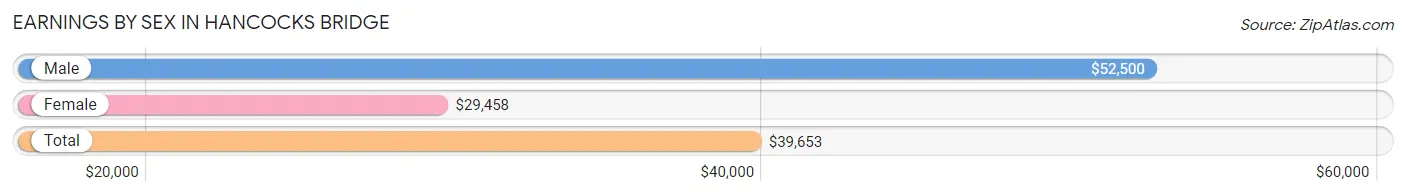
Earnings by Sex in Hancocks Bridge
Average Earnings in Hancocks Bridge are $39,653, $52,500 for men and $29,458 for women, a difference of 43.9%.
| Sex | Number | Average Earnings |
| Male | 164 (67.5%) | $52,500 |
| Female | 79 (32.5%) | $29,458 |
| Total | 243 (100.0%) | $39,653 |
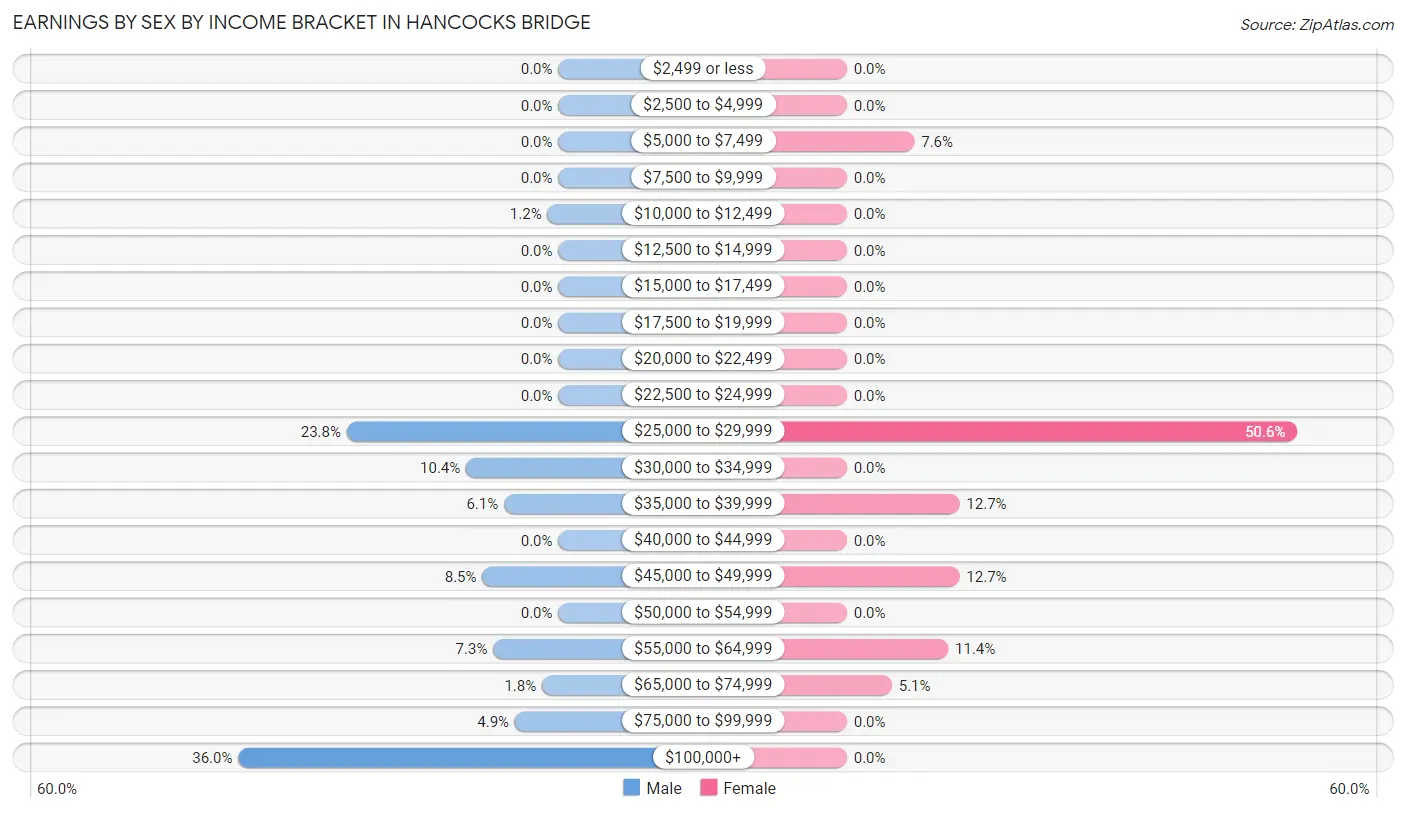
Earnings by Sex by Income Bracket in Hancocks Bridge
The most common earnings brackets in Hancocks Bridge are $100,000+ for men (59 | 36.0%) and $25,000 to $29,999 for women (40 | 50.6%).
| Income | Male | Female |
| $2,499 or less | 0 (0.0%) | 0 (0.0%) |
| $2,500 to $4,999 | 0 (0.0%) | 0 (0.0%) |
| $5,000 to $7,499 | 0 (0.0%) | 6 (7.6%) |
| $7,500 to $9,999 | 0 (0.0%) | 0 (0.0%) |
| $10,000 to $12,499 | 2 (1.2%) | 0 (0.0%) |
| $12,500 to $14,999 | 0 (0.0%) | 0 (0.0%) |
| $15,000 to $17,499 | 0 (0.0%) | 0 (0.0%) |
| $17,500 to $19,999 | 0 (0.0%) | 0 (0.0%) |
| $20,000 to $22,499 | 0 (0.0%) | 0 (0.0%) |
| $22,500 to $24,999 | 0 (0.0%) | 0 (0.0%) |
| $25,000 to $29,999 | 39 (23.8%) | 40 (50.6%) |
| $30,000 to $34,999 | 17 (10.4%) | 0 (0.0%) |
| $35,000 to $39,999 | 10 (6.1%) | 10 (12.7%) |
| $40,000 to $44,999 | 0 (0.0%) | 0 (0.0%) |
| $45,000 to $49,999 | 14 (8.5%) | 10 (12.7%) |
| $50,000 to $54,999 | 0 (0.0%) | 0 (0.0%) |
| $55,000 to $64,999 | 12 (7.3%) | 9 (11.4%) |
| $65,000 to $74,999 | 3 (1.8%) | 4 (5.1%) |
| $75,000 to $99,999 | 8 (4.9%) | 0 (0.0%) |
| $100,000+ | 59 (36.0%) | 0 (0.0%) |
| Total | 164 (100.0%) | 79 (100.0%) |
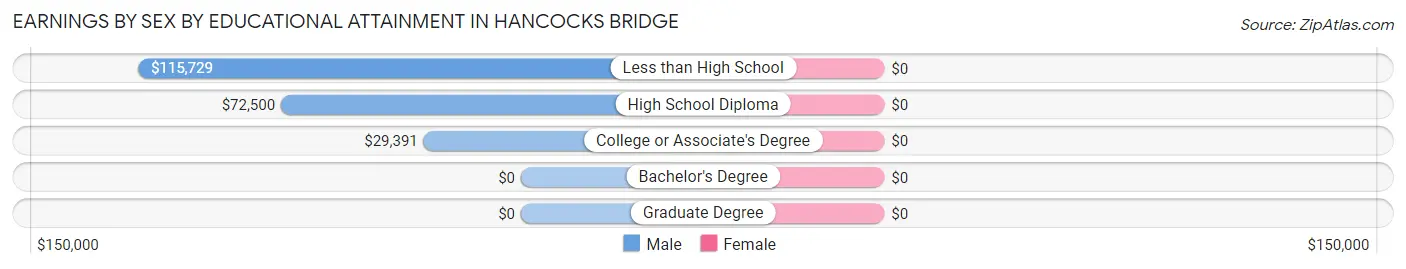
Earnings by Sex by Educational Attainment in Hancocks Bridge
| Educational Attainment | Male Income | Female Income |
| Less than High School | $115,729 | $0 |
| High School Diploma | $72,500 | $0 |
| College or Associate's Degree | $29,391 | $0 |
| Bachelor's Degree | - | - |
| Graduate Degree | - | - |
| Total | $52,500 | $49,625 |
Family Income in Hancocks Bridge
Family Income Brackets in Hancocks Bridge
According to the Hancocks Bridge family income data, there are 30 families falling into the $100,000 to $149,999 income range, which is the most common income bracket and makes up 35.7% of all families.
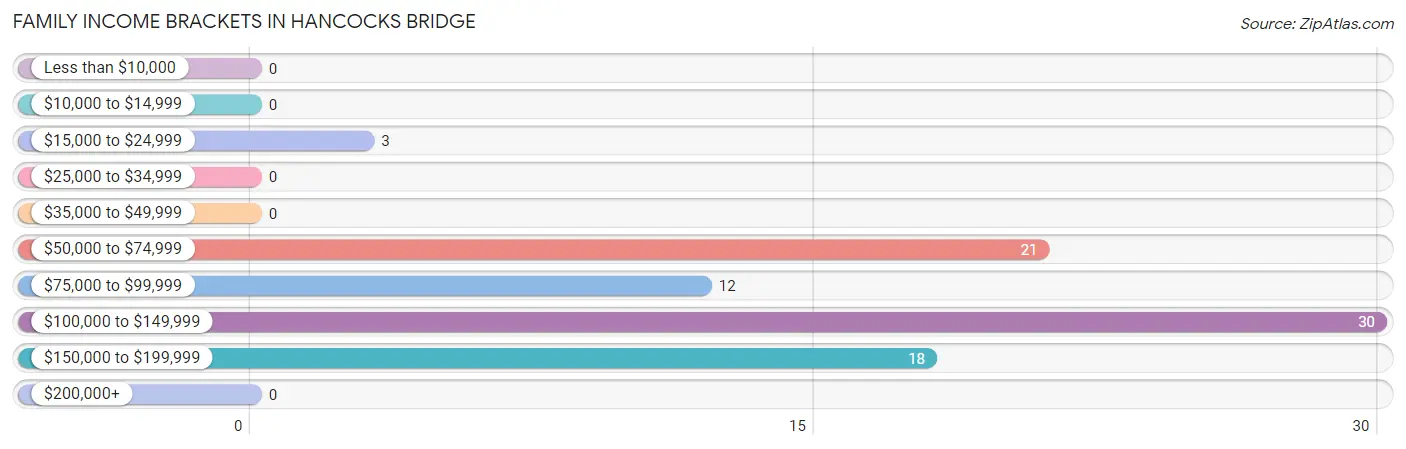
| Income Bracket | # Families | % Families |
| Less than $10,000 | 0 | 0.0% |
| $10,000 to $14,999 | 0 | 0.0% |
| $15,000 to $24,999 | 3 | 3.6% |
| $25,000 to $34,999 | 0 | 0.0% |
| $35,000 to $49,999 | 0 | 0.0% |
| $50,000 to $74,999 | 21 | 25.0% |
| $75,000 to $99,999 | 12 | 14.3% |
| $100,000 to $149,999 | 30 | 35.7% |
| $150,000 to $199,999 | 18 | 21.4% |
| $200,000+ | 0 | 0.0% |
Family Income by Famaliy Size in Hancocks Bridge
2-person families (55 | 65.5%) account for the highest median family income in Hancocks Bridge with $100,078 per family, while 2-person families (55 | 65.5%) have the highest median income of $50,039 per family member.
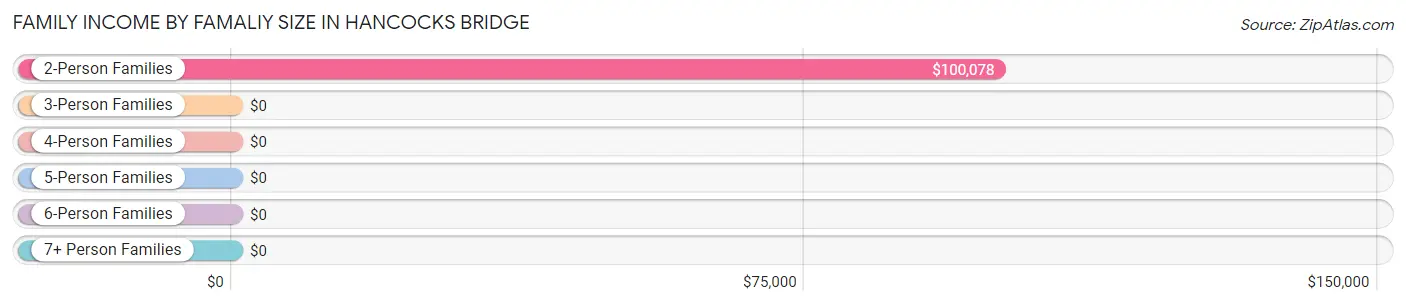
| Income Bracket | # Families | Median Income |
| 2-Person Families | 55 (65.5%) | $100,078 |
| 3-Person Families | 19 (22.6%) | $0 |
| 4-Person Families | 0 (0.0%) | $0 |
| 5-Person Families | 10 (11.9%) | $0 |
| 6-Person Families | 0 (0.0%) | $0 |
| 7+ Person Families | 0 (0.0%) | $0 |
| Total | 84 (100.0%) | $100,938 |
Family Income by Number of Earners in Hancocks Bridge
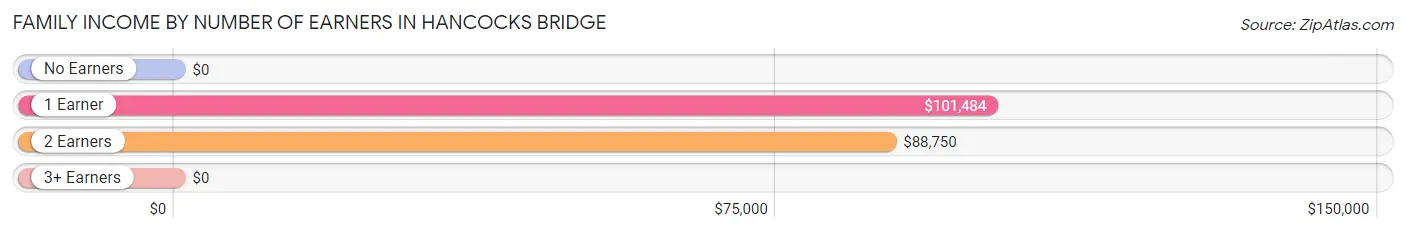
| Number of Earners | # Families | Median Income |
| No Earners | 3 (3.6%) | $0 |
| 1 Earner | 37 (44.1%) | $101,484 |
| 2 Earners | 36 (42.9%) | $88,750 |
| 3+ Earners | 8 (9.5%) | $0 |
| Total | 84 (100.0%) | $100,938 |
Household Income in Hancocks Bridge
Household Income Brackets in Hancocks Bridge
With 47 households falling in the category, the $25,000 to $34,999 income range is the most frequent in Hancocks Bridge, accounting for 33.3% of all households.
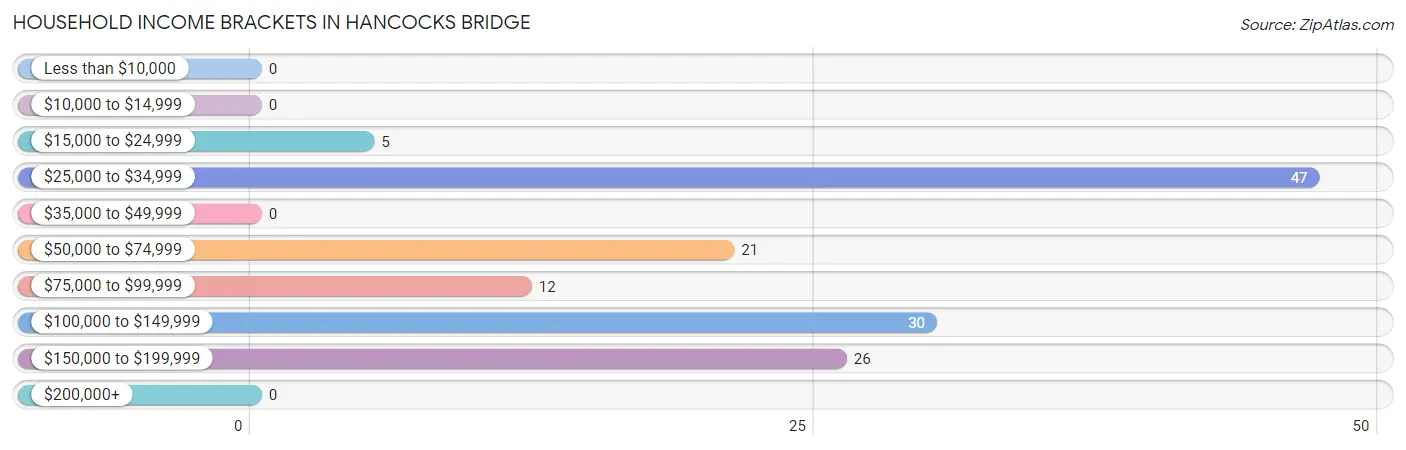
| Income Bracket | # Households | % Households |
| Less than $10,000 | 0 | 0.0% |
| $10,000 to $14,999 | 0 | 0.0% |
| $15,000 to $24,999 | 5 | 3.5% |
| $25,000 to $34,999 | 47 | 33.3% |
| $35,000 to $49,999 | 0 | 0.0% |
| $50,000 to $74,999 | 21 | 14.9% |
| $75,000 to $99,999 | 12 | 8.5% |
| $100,000 to $149,999 | 30 | 21.3% |
| $150,000 to $199,999 | 26 | 18.4% |
| $200,000+ | 0 | 0.0% |
Household Income by Householder Age in Hancocks Bridge
The median household income in Hancocks Bridge is $72,917, with the highest median household income of $89,792 found in the 45 to 64 years age bracket for the primary householder. A total of 54 households (38.3%) fall into this category.
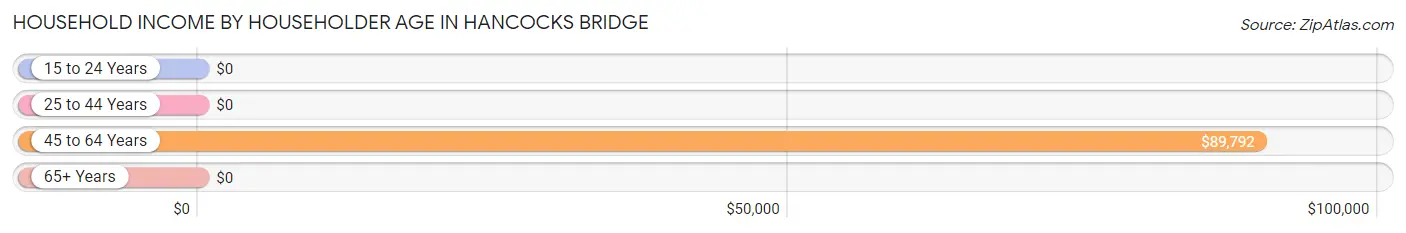
| Income Bracket | # Households | Median Income |
| 15 to 24 Years | 0 (0.0%) | $0 |
| 25 to 44 Years | 78 (55.3%) | $0 |
| 45 to 64 Years | 54 (38.3%) | $89,792 |
| 65+ Years | 9 (6.4%) | $0 |
| Total | 141 (100.0%) | $72,917 |
Poverty in Hancocks Bridge
Income Below Poverty by Sex and Age in Hancocks Bridge
With 2.2% poverty level for males and 5.6% for females among the residents of Hancocks Bridge, 55 to 64 year old males and 45 to 54 year old females are the most vulnerable to poverty, with 5 males (10.4%) and 3 females (42.9%) in their respective age groups living below the poverty level.
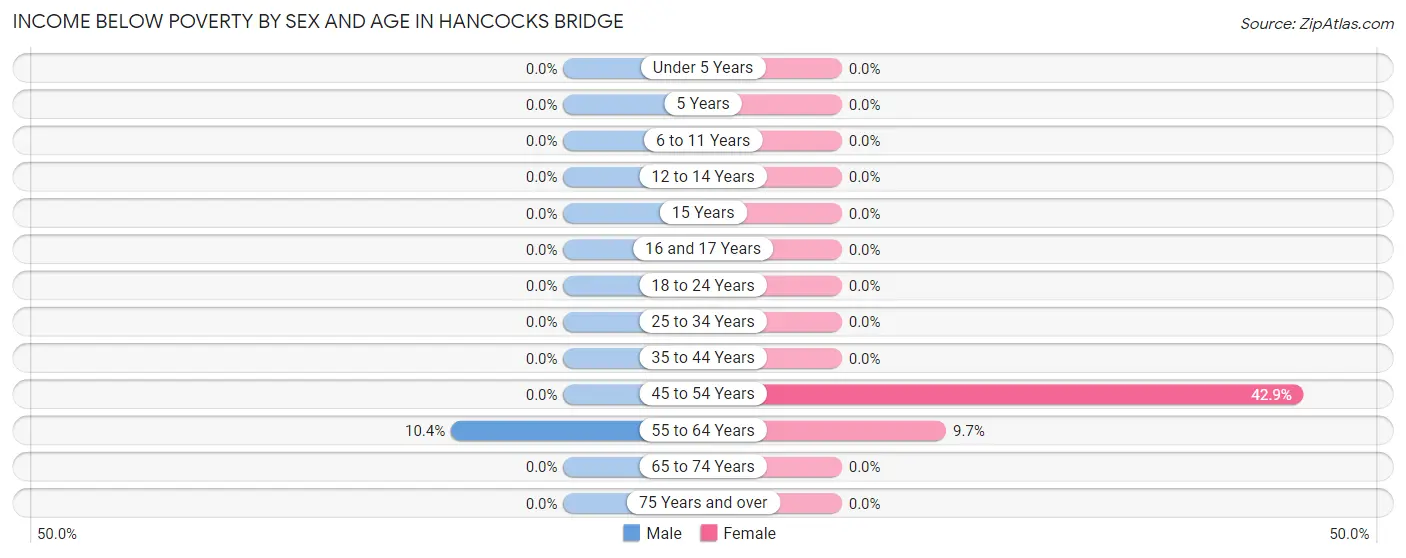
| Age Bracket | Male | Female |
| Under 5 Years | 0 (0.0%) | 0 (0.0%) |
| 5 Years | 0 (0.0%) | 0 (0.0%) |
| 6 to 11 Years | 0 (0.0%) | 0 (0.0%) |
| 12 to 14 Years | 0 (0.0%) | 0 (0.0%) |
| 15 Years | 0 (0.0%) | 0 (0.0%) |
| 16 and 17 Years | 0 (0.0%) | 0 (0.0%) |
| 18 to 24 Years | 0 (0.0%) | 0 (0.0%) |
| 25 to 34 Years | 0 (0.0%) | 0 (0.0%) |
| 35 to 44 Years | 0 (0.0%) | 0 (0.0%) |
| 45 to 54 Years | 0 (0.0%) | 3 (42.9%) |
| 55 to 64 Years | 5 (10.4%) | 3 (9.7%) |
| 65 to 74 Years | 0 (0.0%) | 0 (0.0%) |
| 75 Years and over | 0 (0.0%) | 0 (0.0%) |
| Total | 5 (2.2%) | 6 (5.6%) |
Income Above Poverty by Sex and Age in Hancocks Bridge
According to the poverty statistics in Hancocks Bridge, males aged under 5 years and females aged 12 to 14 years are the age groups that are most secure financially, with 100.0% of males and 100.0% of females in these age groups living above the poverty line.
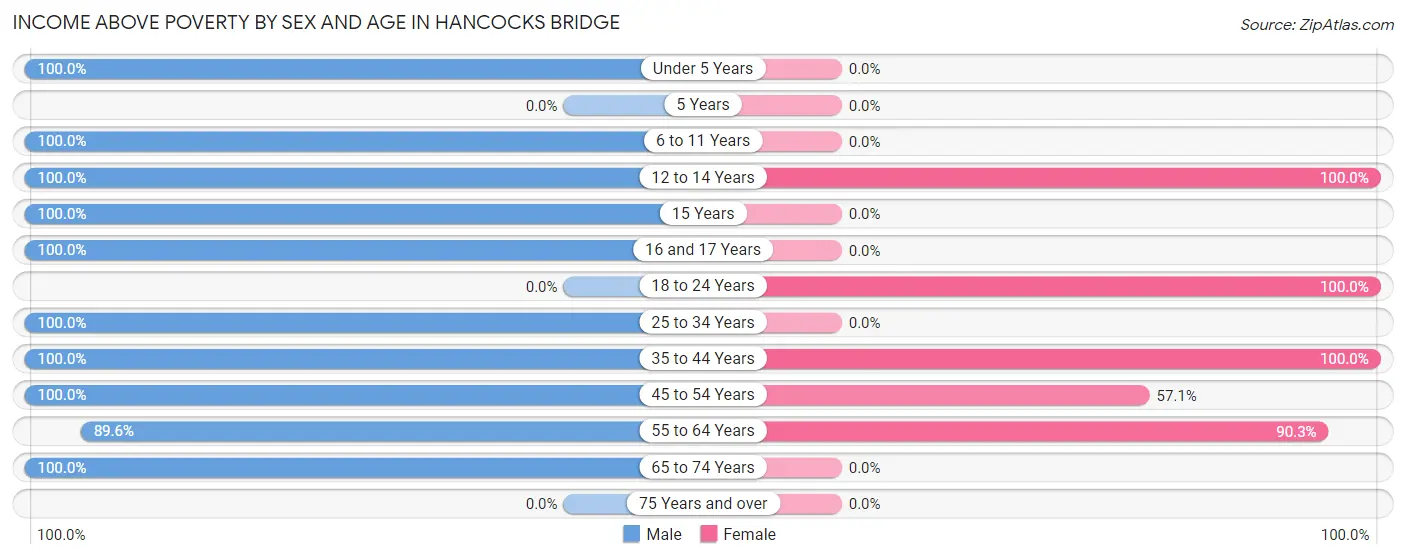
| Age Bracket | Male | Female |
| Under 5 Years | 13 (100.0%) | 0 (0.0%) |
| 5 Years | 0 (0.0%) | 0 (0.0%) |
| 6 to 11 Years | 11 (100.0%) | 0 (0.0%) |
| 12 to 14 Years | 11 (100.0%) | 10 (100.0%) |
| 15 Years | 3 (100.0%) | 0 (0.0%) |
| 16 and 17 Years | 11 (100.0%) | 0 (0.0%) |
| 18 to 24 Years | 0 (0.0%) | 50 (100.0%) |
| 25 to 34 Years | 17 (100.0%) | 0 (0.0%) |
| 35 to 44 Years | 88 (100.0%) | 10 (100.0%) |
| 45 to 54 Years | 14 (100.0%) | 4 (57.1%) |
| 55 to 64 Years | 43 (89.6%) | 28 (90.3%) |
| 65 to 74 Years | 9 (100.0%) | 0 (0.0%) |
| 75 Years and over | 0 (0.0%) | 0 (0.0%) |
| Total | 220 (97.8%) | 102 (94.4%) |
Income Below Poverty Among Married-Couple Families in Hancocks Bridge
The poverty statistics for married-couple families in Hancocks Bridge show that 7.0% or 3 of the total 43 families live below the poverty line. Families with no children have the highest poverty rate of 13.6%, comprising of 3 families. On the other hand, families with 1 or 2 children have the lowest poverty rate of 0.0%, which includes 0 families.
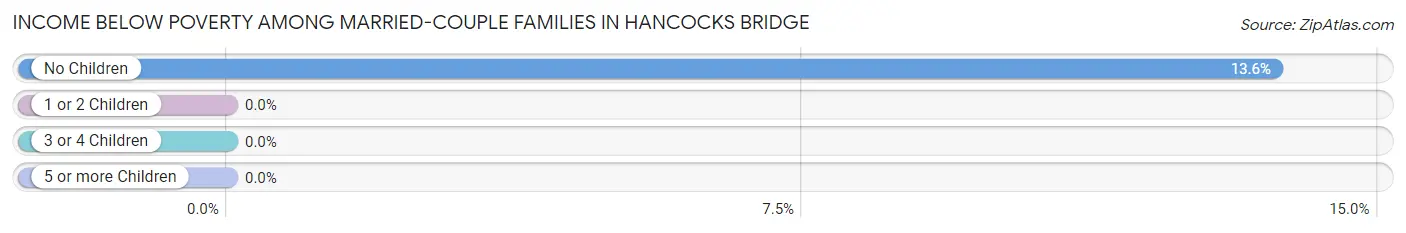
| Children | Above Poverty | Below Poverty |
| No Children | 19 (86.4%) | 3 (13.6%) |
| 1 or 2 Children | 11 (100.0%) | 0 (0.0%) |
| 3 or 4 Children | 10 (100.0%) | 0 (0.0%) |
| 5 or more Children | 0 (0.0%) | 0 (0.0%) |
| Total | 40 (93.0%) | 3 (7.0%) |
Income Below Poverty Among Single-Parent Households in Hancocks Bridge
| Children | Single Father | Single Mother |
| No Children | 0 (0.0%) | 0 (0.0%) |
| 1 or 2 Children | 0 (0.0%) | 0 (0.0%) |
| 3 or 4 Children | 0 (0.0%) | 0 (0.0%) |
| 5 or more Children | 0 (0.0%) | 0 (0.0%) |
| Total | 0 (0.0%) | 0 (0.0%) |
Income Below Poverty Among Married-Couple vs Single-Parent Households in Hancocks Bridge
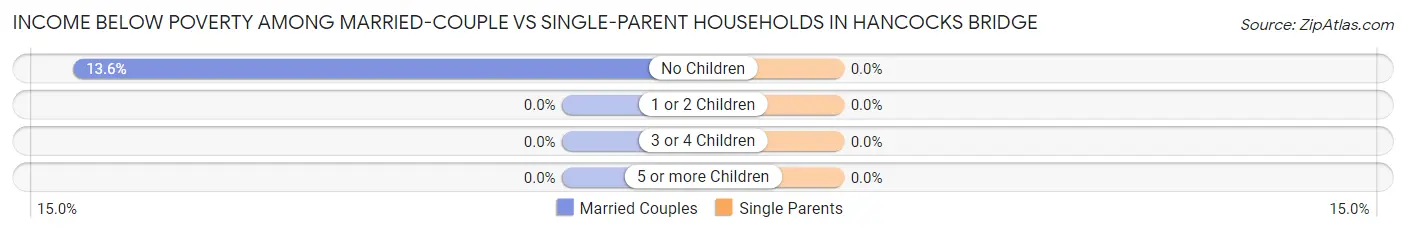
| Children | Married-Couple Families | Single-Parent Households |
| No Children | 3 (13.6%) | 0 (0.0%) |
| 1 or 2 Children | 0 (0.0%) | 0 (0.0%) |
| 3 or 4 Children | 0 (0.0%) | 0 (0.0%) |
| 5 or more Children | 0 (0.0%) | 0 (0.0%) |
| Total | 3 (7.0%) | 0 (0.0%) |
Race in Hancocks Bridge
The most populous races in Hancocks Bridge are White / Caucasian (324 | 93.1%), Hispanic or Latino (24 | 6.9%), and Some other Race (24 | 6.9%).
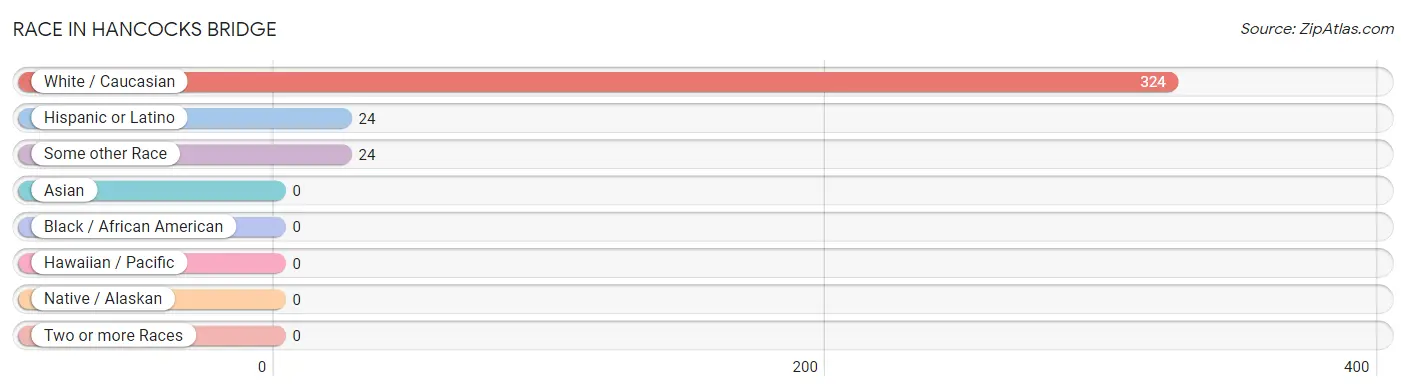
| Race | # Population | % Population |
| Asian | 0 | 0.0% |
| Black / African American | 0 | 0.0% |
| Hawaiian / Pacific | 0 | 0.0% |
| Hispanic or Latino | 24 | 6.9% |
| Native / Alaskan | 0 | 0.0% |
| White / Caucasian | 324 | 93.1% |
| Two or more Races | 0 | 0.0% |
| Some other Race | 24 | 6.9% |
| Total | 348 | 100.0% |
Ancestry in Hancocks Bridge
The most populous ancestries reported in Hancocks Bridge are Irish (108 | 31.0%), American (72 | 20.7%), German (42 | 12.1%), Italian (42 | 12.1%), and Scottish (25 | 7.2%), together accounting for 83.0% of all Hancocks Bridge residents.
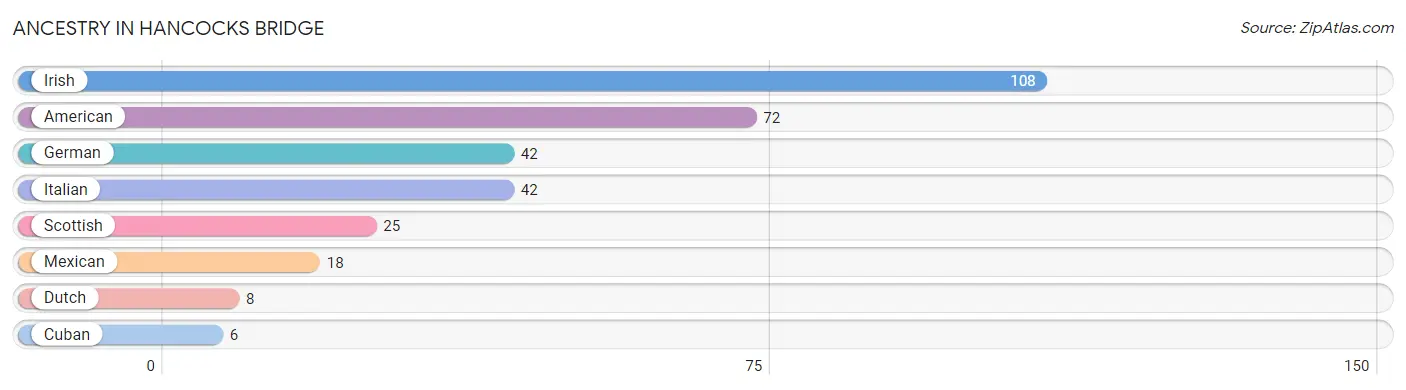
| Ancestry | # Population | % Population |
| American | 72 | 20.7% |
| Cuban | 6 | 1.7% |
| Dutch | 8 | 2.3% |
| German | 42 | 12.1% |
| Irish | 108 | 31.0% |
| Italian | 42 | 12.1% |
| Mexican | 18 | 5.2% |
| Scottish | 25 | 7.2% | View All 8 Rows |
Immigrants in Hancocks Bridge
The most numerous immigrant groups reported in Hancocks Bridge came from Central America (2 | 0.6%), Latin America (2 | 0.6%), and Mexico (2 | 0.6%), together accounting for 1.7% of all Hancocks Bridge residents.
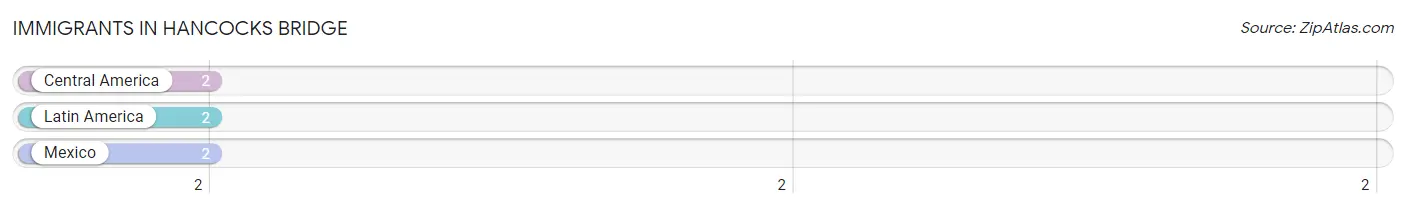
| Immigration Origin | # Population | % Population |
| Central America | 2 | 0.6% |
| Latin America | 2 | 0.6% |
| Mexico | 2 | 0.6% | View All 3 Rows |
Sex and Age in Hancocks Bridge
Sex and Age in Hancocks Bridge
The most populous age groups in Hancocks Bridge are 35 to 39 Years (62 | 27.6%) for men and 20 to 24 Years (50 | 40.6%) for women.
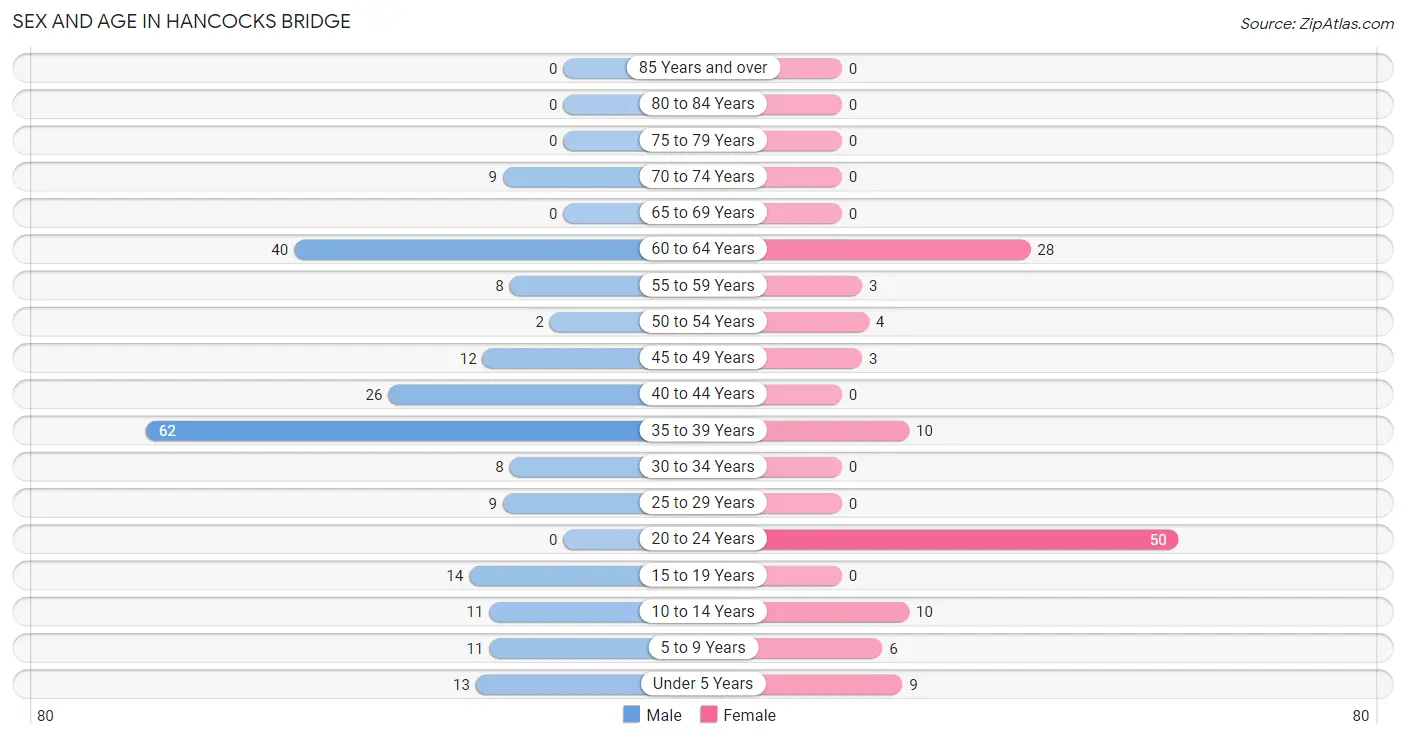
| Age Bracket | Male | Female |
| Under 5 Years | 13 (5.8%) | 9 (7.3%) |
| 5 to 9 Years | 11 (4.9%) | 6 (4.9%) |
| 10 to 14 Years | 11 (4.9%) | 10 (8.1%) |
| 15 to 19 Years | 14 (6.2%) | 0 (0.0%) |
| 20 to 24 Years | 0 (0.0%) | 50 (40.6%) |
| 25 to 29 Years | 9 (4.0%) | 0 (0.0%) |
| 30 to 34 Years | 8 (3.6%) | 0 (0.0%) |
| 35 to 39 Years | 62 (27.6%) | 10 (8.1%) |
| 40 to 44 Years | 26 (11.6%) | 0 (0.0%) |
| 45 to 49 Years | 12 (5.3%) | 3 (2.4%) |
| 50 to 54 Years | 2 (0.9%) | 4 (3.3%) |
| 55 to 59 Years | 8 (3.6%) | 3 (2.4%) |
| 60 to 64 Years | 40 (17.8%) | 28 (22.8%) |
| 65 to 69 Years | 0 (0.0%) | 0 (0.0%) |
| 70 to 74 Years | 9 (4.0%) | 0 (0.0%) |
| 75 to 79 Years | 0 (0.0%) | 0 (0.0%) |
| 80 to 84 Years | 0 (0.0%) | 0 (0.0%) |
| 85 Years and over | 0 (0.0%) | 0 (0.0%) |
| Total | 225 (100.0%) | 123 (100.0%) |
Families and Households in Hancocks Bridge
Median Family Size in Hancocks Bridge
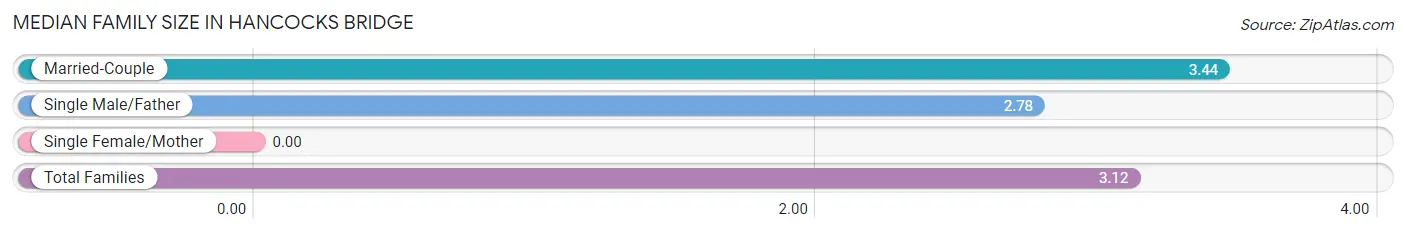
| Family Type | # Families | Family Size |
| Married-Couple | 43 (51.2%) | 3.44 |
| Single Male/Father | 41 (48.8%) | 2.78 |
| Single Female/Mother | 0 (0.0%) | - |
| Total Families | 84 (100.0%) | 3.12 |
Median Household Size in Hancocks Bridge
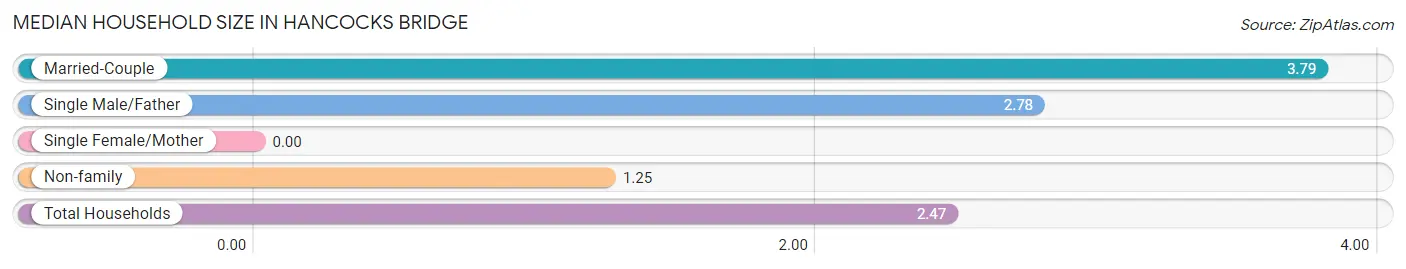
| Household Type | # Households | Household Size |
| Married-Couple | 43 (30.5%) | 3.79 |
| Single Male/Father | 41 (29.1%) | 2.78 |
| Single Female/Mother | 0 (0.0%) | - |
| Non-family | 57 (40.4%) | 1.25 |
| Total Households | 141 (100.0%) | 2.47 |
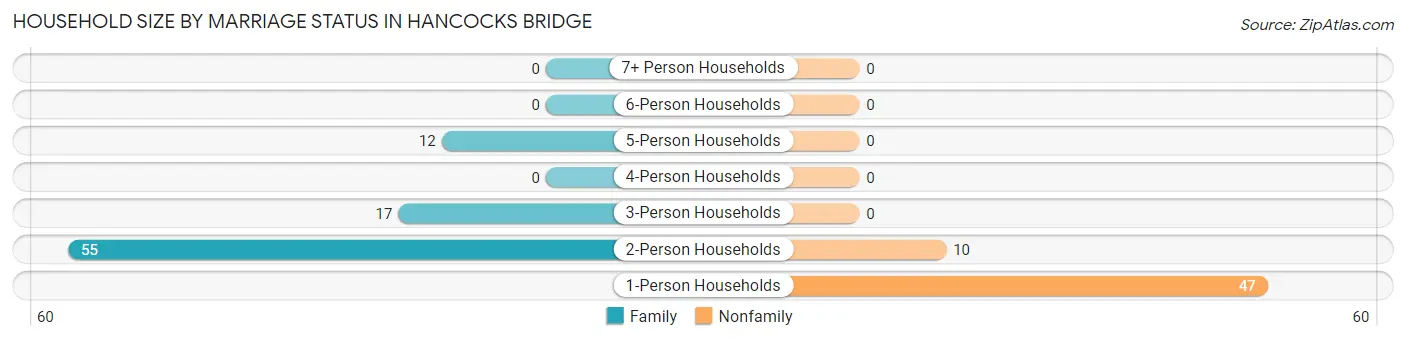
Household Size by Marriage Status in Hancocks Bridge
Out of a total of 141 households in Hancocks Bridge, 84 (59.6%) are family households, while 57 (40.4%) are nonfamily households. The most numerous type of family households are 2-person households, comprising 55, and the most common type of nonfamily households are 1-person households, comprising 47.
| Household Size | Family Households | Nonfamily Households |
| 1-Person Households | - | 47 (33.3%) |
| 2-Person Households | 55 (39.0%) | 10 (7.1%) |
| 3-Person Households | 17 (12.1%) | 0 (0.0%) |
| 4-Person Households | 0 (0.0%) | 0 (0.0%) |
| 5-Person Households | 12 (8.5%) | 0 (0.0%) |
| 6-Person Households | 0 (0.0%) | 0 (0.0%) |
| 7+ Person Households | 0 (0.0%) | 0 (0.0%) |
| Total | 84 (59.6%) | 57 (40.4%) |
Female Fertility in Hancocks Bridge
Fertility by Age in Hancocks Bridge
| Age Bracket | Women with Births | Births / 1,000 Women |
| 15 to 19 years | 0 (0.0%) | 0.0 |
| 20 to 34 years | 0 (0.0%) | 0.0 |
| 35 to 50 years | 0 (0.0%) | 0.0 |
| Total | 0 (0.0%) | 0.0 |
Fertility by Age by Marriage Status in Hancocks Bridge
| Age Bracket | Married | Unmarried |
| 15 to 19 years | 0 (0.0%) | 0 (0.0%) |
| 20 to 34 years | 0 (0.0%) | 0 (0.0%) |
| 35 to 50 years | 0 (0.0%) | 0 (0.0%) |
| Total | 0 (0.0%) | 0 (0.0%) |
Fertility by Education in Hancocks Bridge
| Educational Attainment | Women with Births | Births / 1,000 Women |
| Less than High School | 0 (0.0%) | 0.0 |
| High School Diploma | 0 (0.0%) | 0.0 |
| College or Associate's Degree | 0 (0.0%) | 0.0 |
| Bachelor's Degree | 0 (0.0%) | 0.0 |
| Graduate Degree | 0 (0.0%) | 0.0 |
| Total | 0 (0.0%) | 0.0 |
Fertility by Education by Marriage Status in Hancocks Bridge
| Educational Attainment | Married | Unmarried |
| Less than High School | 0 (0.0%) | 0 (0.0%) |
| High School Diploma | 0 (0.0%) | 0 (0.0%) |
| College or Associate's Degree | 0 (0.0%) | 0 (0.0%) |
| Bachelor's Degree | 0 (0.0%) | 0 (0.0%) |
| Graduate Degree | 0 (0.0%) | 0 (0.0%) |
| Total | 0 (0.0%) | 0 (0.0%) |
Employment Characteristics in Hancocks Bridge
Employment by Class of Employer in Hancocks Bridge
Among the 229 employed individuals in Hancocks Bridge, private company employees (192 | 83.8%), self-employed (not incorporated) (33 | 14.4%), and state government employees (4 | 1.8%) make up the most common classes of employment.
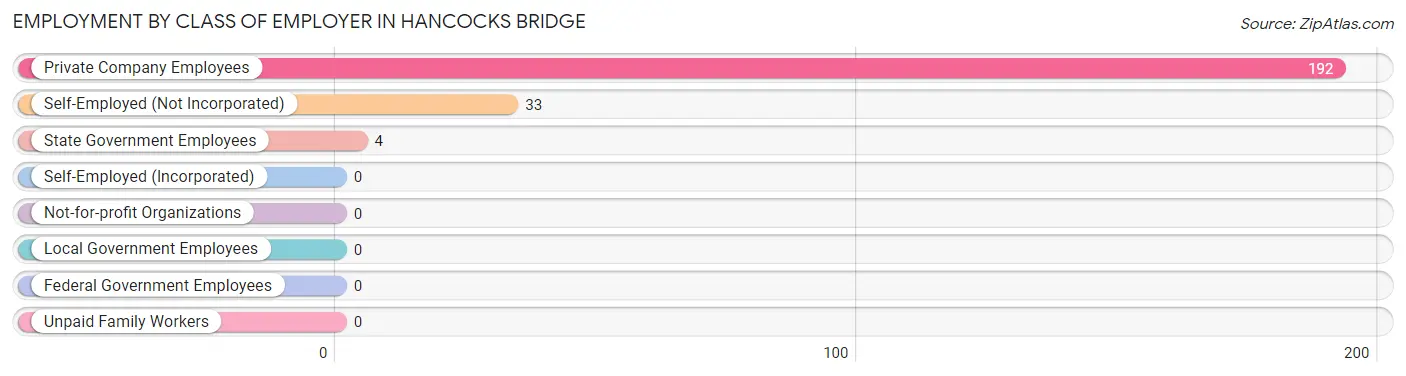
| Employer Class | # Employees | % Employees |
| Private Company Employees | 192 | 83.8% |
| Self-Employed (Incorporated) | 0 | 0.0% |
| Self-Employed (Not Incorporated) | 33 | 14.4% |
| Not-for-profit Organizations | 0 | 0.0% |
| Local Government Employees | 0 | 0.0% |
| State Government Employees | 4 | 1.8% |
| Federal Government Employees | 0 | 0.0% |
| Unpaid Family Workers | 0 | 0.0% |
| Total | 229 | 100.0% |
Employment Status by Age in Hancocks Bridge
According to the labor force statistics for Hancocks Bridge, out of the total population over 16 years of age (285), 85.3% or 243 individuals are in the labor force, with 5.8% or 14 of them unemployed. The age group with the highest labor force participation rate is 20 to 24 years, with 100.0% or 50 individuals in the labor force. Within the labor force, the 35 to 44 years age range has the highest percentage of unemployed individuals, with 14.3% or 14 of them being unemployed.
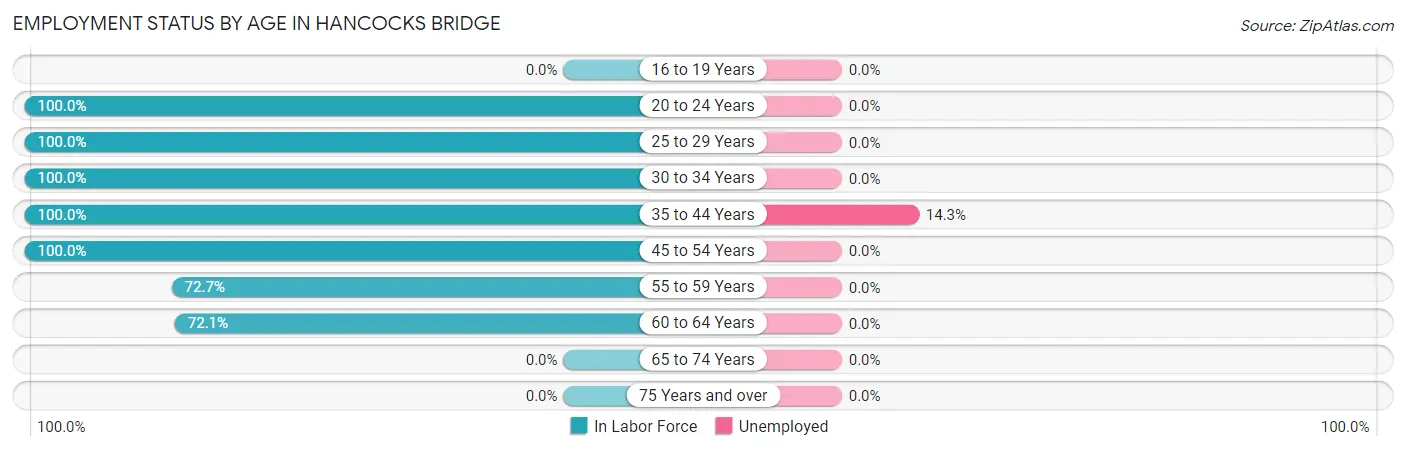
| Age Bracket | In Labor Force | Unemployed |
| 16 to 19 Years | 0 (0.0%) | 0 (0.0%) |
| 20 to 24 Years | 50 (100.0%) | 0 (0.0%) |
| 25 to 29 Years | 9 (100.0%) | 0 (0.0%) |
| 30 to 34 Years | 8 (100.0%) | 0 (0.0%) |
| 35 to 44 Years | 98 (100.0%) | 14 (14.3%) |
| 45 to 54 Years | 21 (100.0%) | 0 (0.0%) |
| 55 to 59 Years | 8 (72.7%) | 0 (0.0%) |
| 60 to 64 Years | 49 (72.1%) | 0 (0.0%) |
| 65 to 74 Years | 0 (0.0%) | 0 (0.0%) |
| 75 Years and over | 0 (0.0%) | 0 (0.0%) |
| Total | 243 (85.3%) | 14 (5.8%) |
Employment Status by Educational Attainment in Hancocks Bridge
According to labor force statistics for Hancocks Bridge, 89.8% of individuals (193) out of the total population between 25 and 64 years of age (215) are in the labor force, with 7.3% or 14 of them being unemployed. The group with the highest labor force participation rate are those with the educational attainment of college / associate degree, with 100.0% or 72 individuals in the labor force. Within the labor force, individuals with high school diploma education have the highest percentage of unemployment, with 14.0% or 14 of them being unemployed.
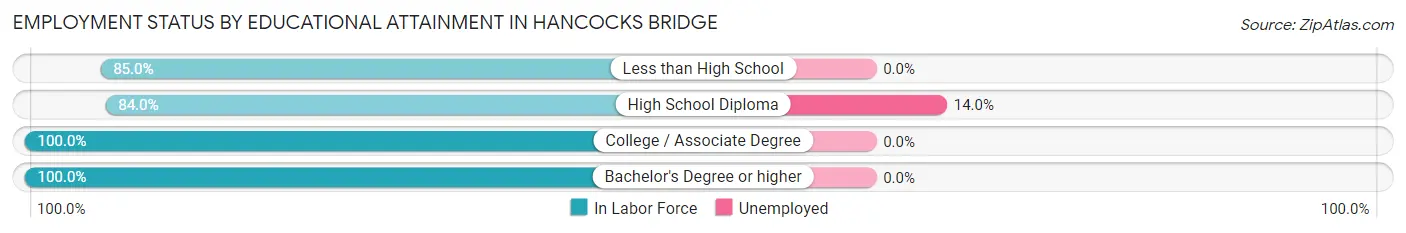
| Educational Attainment | In Labor Force | Unemployed |
| Less than High School | 17 (85.0%) | 0 (0.0%) |
| High School Diploma | 100 (84.0%) | 17 (14.0%) |
| College / Associate Degree | 72 (100.0%) | 0 (0.0%) |
| Bachelor's Degree or higher | 4 (100.0%) | 0 (0.0%) |
| Total | 193 (89.8%) | 16 (7.3%) |
Employment Occupations by Sex in Hancocks Bridge
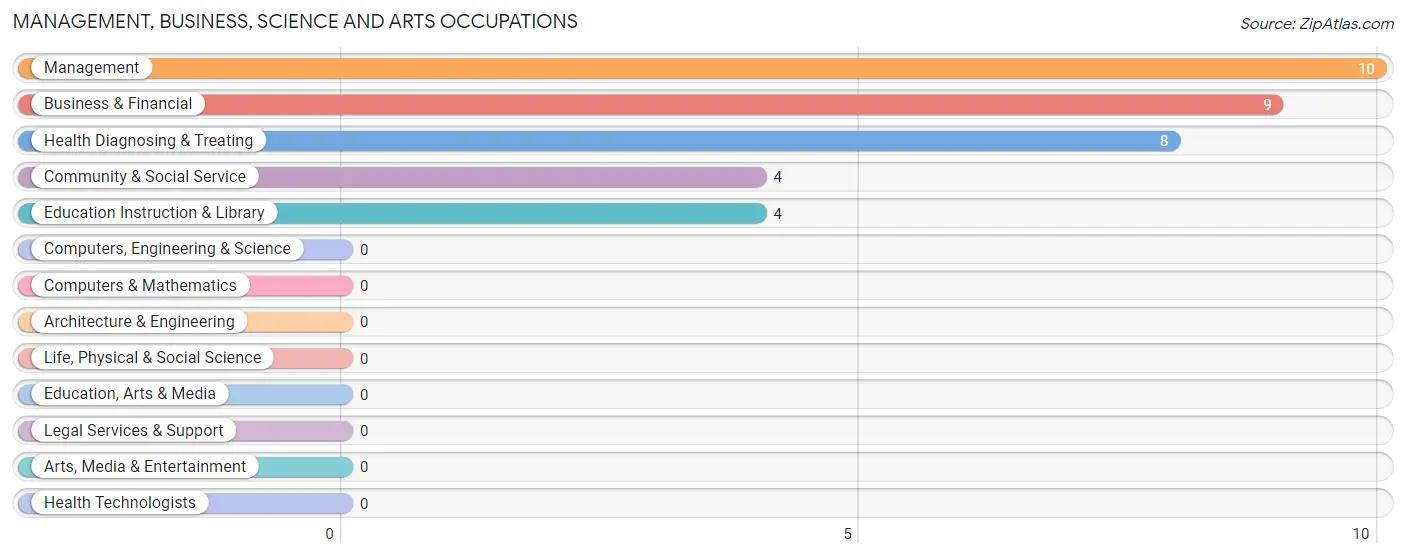
Management, Business, Science and Arts Occupations
The most common Management, Business, Science and Arts occupations in Hancocks Bridge are Management (10 | 4.4%), Business & Financial (9 | 3.9%), Health Diagnosing & Treating (8 | 3.5%), Community & Social Service (4 | 1.8%), and Education Instruction & Library (4 | 1.8%).
Management, Business, Science and Arts Occupations by Sex
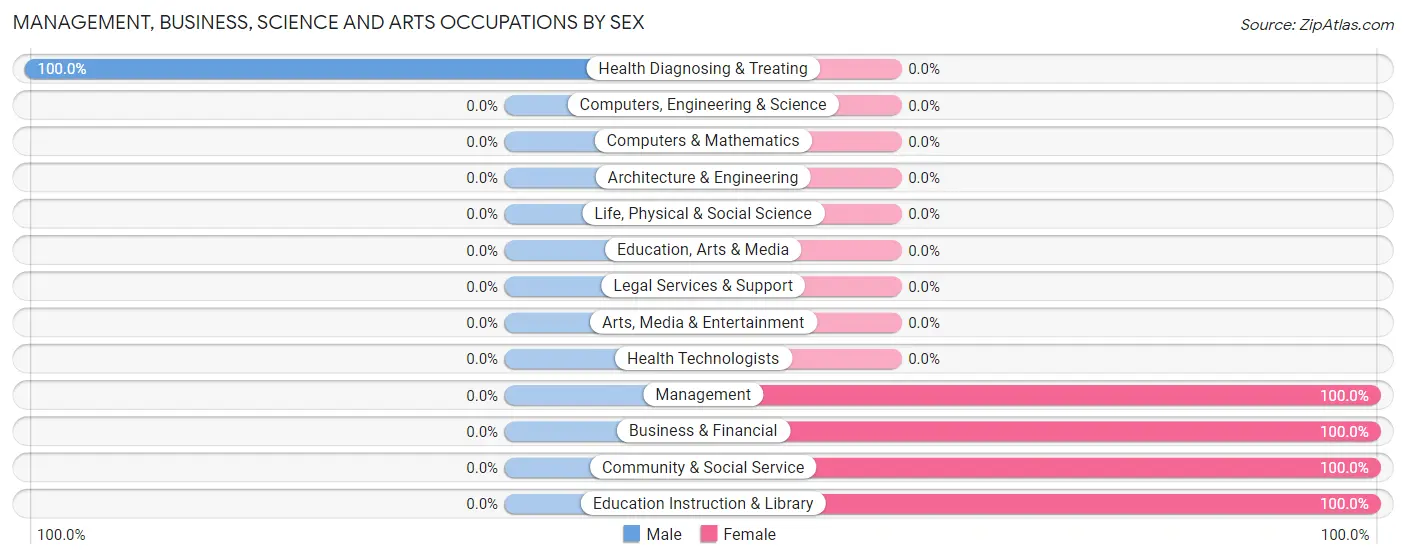
| Occupation | Male | Female |
| Management | 0 (0.0%) | 10 (100.0%) |
| Business & Financial | 0 (0.0%) | 9 (100.0%) |
| Computers, Engineering & Science | 0 (0.0%) | 0 (0.0%) |
| Computers & Mathematics | 0 (0.0%) | 0 (0.0%) |
| Architecture & Engineering | 0 (0.0%) | 0 (0.0%) |
| Life, Physical & Social Science | 0 (0.0%) | 0 (0.0%) |
| Community & Social Service | 0 (0.0%) | 4 (100.0%) |
| Education, Arts & Media | 0 (0.0%) | 0 (0.0%) |
| Legal Services & Support | 0 (0.0%) | 0 (0.0%) |
| Education Instruction & Library | 0 (0.0%) | 4 (100.0%) |
| Arts, Media & Entertainment | 0 (0.0%) | 0 (0.0%) |
| Health Diagnosing & Treating | 8 (100.0%) | 0 (0.0%) |
| Health Technologists | 0 (0.0%) | 0 (0.0%) |
| Total (Category) | 8 (25.8%) | 23 (74.2%) |
| Total (Overall) | 150 (65.5%) | 79 (34.5%) |
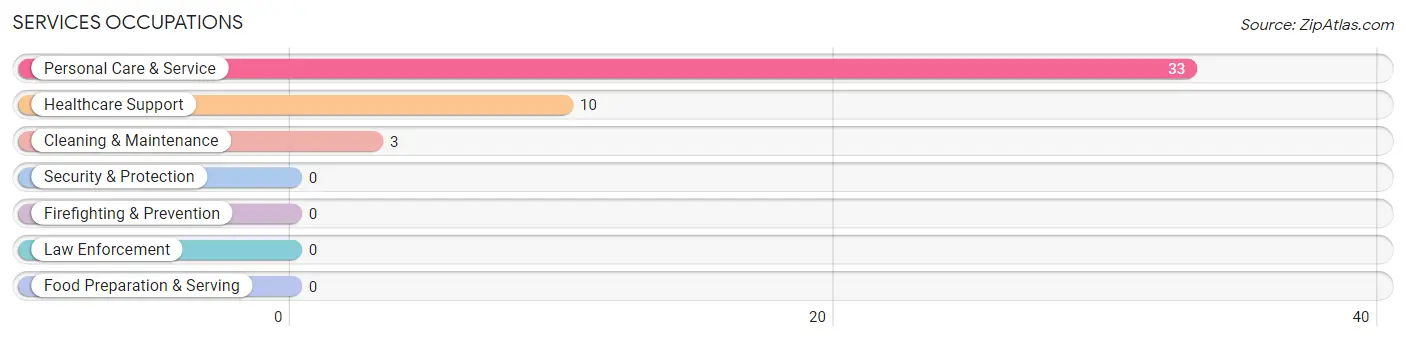
Services Occupations
The most common Services occupations in Hancocks Bridge are Personal Care & Service (33 | 14.4%), Healthcare Support (10 | 4.4%), and Cleaning & Maintenance (3 | 1.3%).
Services Occupations by Sex
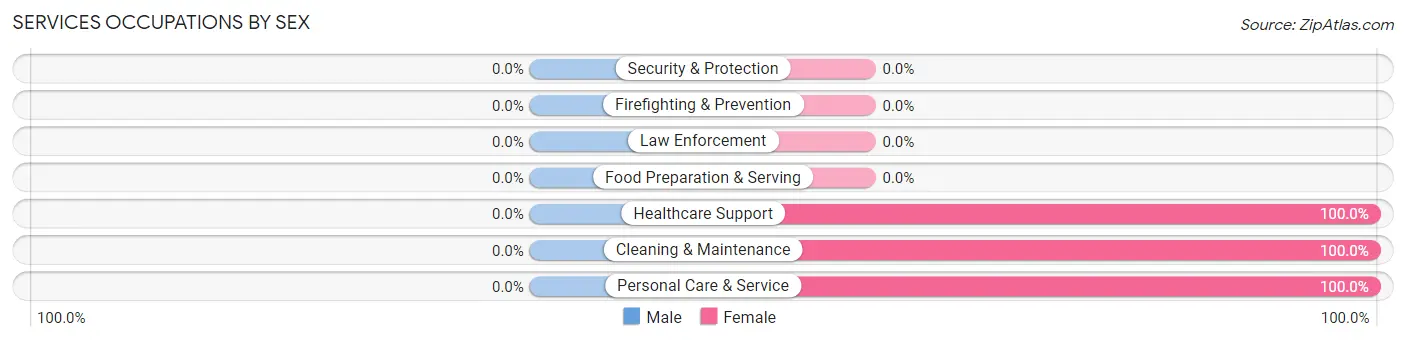
| Occupation | Male | Female |
| Healthcare Support | 0 (0.0%) | 10 (100.0%) |
| Security & Protection | 0 (0.0%) | 0 (0.0%) |
| Firefighting & Prevention | 0 (0.0%) | 0 (0.0%) |
| Law Enforcement | 0 (0.0%) | 0 (0.0%) |
| Food Preparation & Serving | 0 (0.0%) | 0 (0.0%) |
| Cleaning & Maintenance | 0 (0.0%) | 3 (100.0%) |
| Personal Care & Service | 0 (0.0%) | 33 (100.0%) |
| Total (Category) | 0 (0.0%) | 46 (100.0%) |
| Total (Overall) | 150 (65.5%) | 79 (34.5%) |
Sales and Office Occupations
The most common Sales and Office occupations in Hancocks Bridge are Sales & Related (47 | 20.5%), and Office & Administration (22 | 9.6%).
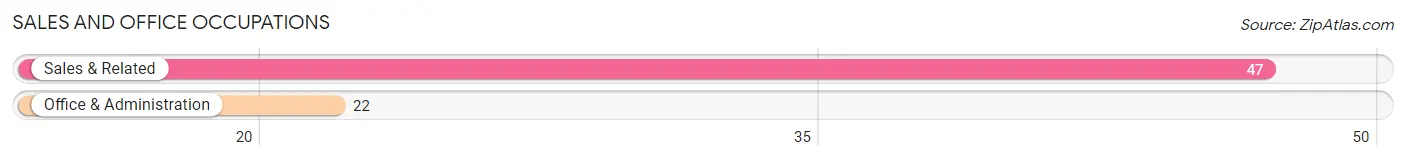
Sales and Office Occupations by Sex
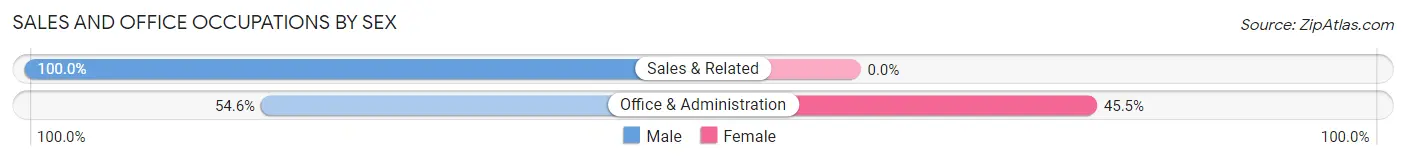
| Occupation | Male | Female |
| Sales & Related | 47 (100.0%) | 0 (0.0%) |
| Office & Administration | 12 (54.5%) | 10 (45.5%) |
| Total (Category) | 59 (85.5%) | 10 (14.5%) |
| Total (Overall) | 150 (65.5%) | 79 (34.5%) |
Natural Resources, Construction and Maintenance Occupations
The most common Natural Resources, Construction and Maintenance occupations in Hancocks Bridge are Construction & Extraction (45 | 19.7%), and Farming, Fishing & Forestry (2 | 0.9%).
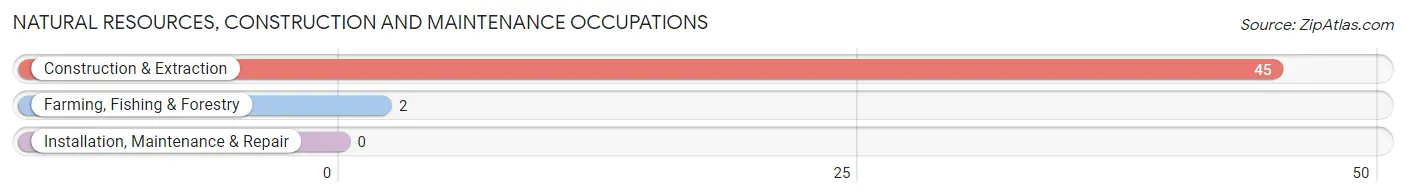
Natural Resources, Construction and Maintenance Occupations by Sex
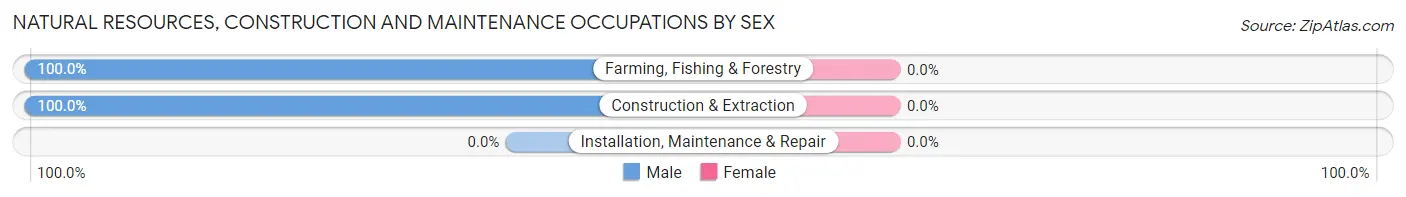
| Occupation | Male | Female |
| Farming, Fishing & Forestry | 2 (100.0%) | 0 (0.0%) |
| Construction & Extraction | 45 (100.0%) | 0 (0.0%) |
| Installation, Maintenance & Repair | 0 (0.0%) | 0 (0.0%) |
| Total (Category) | 47 (100.0%) | 0 (0.0%) |
| Total (Overall) | 150 (65.5%) | 79 (34.5%) |
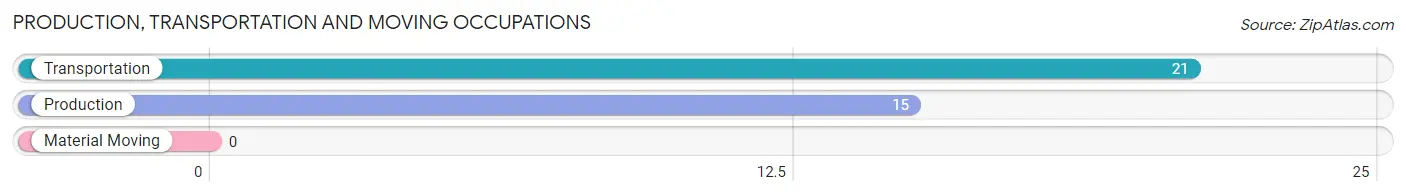
Production, Transportation and Moving Occupations
The most common Production, Transportation and Moving occupations in Hancocks Bridge are Transportation (21 | 9.2%), and Production (15 | 6.6%).
Production, Transportation and Moving Occupations by Sex
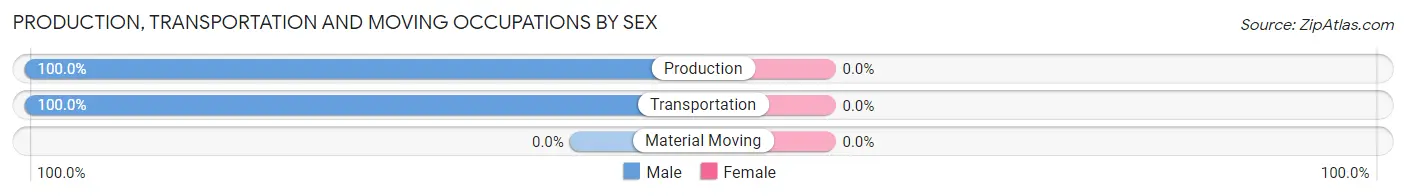
| Occupation | Male | Female |
| Production | 15 (100.0%) | 0 (0.0%) |
| Transportation | 21 (100.0%) | 0 (0.0%) |
| Material Moving | 0 (0.0%) | 0 (0.0%) |
| Total (Category) | 36 (100.0%) | 0 (0.0%) |
| Total (Overall) | 150 (65.5%) | 79 (34.5%) |
Employment Industries by Sex in Hancocks Bridge
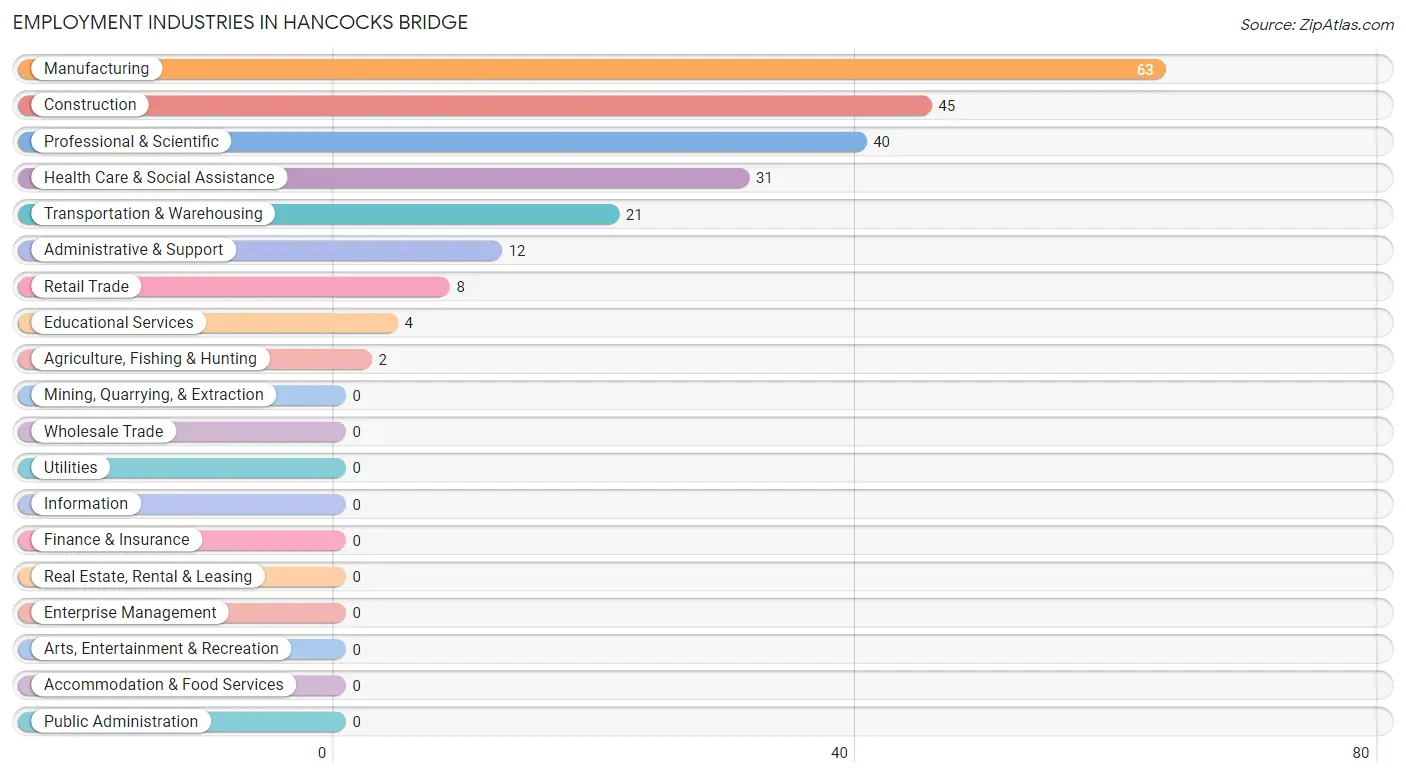
Employment Industries in Hancocks Bridge
The major employment industries in Hancocks Bridge include Manufacturing (63 | 27.5%), Construction (45 | 19.7%), Professional & Scientific (40 | 17.5%), Health Care & Social Assistance (31 | 13.5%), and Transportation & Warehousing (21 | 9.2%).
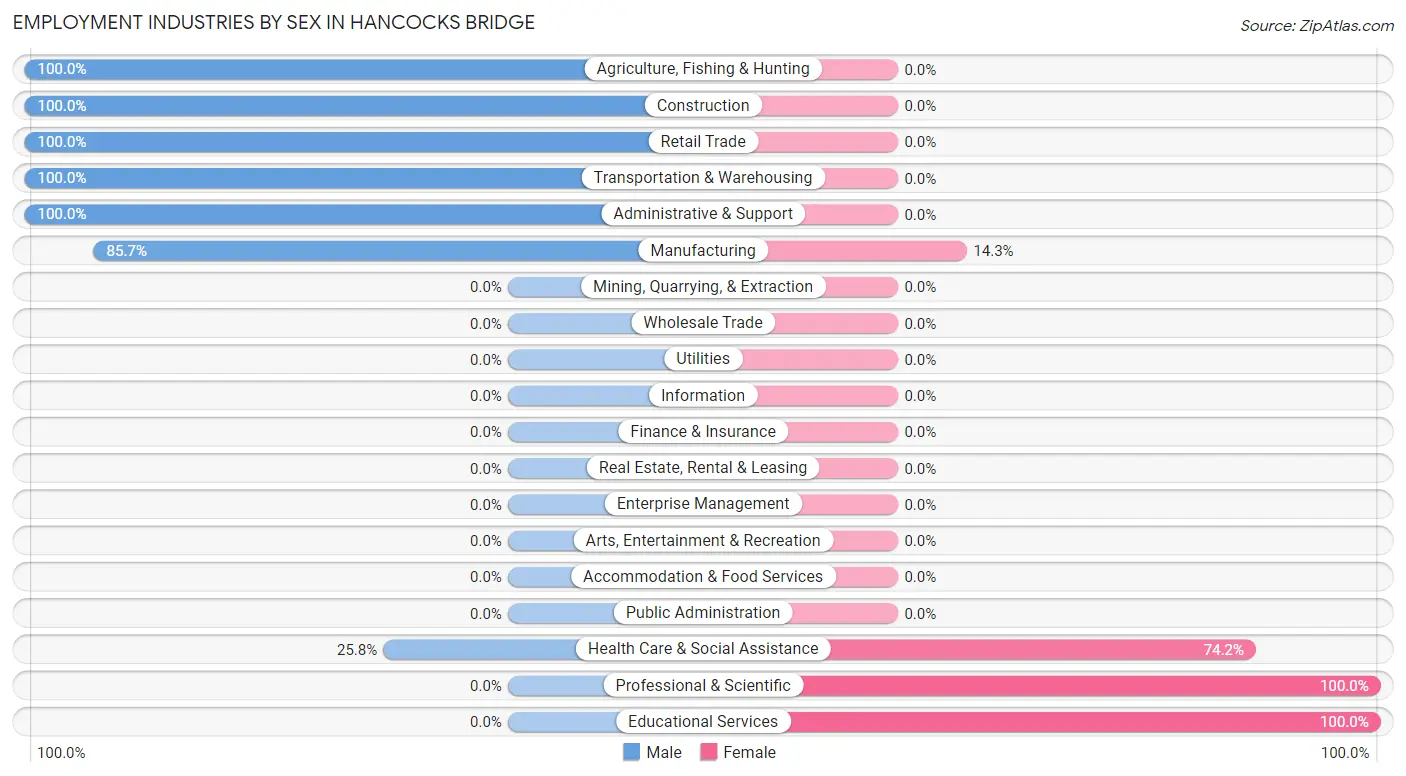
Employment Industries by Sex in Hancocks Bridge
The Hancocks Bridge industries that see more men than women are Agriculture, Fishing & Hunting (100.0%), Construction (100.0%), and Retail Trade (100.0%), whereas the industries that tend to have a higher number of women are Professional & Scientific (100.0%), Educational Services (100.0%), and Health Care & Social Assistance (74.2%).
| Industry | Male | Female |
| Agriculture, Fishing & Hunting | 2 (100.0%) | 0 (0.0%) |
| Mining, Quarrying, & Extraction | 0 (0.0%) | 0 (0.0%) |
| Construction | 45 (100.0%) | 0 (0.0%) |
| Manufacturing | 54 (85.7%) | 9 (14.3%) |
| Wholesale Trade | 0 (0.0%) | 0 (0.0%) |
| Retail Trade | 8 (100.0%) | 0 (0.0%) |
| Transportation & Warehousing | 21 (100.0%) | 0 (0.0%) |
| Utilities | 0 (0.0%) | 0 (0.0%) |
| Information | 0 (0.0%) | 0 (0.0%) |
| Finance & Insurance | 0 (0.0%) | 0 (0.0%) |
| Real Estate, Rental & Leasing | 0 (0.0%) | 0 (0.0%) |
| Professional & Scientific | 0 (0.0%) | 40 (100.0%) |
| Enterprise Management | 0 (0.0%) | 0 (0.0%) |
| Administrative & Support | 12 (100.0%) | 0 (0.0%) |
| Educational Services | 0 (0.0%) | 4 (100.0%) |
| Health Care & Social Assistance | 8 (25.8%) | 23 (74.2%) |
| Arts, Entertainment & Recreation | 0 (0.0%) | 0 (0.0%) |
| Accommodation & Food Services | 0 (0.0%) | 0 (0.0%) |
| Public Administration | 0 (0.0%) | 0 (0.0%) |
| Total | 150 (65.5%) | 79 (34.5%) |
Education in Hancocks Bridge
School Enrollment in Hancocks Bridge
The most common levels of schooling among the 62 students in Hancocks Bridge are middle school (21 | 33.9%), high school (14 | 22.6%), and elementary school (11 | 17.7%).
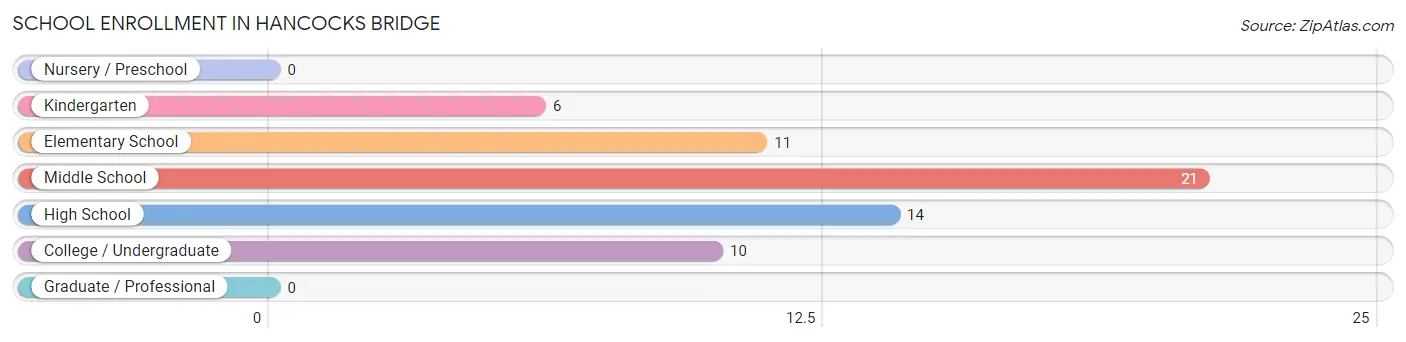
| School Level | # Students | % Students |
| Nursery / Preschool | 0 | 0.0% |
| Kindergarten | 6 | 9.7% |
| Elementary School | 11 | 17.7% |
| Middle School | 21 | 33.9% |
| High School | 14 | 22.6% |
| College / Undergraduate | 10 | 16.1% |
| Graduate / Professional | 0 | 0.0% |
| Total | 62 | 100.0% |
School Enrollment by Age by Funding Source in Hancocks Bridge
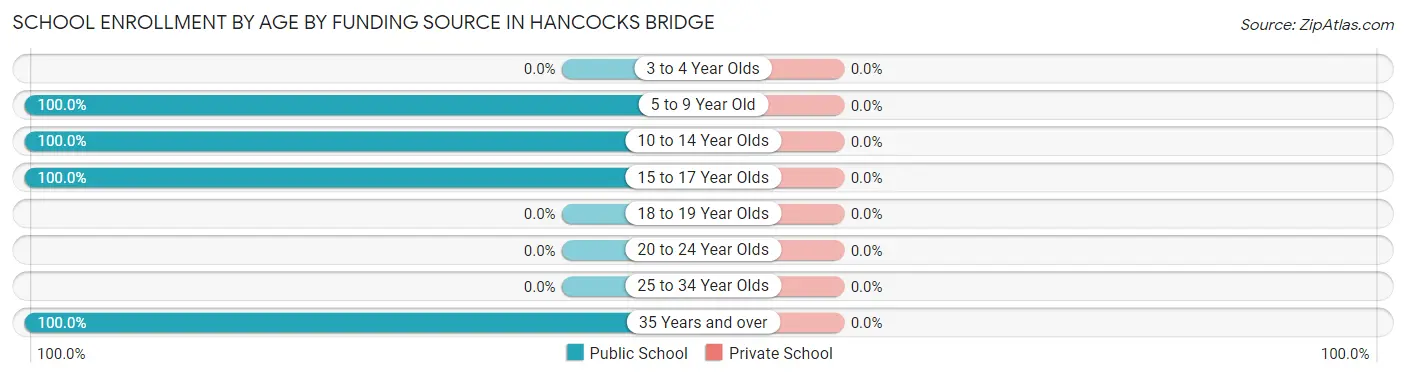
| Age Bracket | Public School | Private School |
| 3 to 4 Year Olds | 0 (0.0%) | 0 (0.0%) |
| 5 to 9 Year Old | 17 (100.0%) | 0 (0.0%) |
| 10 to 14 Year Olds | 21 (100.0%) | 0 (0.0%) |
| 15 to 17 Year Olds | 14 (100.0%) | 0 (0.0%) |
| 18 to 19 Year Olds | 0 (0.0%) | 0 (0.0%) |
| 20 to 24 Year Olds | 0 (0.0%) | 0 (0.0%) |
| 25 to 34 Year Olds | 0 (0.0%) | 0 (0.0%) |
| 35 Years and over | 10 (100.0%) | 0 (0.0%) |
| Total | 62 (100.0%) | 0 (0.0%) |
Educational Attainment by Field of Study in Hancocks Bridge
, and liberal arts & history (4 | 100.0%) are the most common fields of study among 4 individuals in Hancocks Bridge who have obtained a bachelor's degree or higher.
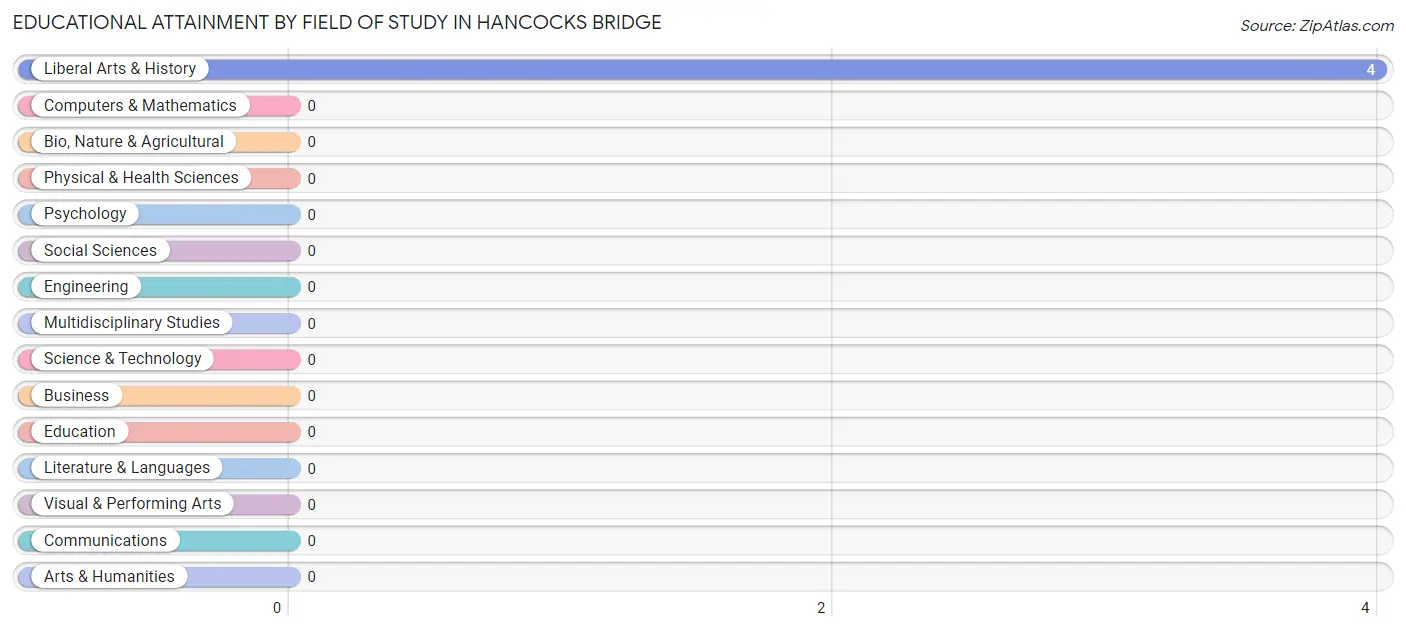
| Field of Study | # Graduates | % Graduates |
| Computers & Mathematics | 0 | 0.0% |
| Bio, Nature & Agricultural | 0 | 0.0% |
| Physical & Health Sciences | 0 | 0.0% |
| Psychology | 0 | 0.0% |
| Social Sciences | 0 | 0.0% |
| Engineering | 0 | 0.0% |
| Multidisciplinary Studies | 0 | 0.0% |
| Science & Technology | 0 | 0.0% |
| Business | 0 | 0.0% |
| Education | 0 | 0.0% |
| Literature & Languages | 0 | 0.0% |
| Liberal Arts & History | 4 | 100.0% |
| Visual & Performing Arts | 0 | 0.0% |
| Communications | 0 | 0.0% |
| Arts & Humanities | 0 | 0.0% |
| Total | 4 | 100.0% |
Transportation & Commute in Hancocks Bridge
Vehicle Availability by Sex in Hancocks Bridge
The most prevalent vehicle ownership categories in Hancocks Bridge are males with 2 vehicles (84, accounting for 56.0%) and females with 2 vehicles (50, making up 106.3%).
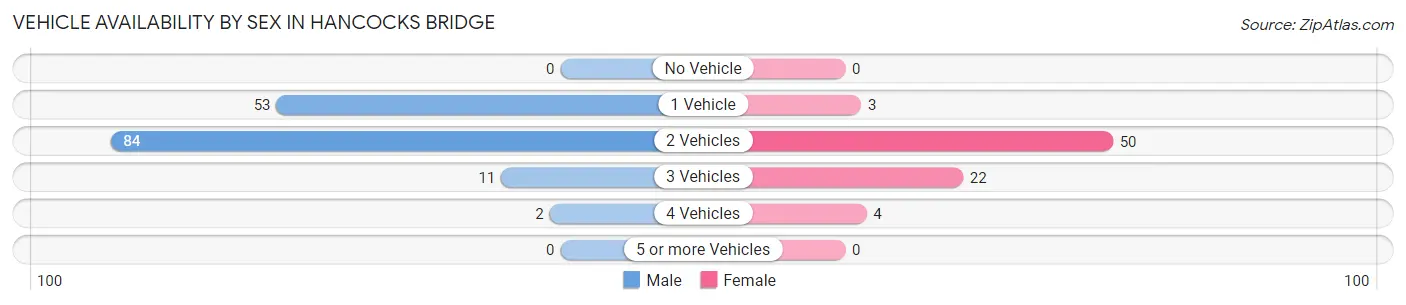
| Vehicles Available | Male | Female |
| No Vehicle | 0 (0.0%) | 0 (0.0%) |
| 1 Vehicle | 53 (35.3%) | 3 (3.8%) |
| 2 Vehicles | 84 (56.0%) | 50 (63.3%) |
| 3 Vehicles | 11 (7.3%) | 22 (27.9%) |
| 4 Vehicles | 2 (1.3%) | 4 (5.1%) |
| 5 or more Vehicles | 0 (0.0%) | 0 (0.0%) |
| Total | 150 (100.0%) | 79 (100.0%) |
Commute Time in Hancocks Bridge
The most frequently occuring commute durations in Hancocks Bridge are 25 to 29 minutes (40 commuters, 19.1%), 30 to 34 minutes (39 commuters, 18.7%), and 45 to 59 minutes (32 commuters, 15.3%).
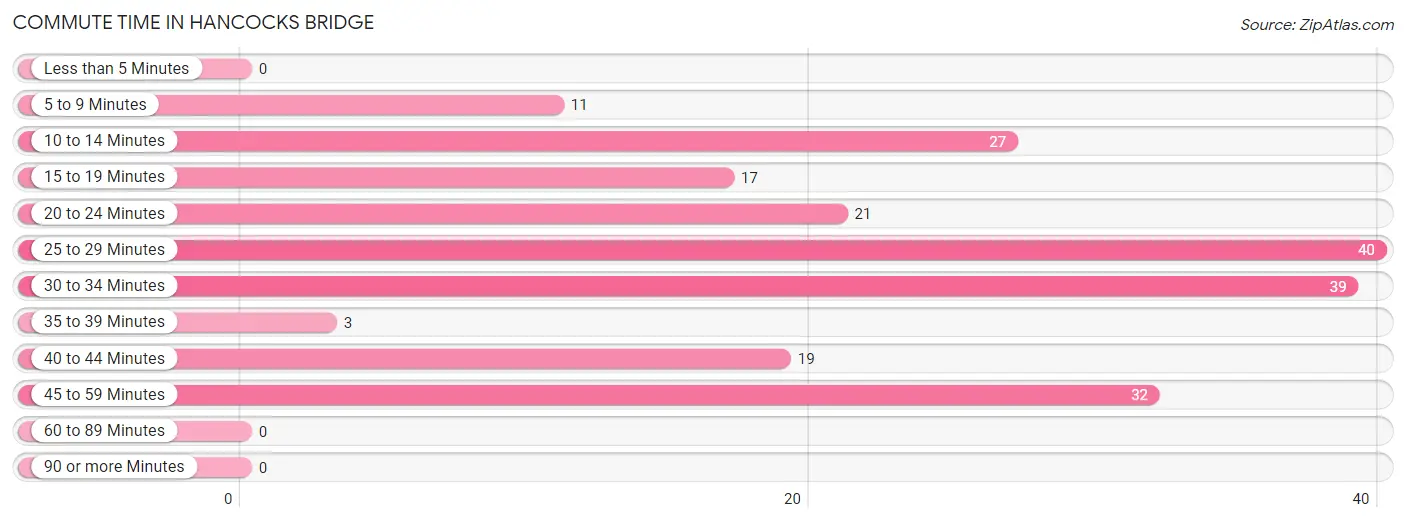
| Commute Time | # Commuters | % Commuters |
| Less than 5 Minutes | 0 | 0.0% |
| 5 to 9 Minutes | 11 | 5.3% |
| 10 to 14 Minutes | 27 | 12.9% |
| 15 to 19 Minutes | 17 | 8.1% |
| 20 to 24 Minutes | 21 | 10.1% |
| 25 to 29 Minutes | 40 | 19.1% |
| 30 to 34 Minutes | 39 | 18.7% |
| 35 to 39 Minutes | 3 | 1.4% |
| 40 to 44 Minutes | 19 | 9.1% |
| 45 to 59 Minutes | 32 | 15.3% |
| 60 to 89 Minutes | 0 | 0.0% |
| 90 or more Minutes | 0 | 0.0% |
Commute Time by Sex in Hancocks Bridge
The most common commute times in Hancocks Bridge are 30 to 34 minutes (39 commuters, 30.0%) for males and 25 to 29 minutes (40 commuters, 50.6%) for females.
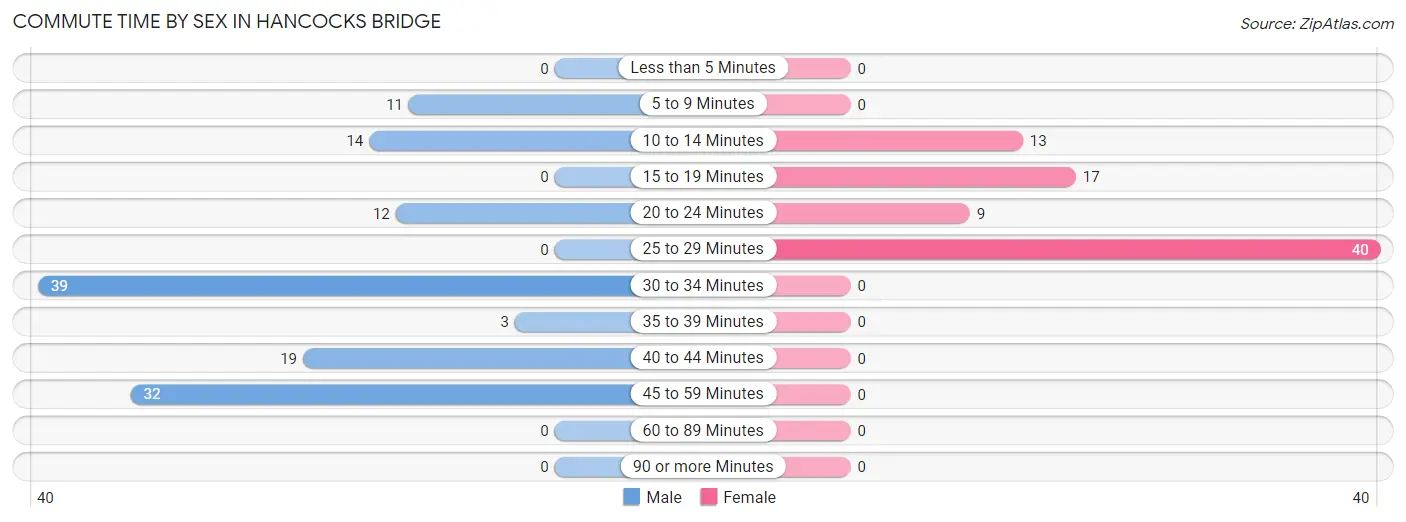
| Commute Time | Male | Female |
| Less than 5 Minutes | 0 (0.0%) | 0 (0.0%) |
| 5 to 9 Minutes | 11 (8.5%) | 0 (0.0%) |
| 10 to 14 Minutes | 14 (10.8%) | 13 (16.5%) |
| 15 to 19 Minutes | 0 (0.0%) | 17 (21.5%) |
| 20 to 24 Minutes | 12 (9.2%) | 9 (11.4%) |
| 25 to 29 Minutes | 0 (0.0%) | 40 (50.6%) |
| 30 to 34 Minutes | 39 (30.0%) | 0 (0.0%) |
| 35 to 39 Minutes | 3 (2.3%) | 0 (0.0%) |
| 40 to 44 Minutes | 19 (14.6%) | 0 (0.0%) |
| 45 to 59 Minutes | 32 (24.6%) | 0 (0.0%) |
| 60 to 89 Minutes | 0 (0.0%) | 0 (0.0%) |
| 90 or more Minutes | 0 (0.0%) | 0 (0.0%) |
Time of Departure to Work by Sex in Hancocks Bridge
The most frequent times of departure to work in Hancocks Bridge are 4:00 PM to 11:59 PM (51, 39.2%) for males and 8:00 AM to 8:29 AM (40, 50.6%) for females.
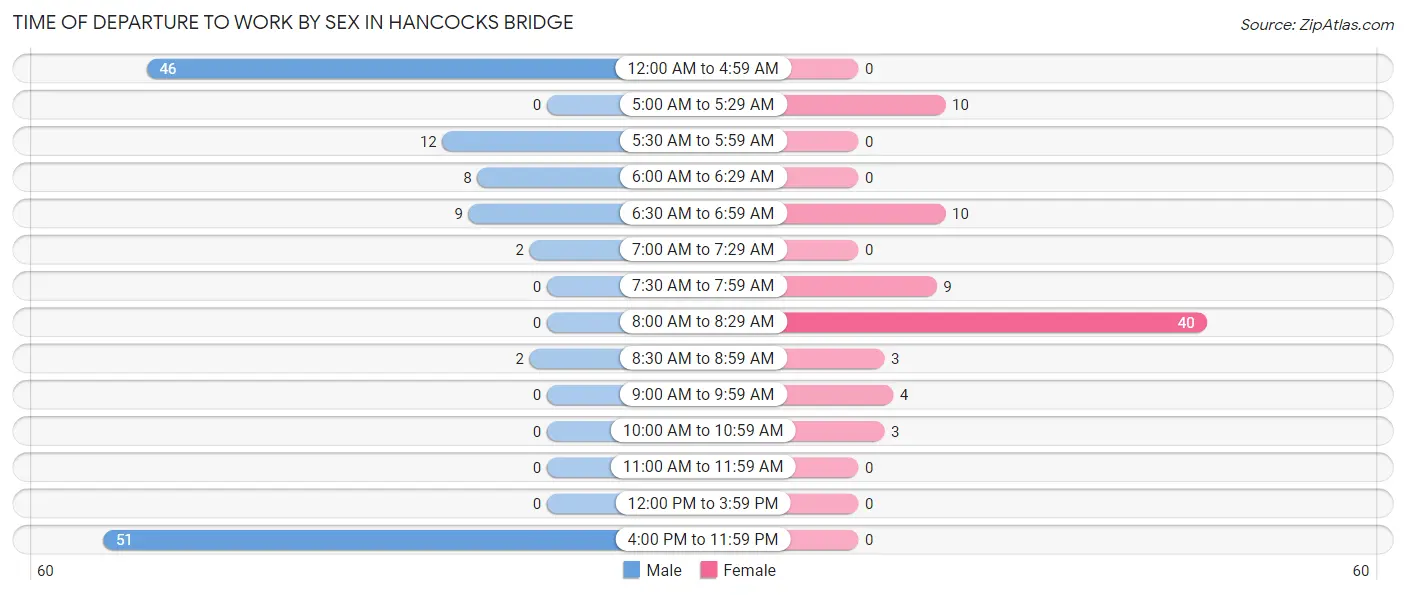
| Time of Departure | Male | Female |
| 12:00 AM to 4:59 AM | 46 (35.4%) | 0 (0.0%) |
| 5:00 AM to 5:29 AM | 0 (0.0%) | 10 (12.7%) |
| 5:30 AM to 5:59 AM | 12 (9.2%) | 0 (0.0%) |
| 6:00 AM to 6:29 AM | 8 (6.1%) | 0 (0.0%) |
| 6:30 AM to 6:59 AM | 9 (6.9%) | 10 (12.7%) |
| 7:00 AM to 7:29 AM | 2 (1.5%) | 0 (0.0%) |
| 7:30 AM to 7:59 AM | 0 (0.0%) | 9 (11.4%) |
| 8:00 AM to 8:29 AM | 0 (0.0%) | 40 (50.6%) |
| 8:30 AM to 8:59 AM | 2 (1.5%) | 3 (3.8%) |
| 9:00 AM to 9:59 AM | 0 (0.0%) | 4 (5.1%) |
| 10:00 AM to 10:59 AM | 0 (0.0%) | 3 (3.8%) |
| 11:00 AM to 11:59 AM | 0 (0.0%) | 0 (0.0%) |
| 12:00 PM to 3:59 PM | 0 (0.0%) | 0 (0.0%) |
| 4:00 PM to 11:59 PM | 51 (39.2%) | 0 (0.0%) |
| Total | 130 (100.0%) | 79 (100.0%) |
Housing Occupancy in Hancocks Bridge
Occupancy by Ownership in Hancocks Bridge
Of the total 141 dwellings in Hancocks Bridge, owner-occupied units account for 70 (49.6%), while renter-occupied units make up 71 (50.3%).
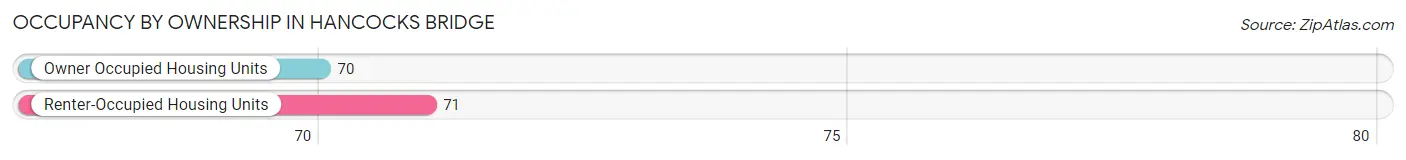
| Occupancy | # Housing Units | % Housing Units |
| Owner Occupied Housing Units | 70 | 49.6% |
| Renter-Occupied Housing Units | 71 | 50.3% |
| Total Occupied Housing Units | 141 | 100.0% |
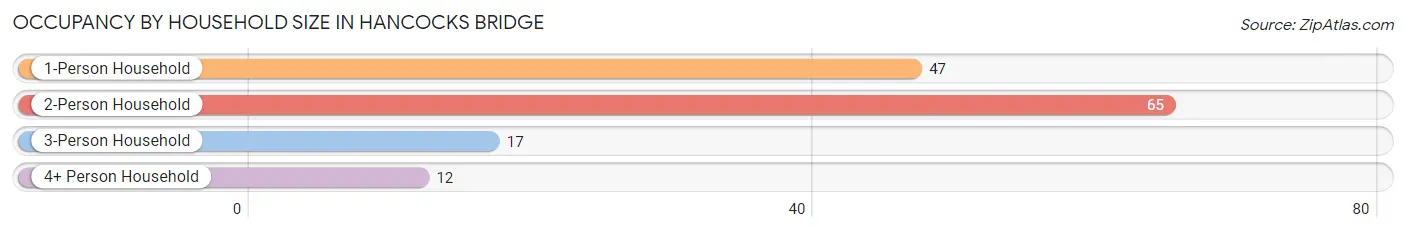
Occupancy by Household Size in Hancocks Bridge
| Household Size | # Housing Units | % Housing Units |
| 1-Person Household | 47 | 33.3% |
| 2-Person Household | 65 | 46.1% |
| 3-Person Household | 17 | 12.1% |
| 4+ Person Household | 12 | 8.5% |
| Total Housing Units | 141 | 100.0% |
Occupancy by Ownership by Household Size in Hancocks Bridge
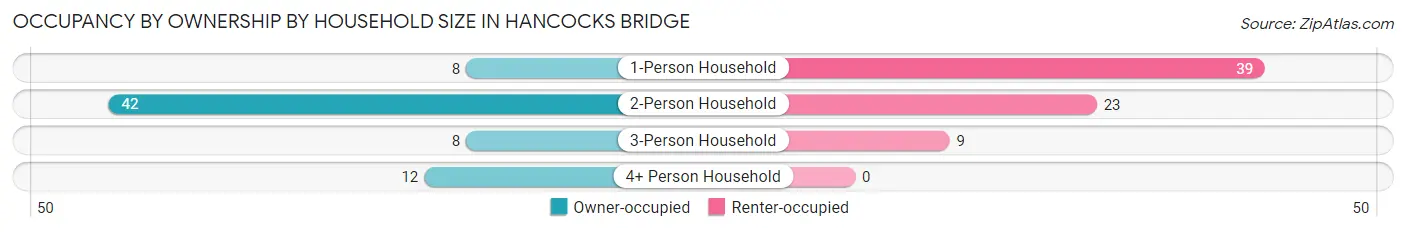
| Household Size | Owner-occupied | Renter-occupied |
| 1-Person Household | 8 (17.0%) | 39 (83.0%) |
| 2-Person Household | 42 (64.6%) | 23 (35.4%) |
| 3-Person Household | 8 (47.1%) | 9 (52.9%) |
| 4+ Person Household | 12 (100.0%) | 0 (0.0%) |
| Total Housing Units | 70 (49.6%) | 71 (50.3%) |
Occupancy by Educational Attainment in Hancocks Bridge
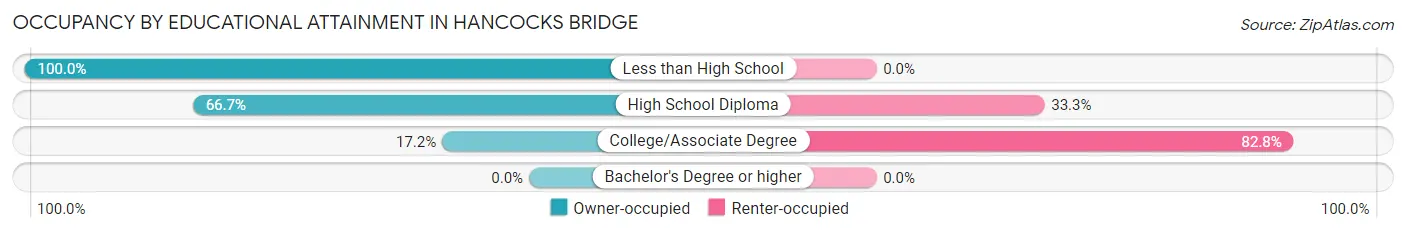
| Household Size | Owner-occupied | Renter-occupied |
| Less than High School | 14 (100.0%) | 0 (0.0%) |
| High School Diploma | 46 (66.7%) | 23 (33.3%) |
| College/Associate Degree | 10 (17.2%) | 48 (82.8%) |
| Bachelor's Degree or higher | 0 (0.0%) | 0 (0.0%) |
Occupancy by Age of Householder in Hancocks Bridge
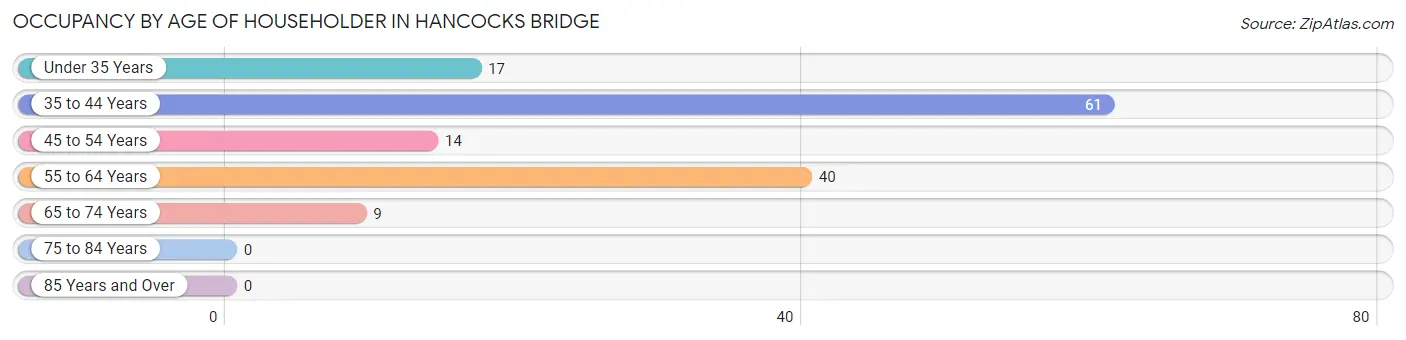
| Age Bracket | # Households | % Households |
| Under 35 Years | 17 | 12.1% |
| 35 to 44 Years | 61 | 43.3% |
| 45 to 54 Years | 14 | 9.9% |
| 55 to 64 Years | 40 | 28.4% |
| 65 to 74 Years | 9 | 6.4% |
| 75 to 84 Years | 0 | 0.0% |
| 85 Years and Over | 0 | 0.0% |
| Total | 141 | 100.0% |
Housing Finances in Hancocks Bridge
Median Income by Occupancy in Hancocks Bridge
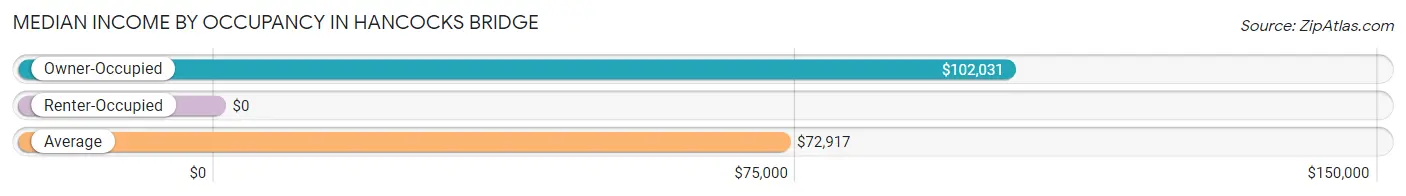
| Occupancy Type | # Households | Median Income |
| Owner-Occupied | 70 (49.6%) | $102,031 |
| Renter-Occupied | 71 (50.3%) | $0 |
| Average | 141 (100.0%) | $72,917 |
Occupancy by Householder Income Bracket in Hancocks Bridge
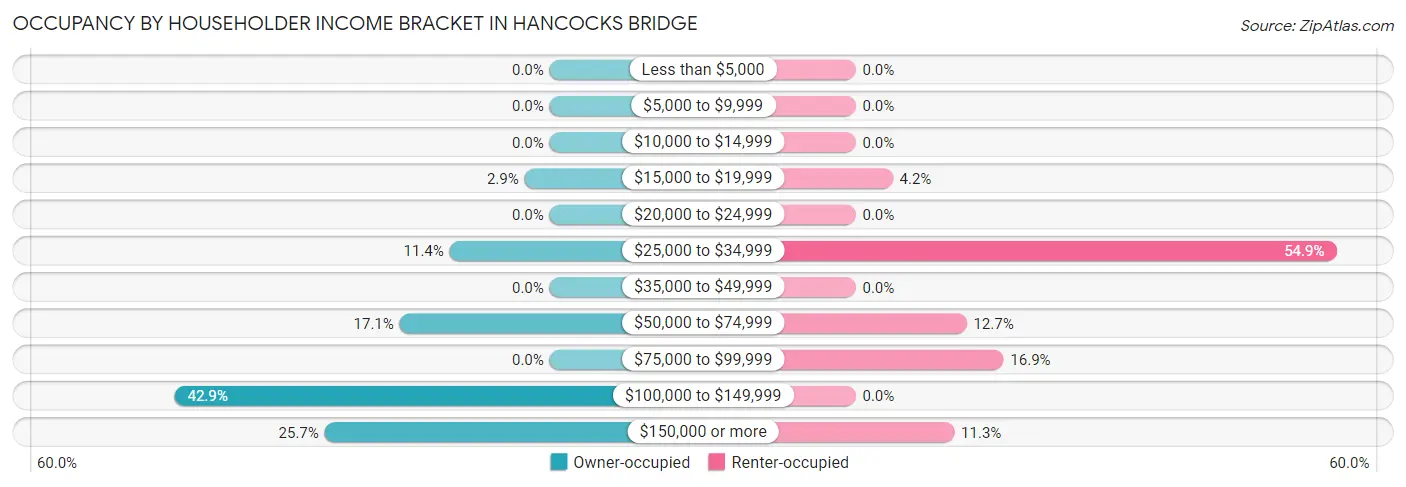
| Income Bracket | Owner-occupied | Renter-occupied |
| Less than $5,000 | 0 (0.0%) | 0 (0.0%) |
| $5,000 to $9,999 | 0 (0.0%) | 0 (0.0%) |
| $10,000 to $14,999 | 0 (0.0%) | 0 (0.0%) |
| $15,000 to $19,999 | 2 (2.9%) | 3 (4.2%) |
| $20,000 to $24,999 | 0 (0.0%) | 0 (0.0%) |
| $25,000 to $34,999 | 8 (11.4%) | 39 (54.9%) |
| $35,000 to $49,999 | 0 (0.0%) | 0 (0.0%) |
| $50,000 to $74,999 | 12 (17.1%) | 9 (12.7%) |
| $75,000 to $99,999 | 0 (0.0%) | 12 (16.9%) |
| $100,000 to $149,999 | 30 (42.9%) | 0 (0.0%) |
| $150,000 or more | 18 (25.7%) | 8 (11.3%) |
| Total | 70 (100.0%) | 71 (100.0%) |
Monthly Housing Cost Tiers in Hancocks Bridge
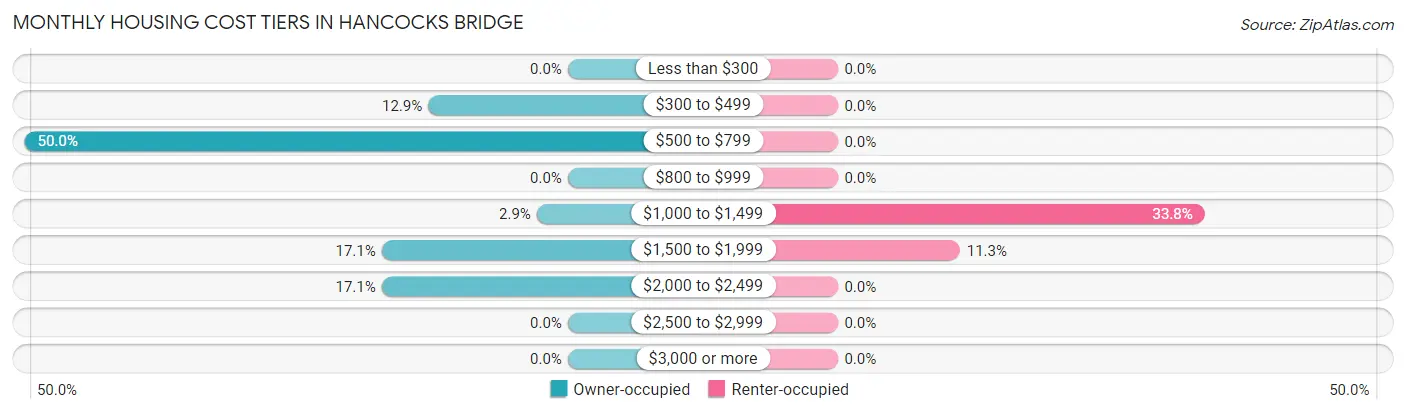
| Monthly Cost | Owner-occupied | Renter-occupied |
| Less than $300 | 0 (0.0%) | 0 (0.0%) |
| $300 to $499 | 9 (12.9%) | 0 (0.0%) |
| $500 to $799 | 35 (50.0%) | 0 (0.0%) |
| $800 to $999 | 0 (0.0%) | 0 (0.0%) |
| $1,000 to $1,499 | 2 (2.9%) | 24 (33.8%) |
| $1,500 to $1,999 | 12 (17.1%) | 8 (11.3%) |
| $2,000 to $2,499 | 12 (17.1%) | 0 (0.0%) |
| $2,500 to $2,999 | 0 (0.0%) | 0 (0.0%) |
| $3,000 or more | 0 (0.0%) | 0 (0.0%) |
| Total | 70 (100.0%) | 71 (100.0%) |
Physical Housing Characteristics in Hancocks Bridge
Housing Structures in Hancocks Bridge
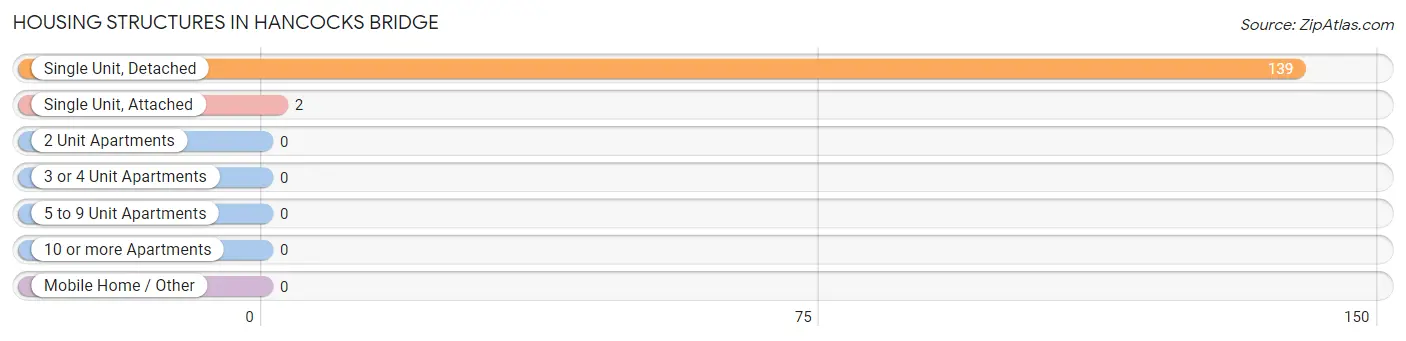
| Structure Type | # Housing Units | % Housing Units |
| Single Unit, Detached | 139 | 98.6% |
| Single Unit, Attached | 2 | 1.4% |
| 2 Unit Apartments | 0 | 0.0% |
| 3 or 4 Unit Apartments | 0 | 0.0% |
| 5 to 9 Unit Apartments | 0 | 0.0% |
| 10 or more Apartments | 0 | 0.0% |
| Mobile Home / Other | 0 | 0.0% |
| Total | 141 | 100.0% |
Housing Structures by Occupancy in Hancocks Bridge
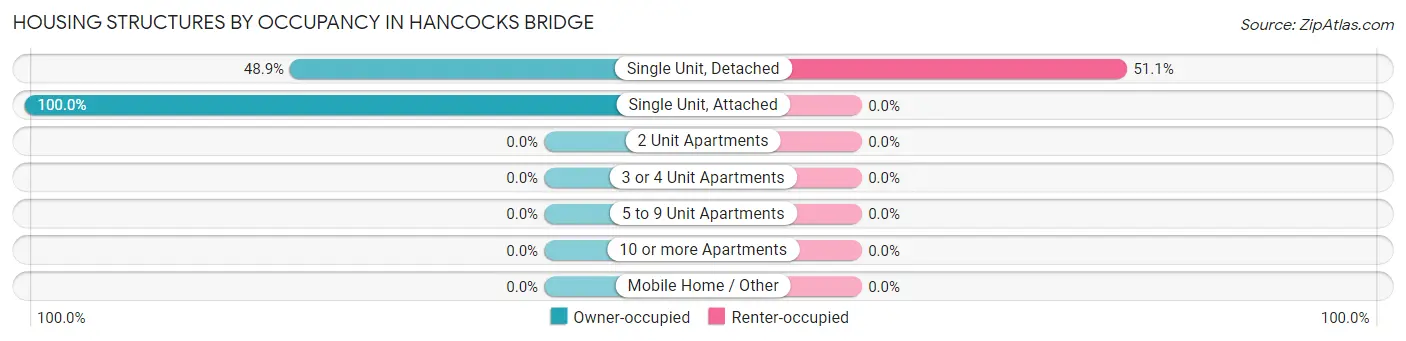
| Structure Type | Owner-occupied | Renter-occupied |
| Single Unit, Detached | 68 (48.9%) | 71 (51.1%) |
| Single Unit, Attached | 2 (100.0%) | 0 (0.0%) |
| 2 Unit Apartments | 0 (0.0%) | 0 (0.0%) |
| 3 or 4 Unit Apartments | 0 (0.0%) | 0 (0.0%) |
| 5 to 9 Unit Apartments | 0 (0.0%) | 0 (0.0%) |
| 10 or more Apartments | 0 (0.0%) | 0 (0.0%) |
| Mobile Home / Other | 0 (0.0%) | 0 (0.0%) |
| Total | 70 (49.6%) | 71 (50.3%) |
Housing Structures by Number of Rooms in Hancocks Bridge
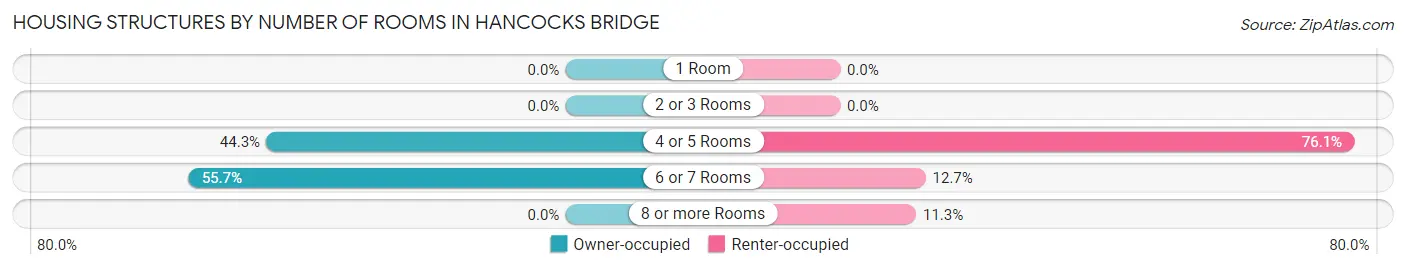
| Number of Rooms | Owner-occupied | Renter-occupied |
| 1 Room | 0 (0.0%) | 0 (0.0%) |
| 2 or 3 Rooms | 0 (0.0%) | 0 (0.0%) |
| 4 or 5 Rooms | 31 (44.3%) | 54 (76.1%) |
| 6 or 7 Rooms | 39 (55.7%) | 9 (12.7%) |
| 8 or more Rooms | 0 (0.0%) | 8 (11.3%) |
| Total | 70 (100.0%) | 71 (100.0%) |
Housing Structure by Heating Type in Hancocks Bridge
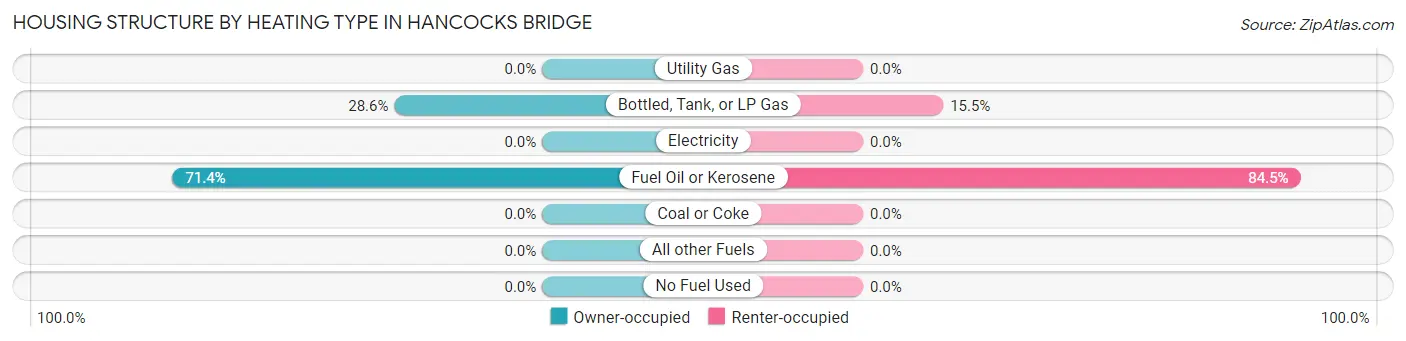
| Heating Type | Owner-occupied | Renter-occupied |
| Utility Gas | 0 (0.0%) | 0 (0.0%) |
| Bottled, Tank, or LP Gas | 20 (28.6%) | 11 (15.5%) |
| Electricity | 0 (0.0%) | 0 (0.0%) |
| Fuel Oil or Kerosene | 50 (71.4%) | 60 (84.5%) |
| Coal or Coke | 0 (0.0%) | 0 (0.0%) |
| All other Fuels | 0 (0.0%) | 0 (0.0%) |
| No Fuel Used | 0 (0.0%) | 0 (0.0%) |
| Total | 70 (100.0%) | 71 (100.0%) |
Household Vehicle Usage in Hancocks Bridge
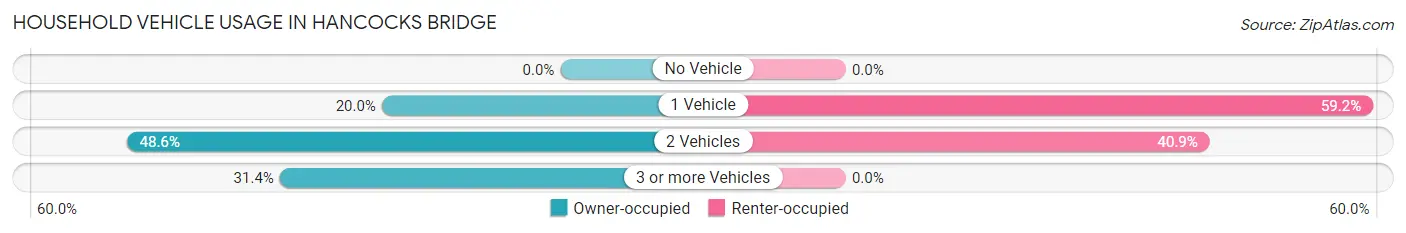
| Vehicles per Household | Owner-occupied | Renter-occupied |
| No Vehicle | 0 (0.0%) | 0 (0.0%) |
| 1 Vehicle | 14 (20.0%) | 42 (59.2%) |
| 2 Vehicles | 34 (48.6%) | 29 (40.8%) |
| 3 or more Vehicles | 22 (31.4%) | 0 (0.0%) |
| Total | 70 (100.0%) | 71 (100.0%) |
Real Estate & Mortgages in Hancocks Bridge
Real Estate and Mortgage Overview in Hancocks Bridge
| Characteristic | Without Mortgage | With Mortgage |
| Housing Units | 44 | 26 |
| Median Property Value | - | - |
| Median Household Income | $100,313 | $10 |
| Monthly Housing Costs | $581 | $0 |
| Real Estate Taxes | $2,313 | $0 |
Property Value by Mortgage Status in Hancocks Bridge
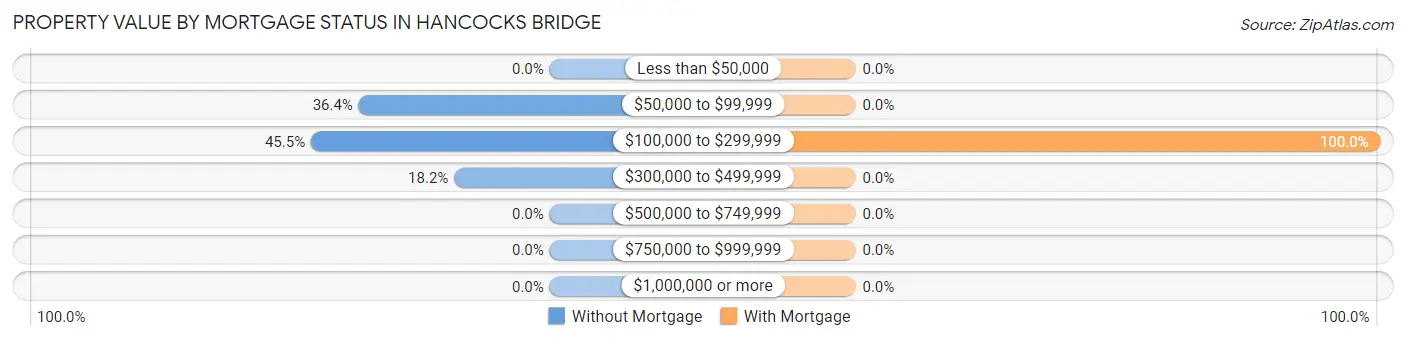
| Property Value | Without Mortgage | With Mortgage |
| Less than $50,000 | 0 (0.0%) | 0 (0.0%) |
| $50,000 to $99,999 | 16 (36.4%) | 0 (0.0%) |
| $100,000 to $299,999 | 20 (45.5%) | 26 (100.0%) |
| $300,000 to $499,999 | 8 (18.2%) | 0 (0.0%) |
| $500,000 to $749,999 | 0 (0.0%) | 0 (0.0%) |
| $750,000 to $999,999 | 0 (0.0%) | 0 (0.0%) |
| $1,000,000 or more | 0 (0.0%) | 0 (0.0%) |
| Total | 44 (100.0%) | 26 (100.0%) |
Household Income by Mortgage Status in Hancocks Bridge
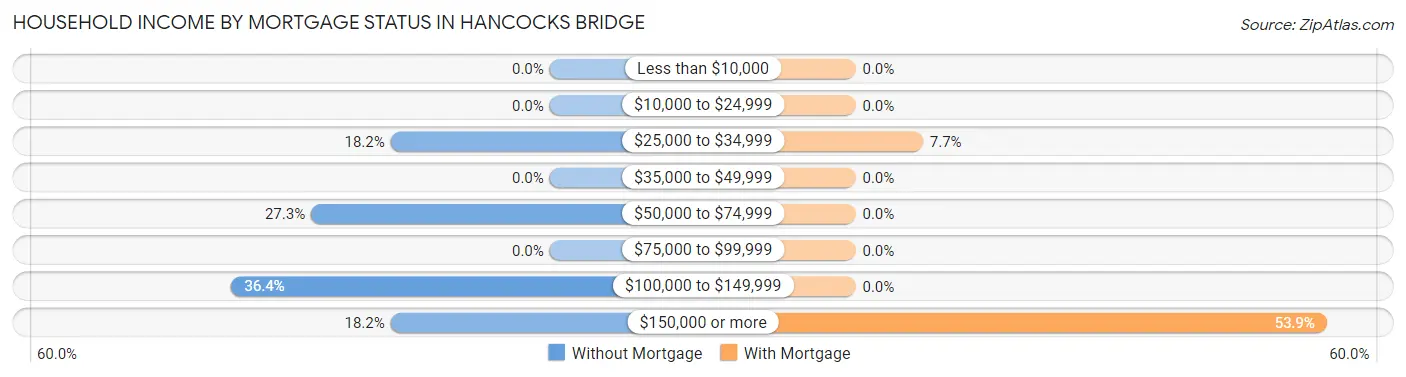
| Household Income | Without Mortgage | With Mortgage |
| Less than $10,000 | 0 (0.0%) | 0 (0.0%) |
| $10,000 to $24,999 | 0 (0.0%) | 0 (0.0%) |
| $25,000 to $34,999 | 8 (18.2%) | 2 (7.7%) |
| $35,000 to $49,999 | 0 (0.0%) | 0 (0.0%) |
| $50,000 to $74,999 | 12 (27.3%) | 0 (0.0%) |
| $75,000 to $99,999 | 0 (0.0%) | 0 (0.0%) |
| $100,000 to $149,999 | 16 (36.4%) | 0 (0.0%) |
| $150,000 or more | 8 (18.2%) | 14 (53.8%) |
| Total | 44 (100.0%) | 26 (100.0%) |
Property Value to Household Income Ratio in Hancocks Bridge
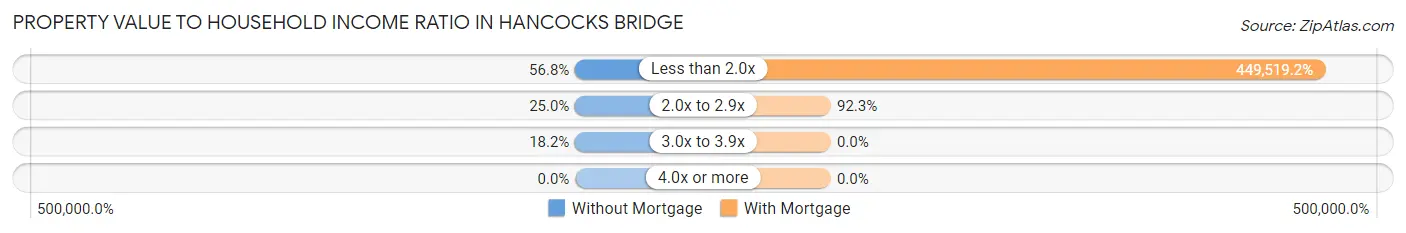
| Value-to-Income Ratio | Without Mortgage | With Mortgage |
| Less than 2.0x | 25 (56.8%) | 116,875 (449,519.2%) |
| 2.0x to 2.9x | 11 (25.0%) | 24 (92.3%) |
| 3.0x to 3.9x | 8 (18.2%) | 0 (0.0%) |
| 4.0x or more | 0 (0.0%) | 0 (0.0%) |
| Total | 44 (100.0%) | 26 (100.0%) |
Real Estate Taxes by Mortgage Status in Hancocks Bridge
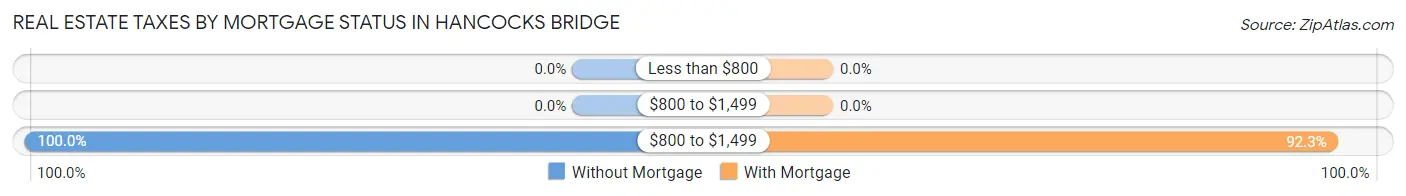
| Property Taxes | Without Mortgage | With Mortgage |
| Less than $800 | 0 (0.0%) | 0 (0.0%) |
| $800 to $1,499 | 0 (0.0%) | 0 (0.0%) |
| $800 to $1,499 | 44 (100.0%) | 24 (92.3%) |
| Total | 44 (100.0%) | 26 (100.0%) |
Health & Disability in Hancocks Bridge
Health Insurance Coverage by Age in Hancocks Bridge
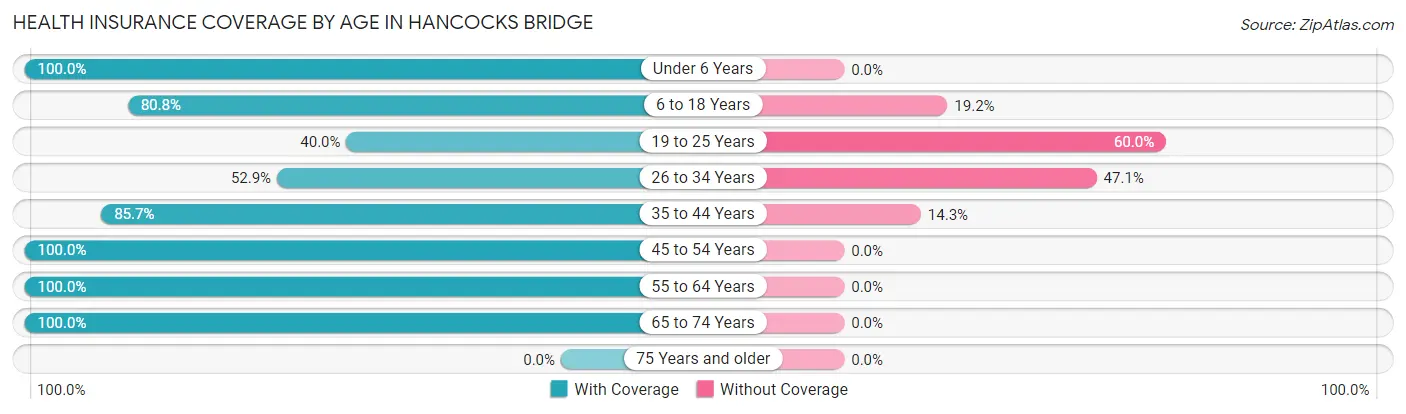
| Age Bracket | With Coverage | Without Coverage |
| Under 6 Years | 22 (100.0%) | 0 (0.0%) |
| 6 to 18 Years | 42 (80.8%) | 10 (19.2%) |
| 19 to 25 Years | 20 (40.0%) | 30 (60.0%) |
| 26 to 34 Years | 9 (52.9%) | 8 (47.1%) |
| 35 to 44 Years | 84 (85.7%) | 14 (14.3%) |
| 45 to 54 Years | 21 (100.0%) | 0 (0.0%) |
| 55 to 64 Years | 79 (100.0%) | 0 (0.0%) |
| 65 to 74 Years | 9 (100.0%) | 0 (0.0%) |
| 75 Years and older | 0 (0.0%) | 0 (0.0%) |
| Total | 286 (82.2%) | 62 (17.8%) |
Health Insurance Coverage by Citizenship Status in Hancocks Bridge
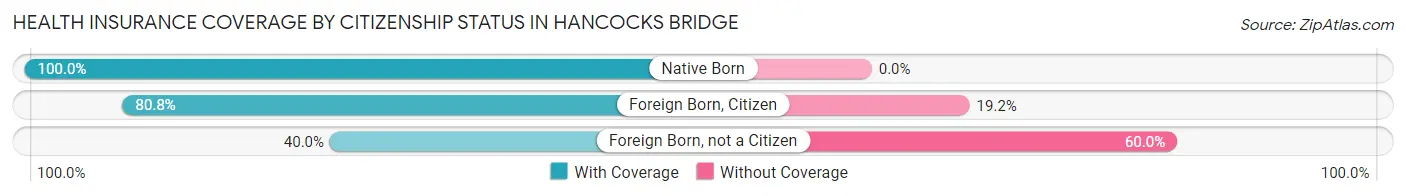
| Citizenship Status | With Coverage | Without Coverage |
| Native Born | 22 (100.0%) | 0 (0.0%) |
| Foreign Born, Citizen | 42 (80.8%) | 10 (19.2%) |
| Foreign Born, not a Citizen | 20 (40.0%) | 30 (60.0%) |
Health Insurance Coverage by Household Income in Hancocks Bridge
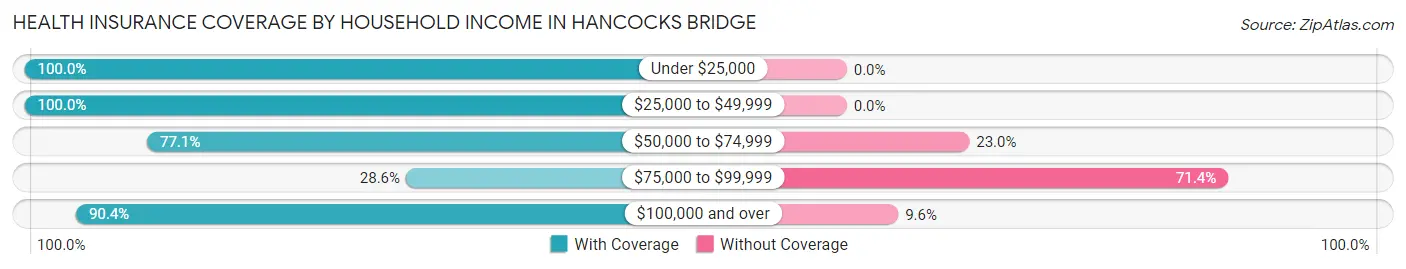
| Household Income | With Coverage | Without Coverage |
| Under $25,000 | 11 (100.0%) | 0 (0.0%) |
| $25,000 to $49,999 | 47 (100.0%) | 0 (0.0%) |
| $50,000 to $74,999 | 47 (77.0%) | 14 (23.0%) |
| $75,000 to $99,999 | 12 (28.6%) | 30 (71.4%) |
| $100,000 and over | 169 (90.4%) | 18 (9.6%) |
Public vs Private Health Insurance Coverage by Age in Hancocks Bridge
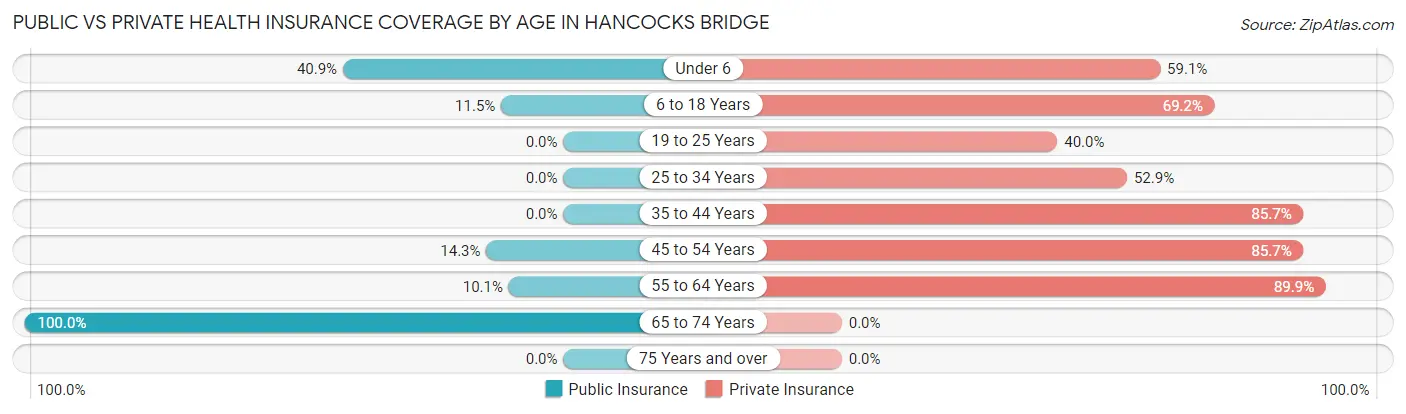
| Age Bracket | Public Insurance | Private Insurance |
| Under 6 | 9 (40.9%) | 13 (59.1%) |
| 6 to 18 Years | 6 (11.5%) | 36 (69.2%) |
| 19 to 25 Years | 0 (0.0%) | 20 (40.0%) |
| 25 to 34 Years | 0 (0.0%) | 9 (52.9%) |
| 35 to 44 Years | 0 (0.0%) | 84 (85.7%) |
| 45 to 54 Years | 3 (14.3%) | 18 (85.7%) |
| 55 to 64 Years | 8 (10.1%) | 71 (89.9%) |
| 65 to 74 Years | 9 (100.0%) | 0 (0.0%) |
| 75 Years and over | 0 (0.0%) | 0 (0.0%) |
| Total | 35 (10.1%) | 251 (72.1%) |
Disability Status by Sex by Age in Hancocks Bridge
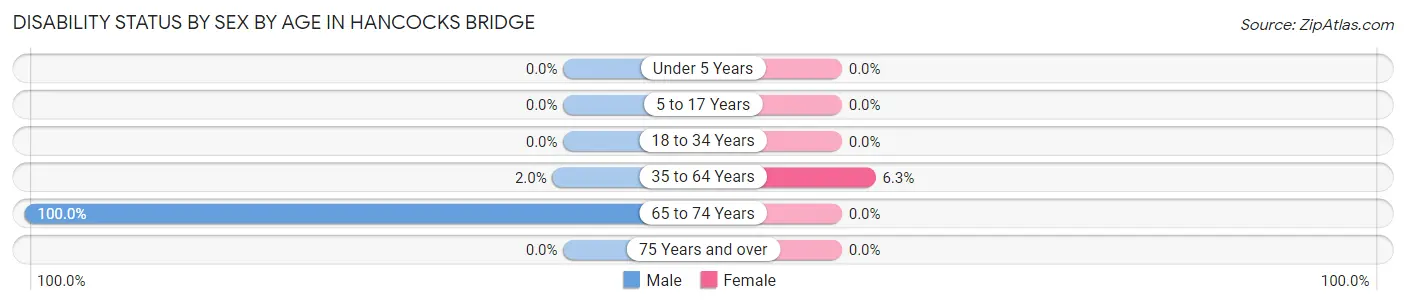
| Age Bracket | Male | Female |
| Under 5 Years | 0 (0.0%) | 0 (0.0%) |
| 5 to 17 Years | 0 (0.0%) | 0 (0.0%) |
| 18 to 34 Years | 0 (0.0%) | 0 (0.0%) |
| 35 to 64 Years | 3 (2.0%) | 3 (6.2%) |
| 65 to 74 Years | 9 (100.0%) | 0 (0.0%) |
| 75 Years and over | 0 (0.0%) | 0 (0.0%) |
Disability Class by Sex by Age in Hancocks Bridge
Disability Class: Hearing Difficulty
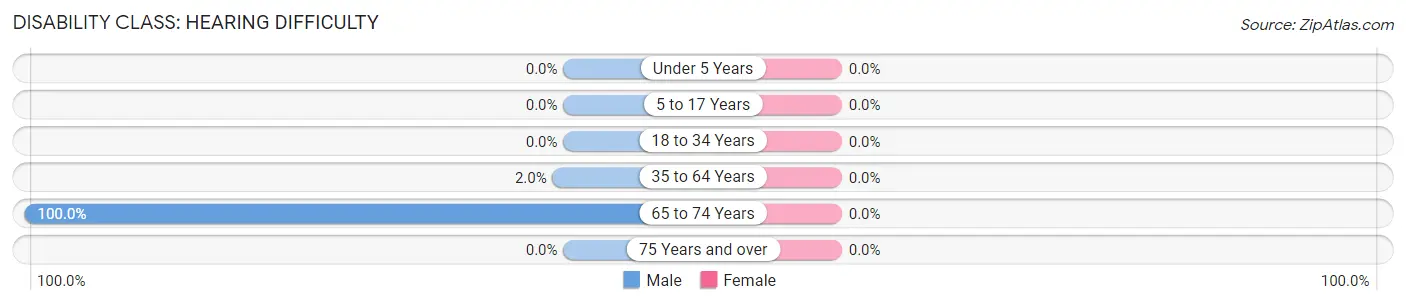
| Age Bracket | Male | Female |
| Under 5 Years | 0 (0.0%) | 0 (0.0%) |
| 5 to 17 Years | 0 (0.0%) | 0 (0.0%) |
| 18 to 34 Years | 0 (0.0%) | 0 (0.0%) |
| 35 to 64 Years | 3 (2.0%) | 0 (0.0%) |
| 65 to 74 Years | 9 (100.0%) | 0 (0.0%) |
| 75 Years and over | 0 (0.0%) | 0 (0.0%) |
Disability Class: Vision Difficulty
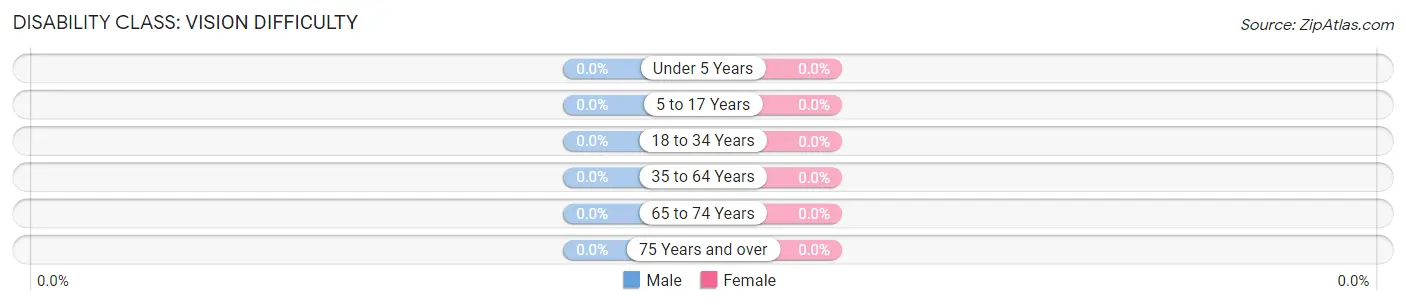
| Age Bracket | Male | Female |
| Under 5 Years | 0 (0.0%) | 0 (0.0%) |
| 5 to 17 Years | 0 (0.0%) | 0 (0.0%) |
| 18 to 34 Years | 0 (0.0%) | 0 (0.0%) |
| 35 to 64 Years | 0 (0.0%) | 0 (0.0%) |
| 65 to 74 Years | 0 (0.0%) | 0 (0.0%) |
| 75 Years and over | 0 (0.0%) | 0 (0.0%) |
Disability Class: Cognitive Difficulty

| Age Bracket | Male | Female |
| 5 to 17 Years | 0 (0.0%) | 0 (0.0%) |
| 18 to 34 Years | 0 (0.0%) | 0 (0.0%) |
| 35 to 64 Years | 0 (0.0%) | 3 (6.2%) |
| 65 to 74 Years | 0 (0.0%) | 0 (0.0%) |
| 75 Years and over | 0 (0.0%) | 0 (0.0%) |
Disability Class: Ambulatory Difficulty
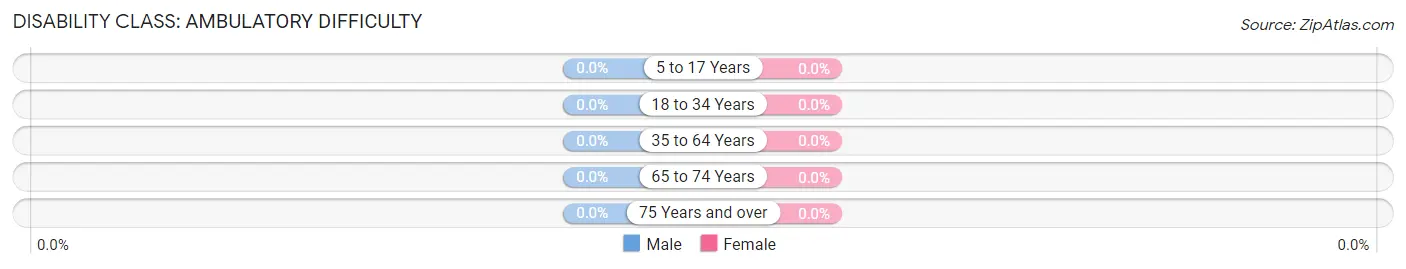
| Age Bracket | Male | Female |
| 5 to 17 Years | 0 (0.0%) | 0 (0.0%) |
| 18 to 34 Years | 0 (0.0%) | 0 (0.0%) |
| 35 to 64 Years | 0 (0.0%) | 0 (0.0%) |
| 65 to 74 Years | 0 (0.0%) | 0 (0.0%) |
| 75 Years and over | 0 (0.0%) | 0 (0.0%) |
Disability Class: Self-Care Difficulty
| Age Bracket | Male | Female |
| 5 to 17 Years | 0 (0.0%) | 0 (0.0%) |
| 18 to 34 Years | 0 (0.0%) | 0 (0.0%) |
| 35 to 64 Years | 0 (0.0%) | 0 (0.0%) |
| 65 to 74 Years | 0 (0.0%) | 0 (0.0%) |
| 75 Years and over | 0 (0.0%) | 0 (0.0%) |
Technology Access in Hancocks Bridge
Computing Device Access in Hancocks Bridge
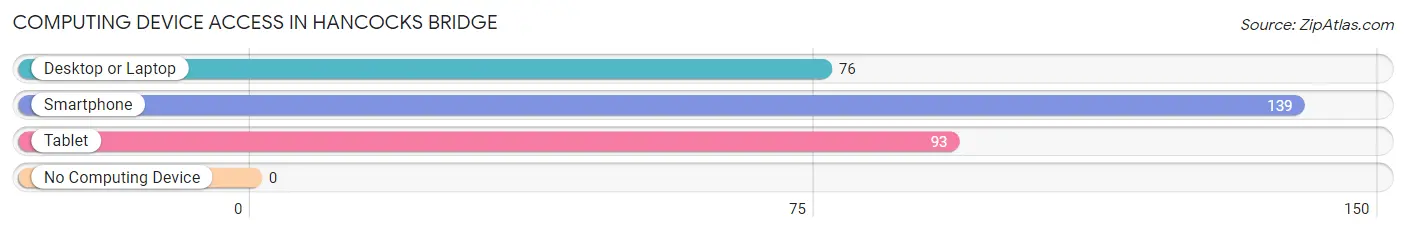
| Device Type | # Households | % Households |
| Desktop or Laptop | 76 | 53.9% |
| Smartphone | 139 | 98.6% |
| Tablet | 93 | 66.0% |
| No Computing Device | 0 | 0.0% |
| Total | 141 | 100.0% |
Internet Access in Hancocks Bridge
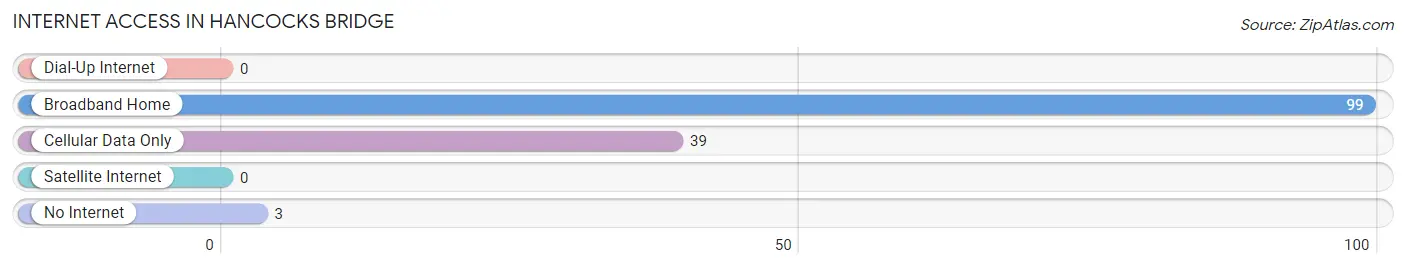
| Internet Type | # Households | % Households |
| Dial-Up Internet | 0 | 0.0% |
| Broadband Home | 99 | 70.2% |
| Cellular Data Only | 39 | 27.7% |
| Satellite Internet | 0 | 0.0% |
| No Internet | 3 | 2.1% |
| Total | 141 | 100.0% |
Hancocks Bridge Summary
Hancocks Bridge is a small unincorporated community located in Salem County, New Jersey. It is situated on the banks of the Salem River, near the Delaware Bay. The community is named after the bridge that crosses the river, which was built in 1794 by Joseph Hancock.
Geography
Hancocks Bridge is located at 39°33'25"N 75°20'45"W (39.5569, -75.3458). It is situated on the banks of the Salem River, near the Delaware Bay. The community is located in the Upper Penns Neck Township of Salem County, New Jersey. The area is mostly rural, with a few small businesses and farms.
Demographics
As of the 2010 census, the population of Hancocks Bridge was 1,072. The racial makeup of the community was 94.3% White, 2.2% African American, 0.3% Native American, 0.7% Asian, 0.1% Pacific Islander, 1.2% from other races, and 1.3% from two or more races. Hispanic or Latino of any race were 3.2% of the population.
Economy
Hancocks Bridge is a small, rural community with a few small businesses and farms. The main industries in the area are agriculture, fishing, and tourism. The area is home to several small farms, which produce a variety of fruits and vegetables. The area is also known for its oyster beds, which provide a source of income for local fishermen. In addition, the area is a popular destination for tourists, who come to enjoy the scenic views of the Salem River and the Delaware Bay.
History
Hancocks Bridge was first settled in the late 1700s by Joseph Hancock, who built the bridge that crosses the Salem River. The bridge was originally built to provide access to the area for farmers and fishermen. In the early 1800s, the area was home to several small businesses, including a grist mill, a saw mill, and a blacksmith shop.
In the late 1800s, the area began to experience a period of growth. The area was home to several small businesses, including a general store, a post office, and a hotel. The area also became a popular destination for tourists, who came to enjoy the scenic views of the Salem River and the Delaware Bay.
In the early 1900s, the area experienced a period of decline. The area was hit hard by the Great Depression, and many of the businesses in the area closed. In the 1950s, the area began to experience a period of revitalization. The area was home to several small businesses, including a grocery store, a hardware store, and a gas station.
Today, Hancocks Bridge is a small, rural community with a few small businesses and farms. The area is a popular destination for tourists, who come to enjoy the scenic views of the Salem River and the Delaware Bay. The area is also home to several small farms, which produce a variety of fruits and vegetables. The area is also known for its oyster beds, which provide a source of income for local fishermen.
Common Questions
What is Per Capita Income in Hancocks Bridge?
Per Capita income in Hancocks Bridge is $39,591.
What is the Median Family Income in Hancocks Bridge?
Median Family Income in Hancocks Bridge is $100,938.
What is the Median Household income in Hancocks Bridge?
Median Household Income in Hancocks Bridge is $72,917.
What is Income or Wage Gap in Hancocks Bridge?
Income or Wage Gap in Hancocks Bridge is 43.9%.
Women in Hancocks Bridge earn 56.1 cents for every dollar earned by a man.
What is Inequality or Gini Index in Hancocks Bridge?
Inequality or Gini Index in Hancocks Bridge is 0.35.
What is the Total Population of Hancocks Bridge?
Total Population of Hancocks Bridge is 348.
What is the Total Male Population of Hancocks Bridge?
Total Male Population of Hancocks Bridge is 225.
What is the Total Female Population of Hancocks Bridge?
Total Female Population of Hancocks Bridge is 123.
What is the Ratio of Males per 100 Females in Hancocks Bridge?
There are 182.93 Males per 100 Females in Hancocks Bridge.
What is the Ratio of Females per 100 Males in Hancocks Bridge?
There are 54.67 Females per 100 Males in Hancocks Bridge.
What is the Median Population Age in Hancocks Bridge?
Median Population Age in Hancocks Bridge is 37.6 Years.
What is the Average Family Size in Hancocks Bridge
Average Family Size in Hancocks Bridge is 3.1 People.
What is the Average Household Size in Hancocks Bridge
Average Household Size in Hancocks Bridge is 2.5 People.
How Large is the Labor Force in Hancocks Bridge?
There are 243 People in the Labor Forcein in Hancocks Bridge.
What is the Percentage of People in the Labor Force in Hancocks Bridge?
85.3% of People are in the Labor Force in Hancocks Bridge.
What is the Unemployment Rate in Hancocks Bridge?
Unemployment Rate in Hancocks Bridge is 5.8%.