Glendora, NJ Map & Demographics
Glendora Map
Glendora Overview
$35,584
PER CAPITA INCOME
$103,716
AVG FAMILY INCOME
$83,689
AVG HOUSEHOLD INCOME
38.4%
WAGE / INCOME GAP [ % ]
61.6¢/ $1
WAGE / INCOME GAP [ $ ]
0.41
INEQUALITY / GINI INDEX
5,817
TOTAL POPULATION
2,748
MALE POPULATION
3,069
FEMALE POPULATION
89.54
MALES / 100 FEMALES
111.68
FEMALES / 100 MALES
39.2
MEDIAN AGE
3.3
AVG FAMILY SIZE
2.5
AVG HOUSEHOLD SIZE
3,358
LABOR FORCE [ PEOPLE ]
67.1%
PERCENT IN LABOR FORCE
13.7%
UNEMPLOYMENT RATE
Glendora Zip Codes
Glendora Area Codes
Income in Glendora
Income Overview in Glendora
Per Capita Income in Glendora is $35,584, while median incomes of families and households are $103,716 and $83,689 respectively.
| Characteristic | Number | Measure |
| Per Capita Income | 5,817 | $35,584 |
| Median Family Income | 1,401 | $103,716 |
| Mean Family Income | 1,401 | $112,813 |
| Median Household Income | 2,296 | $83,689 |
| Mean Household Income | 2,296 | $89,023 |
| Income Deficit | 1,401 | $0 |
| Wage / Income Gap (%) | 5,817 | 38.35% |
| Wage / Income Gap ($) | 5,817 | 61.65¢ per $1 |
| Gini / Inequality Index | 5,817 | 0.41 |
Earnings by Sex in Glendora
Average Earnings in Glendora are $44,869, $56,831 for men and $35,034 for women, a difference of 38.4%.
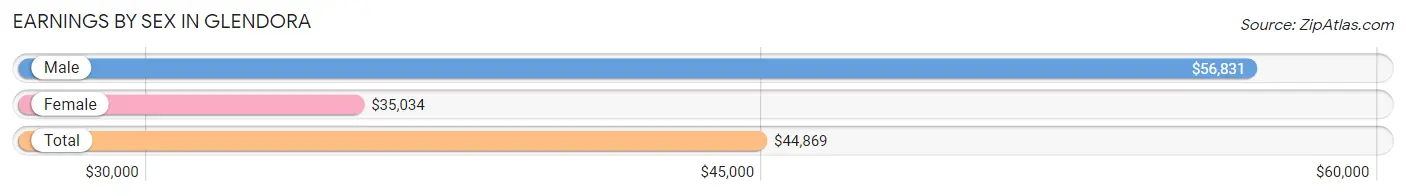
| Sex | Number | Average Earnings |
| Male | 1,685 (50.5%) | $56,831 |
| Female | 1,650 (49.5%) | $35,034 |
| Total | 3,335 (100.0%) | $44,869 |
Earnings by Sex by Income Bracket in Glendora
The most common earnings brackets in Glendora are $100,000+ for men (299 | 17.7%) and $55,000 to $64,999 for women (202 | 12.2%).
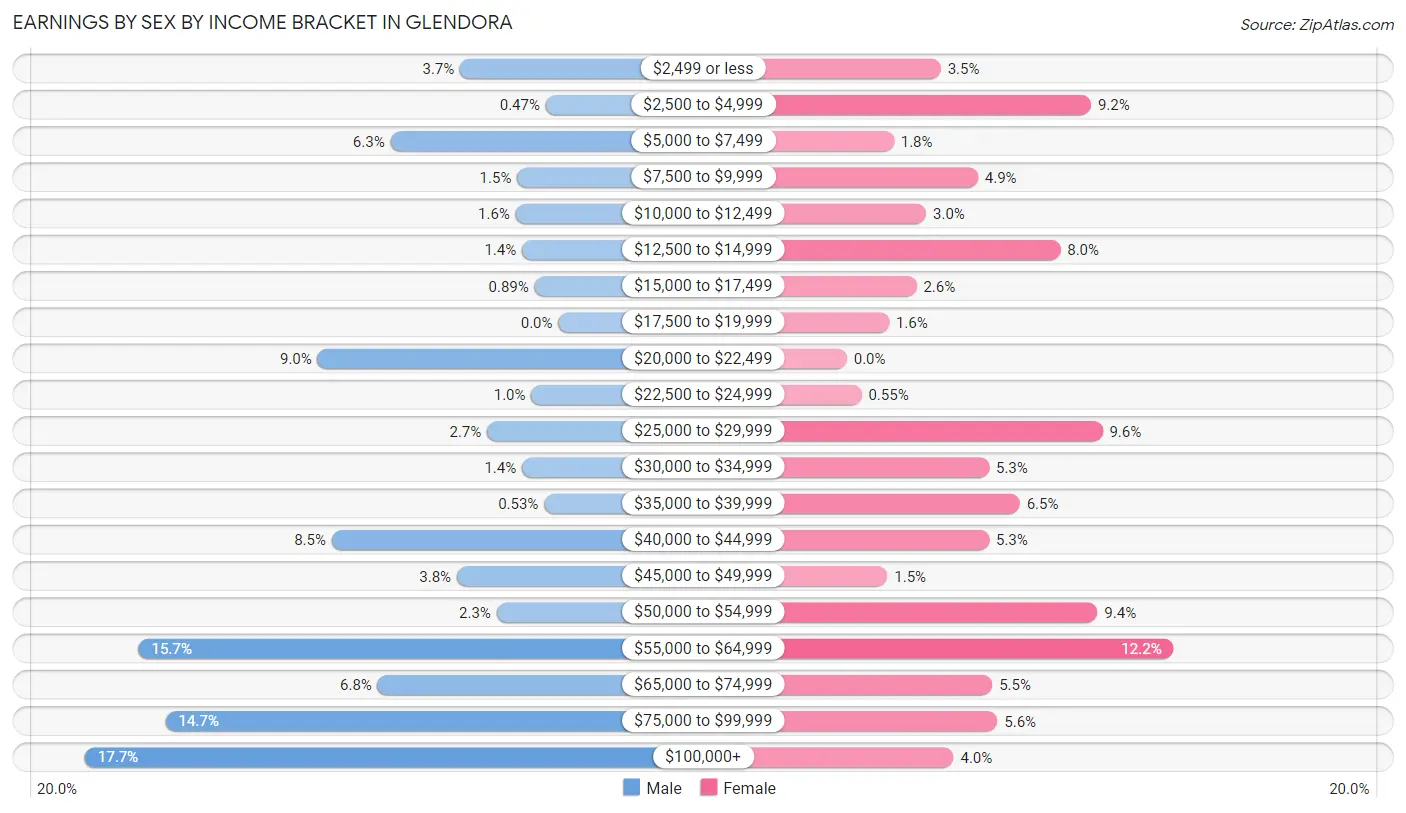
| Income | Male | Female |
| $2,499 or less | 62 (3.7%) | 58 (3.5%) |
| $2,500 to $4,999 | 8 (0.5%) | 151 (9.1%) |
| $5,000 to $7,499 | 106 (6.3%) | 29 (1.8%) |
| $7,500 to $9,999 | 26 (1.5%) | 81 (4.9%) |
| $10,000 to $12,499 | 27 (1.6%) | 49 (3.0%) |
| $12,500 to $14,999 | 23 (1.4%) | 132 (8.0%) |
| $15,000 to $17,499 | 15 (0.9%) | 43 (2.6%) |
| $17,500 to $19,999 | 0 (0.0%) | 26 (1.6%) |
| $20,000 to $22,499 | 152 (9.0%) | 0 (0.0%) |
| $22,500 to $24,999 | 17 (1.0%) | 9 (0.5%) |
| $25,000 to $29,999 | 45 (2.7%) | 158 (9.6%) |
| $30,000 to $34,999 | 23 (1.4%) | 88 (5.3%) |
| $35,000 to $39,999 | 9 (0.5%) | 107 (6.5%) |
| $40,000 to $44,999 | 143 (8.5%) | 88 (5.3%) |
| $45,000 to $49,999 | 64 (3.8%) | 25 (1.5%) |
| $50,000 to $54,999 | 39 (2.3%) | 155 (9.4%) |
| $55,000 to $64,999 | 265 (15.7%) | 202 (12.2%) |
| $65,000 to $74,999 | 114 (6.8%) | 90 (5.4%) |
| $75,000 to $99,999 | 248 (14.7%) | 93 (5.6%) |
| $100,000+ | 299 (17.7%) | 66 (4.0%) |
| Total | 1,685 (100.0%) | 1,650 (100.0%) |
Earnings by Sex by Educational Attainment in Glendora
Average earnings in Glendora are $58,908 for men and $40,966 for women, a difference of 30.5%. Men with an educational attainment of college or associate's degree enjoy the highest average annual earnings of $76,076, while those with bachelor's degree education earn the least with $55,945. Women with an educational attainment of graduate degree earn the most with the average annual earnings of $65,987, while those with high school diploma education have the smallest earnings of $26,841.
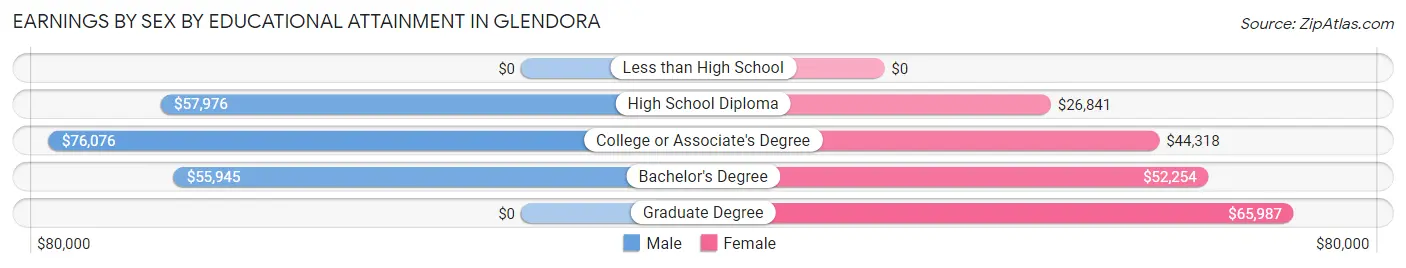
| Educational Attainment | Male Income | Female Income |
| Less than High School | - | - |
| High School Diploma | $57,976 | $26,841 |
| College or Associate's Degree | $76,076 | $44,318 |
| Bachelor's Degree | $55,945 | $52,254 |
| Graduate Degree | - | - |
| Total | $58,908 | $40,966 |
Family Income in Glendora
Family Income Brackets in Glendora
According to the Glendora family income data, there are 427 families falling into the $100,000 to $149,999 income range, which is the most common income bracket and makes up 30.5% of all families.
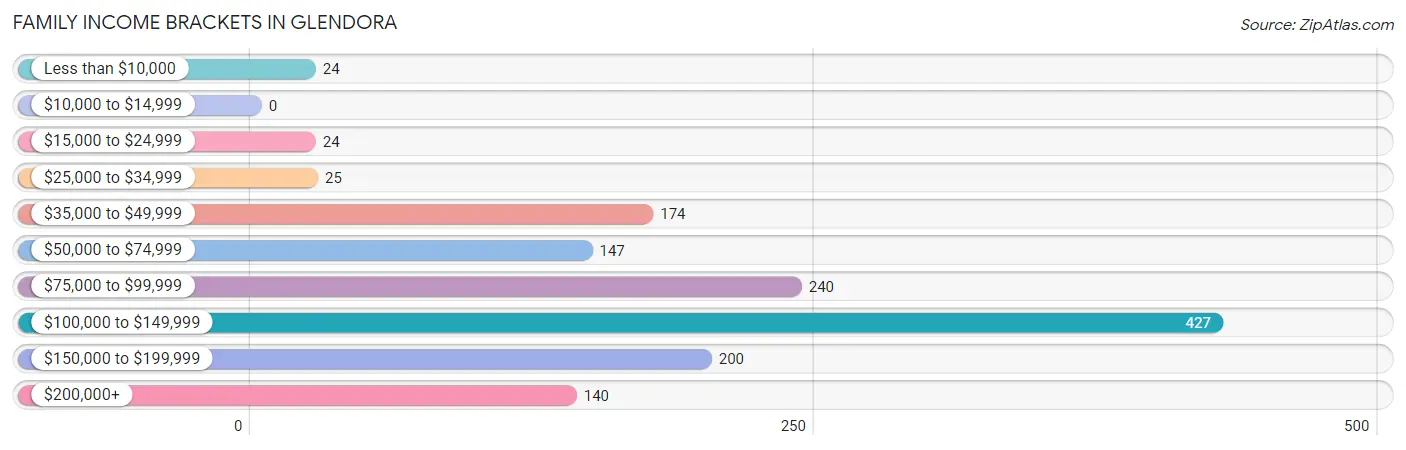
| Income Bracket | # Families | % Families |
| Less than $10,000 | 24 | 1.7% |
| $10,000 to $14,999 | 0 | 0.0% |
| $15,000 to $24,999 | 24 | 1.7% |
| $25,000 to $34,999 | 25 | 1.8% |
| $35,000 to $49,999 | 174 | 12.4% |
| $50,000 to $74,999 | 147 | 10.5% |
| $75,000 to $99,999 | 240 | 17.1% |
| $100,000 to $149,999 | 427 | 30.5% |
| $150,000 to $199,999 | 200 | 14.3% |
| $200,000+ | 140 | 10.0% |
Family Income by Famaliy Size in Glendora
5-person families (92 | 6.6%) account for the highest median family income in Glendora with $242,553 per family, while 2-person families (516 | 36.8%) have the highest median income of $49,614 per family member.
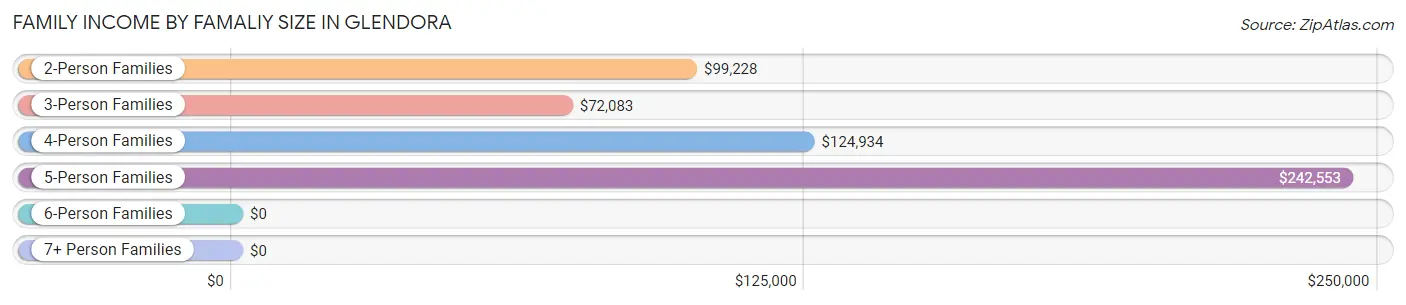
| Income Bracket | # Families | Median Income |
| 2-Person Families | 516 (36.8%) | $99,228 |
| 3-Person Families | 337 (24.0%) | $72,083 |
| 4-Person Families | 373 (26.6%) | $124,934 |
| 5-Person Families | 92 (6.6%) | $242,553 |
| 6-Person Families | 72 (5.1%) | $0 |
| 7+ Person Families | 11 (0.8%) | $0 |
| Total | 1,401 (100.0%) | $103,716 |
Family Income by Number of Earners in Glendora
The median family income in Glendora is $103,716, with families comprising 3+ earners (300) having the highest median family income of $184,306, while families with no earners (76) have the lowest median family income of $49,063, accounting for 21.4% and 5.4% of families, respectively.
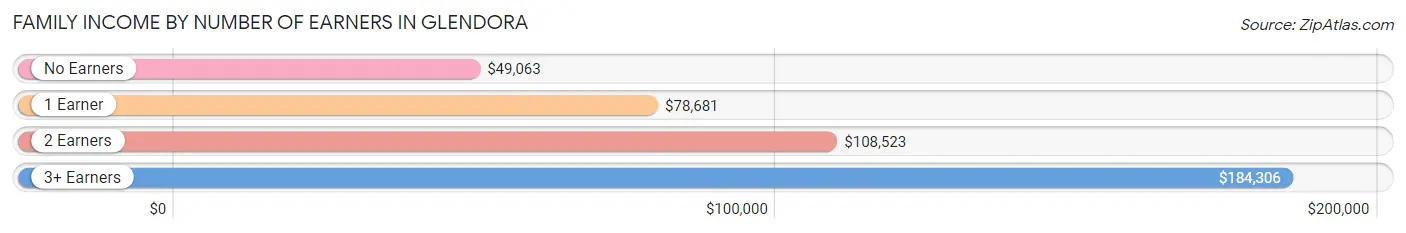
| Number of Earners | # Families | Median Income |
| No Earners | 76 (5.4%) | $49,063 |
| 1 Earner | 498 (35.5%) | $78,681 |
| 2 Earners | 527 (37.6%) | $108,523 |
| 3+ Earners | 300 (21.4%) | $184,306 |
| Total | 1,401 (100.0%) | $103,716 |
Household Income in Glendora
Household Income Brackets in Glendora
With 620 households falling in the category, the $100,000 to $149,999 income range is the most frequent in Glendora, accounting for 27.0% of all households. In contrast, only 108 households (4.7%) fall into the less than $10,000 income bracket, making it the least populous group.
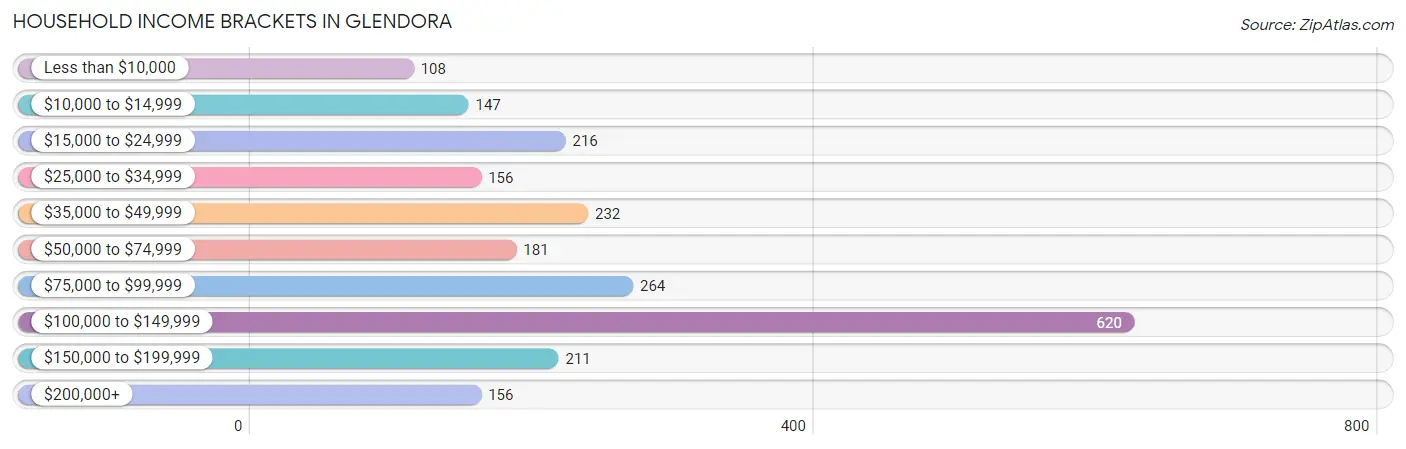
| Income Bracket | # Households | % Households |
| Less than $10,000 | 108 | 4.7% |
| $10,000 to $14,999 | 147 | 6.4% |
| $15,000 to $24,999 | 216 | 9.4% |
| $25,000 to $34,999 | 156 | 6.8% |
| $35,000 to $49,999 | 232 | 10.1% |
| $50,000 to $74,999 | 181 | 7.9% |
| $75,000 to $99,999 | 264 | 11.5% |
| $100,000 to $149,999 | 620 | 27.0% |
| $150,000 to $199,999 | 211 | 9.2% |
| $200,000+ | 156 | 6.8% |
Household Income by Householder Age in Glendora
The median household income in Glendora is $83,689, with the highest median household income of $115,927 found in the 45 to 64 years age bracket for the primary householder. A total of 683 households (29.7%) fall into this category. Meanwhile, the 15 to 24 years age bracket for the primary householder has the lowest median household income of $0, with 16 households (0.7%) in this group.
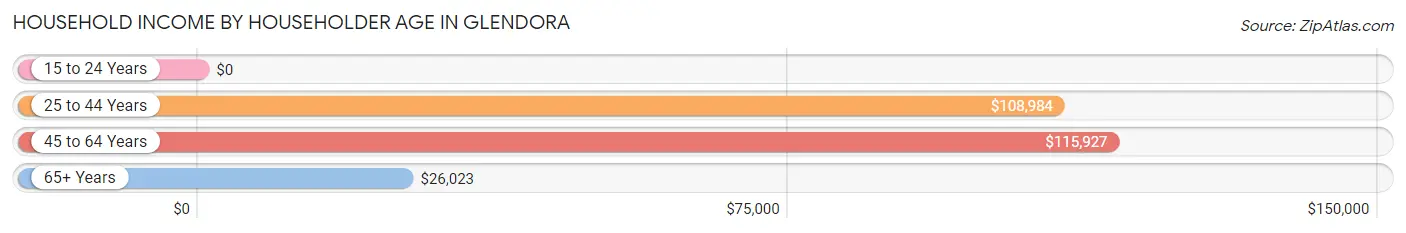
| Income Bracket | # Households | Median Income |
| 15 to 24 Years | 16 (0.7%) | $0 |
| 25 to 44 Years | 781 (34.0%) | $108,984 |
| 45 to 64 Years | 683 (29.7%) | $115,927 |
| 65+ Years | 816 (35.5%) | $26,023 |
| Total | 2,296 (100.0%) | $83,689 |
Poverty in Glendora
Income Below Poverty by Sex and Age in Glendora
With 7.2% poverty level for males and 11.2% for females among the residents of Glendora, 75 year old and over males and 75 year old and over females are the most vulnerable to poverty, with 20 males (15.9%) and 84 females (33.1%) in their respective age groups living below the poverty level.
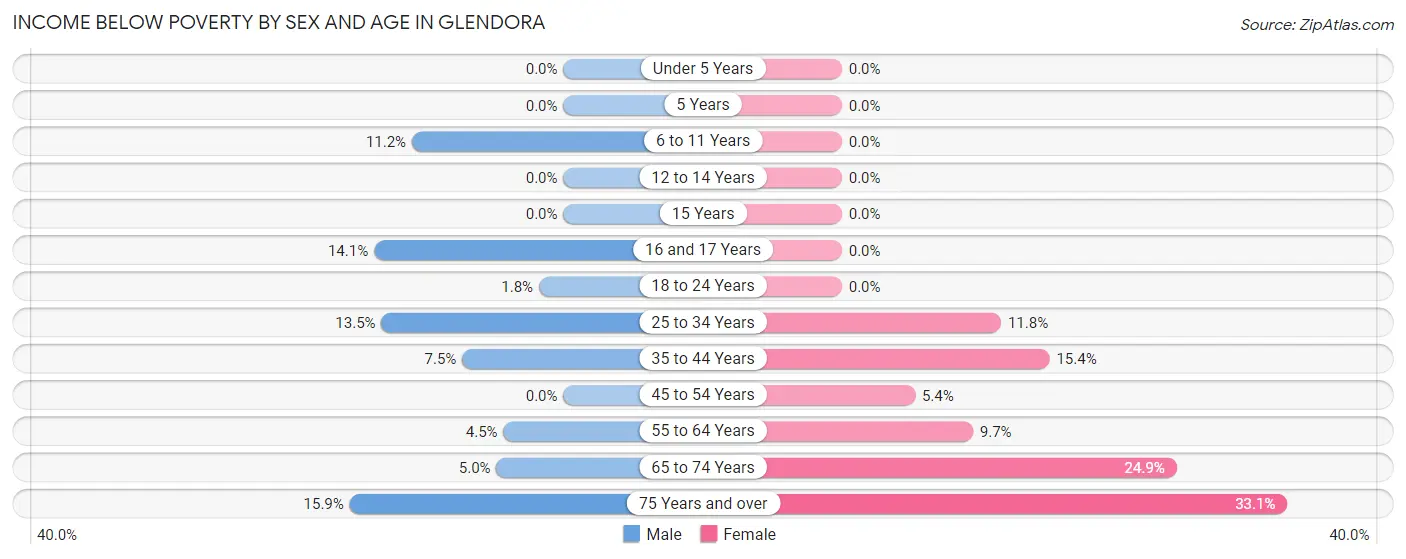
| Age Bracket | Male | Female |
| Under 5 Years | 0 (0.0%) | 0 (0.0%) |
| 5 Years | 0 (0.0%) | 0 (0.0%) |
| 6 to 11 Years | 20 (11.2%) | 0 (0.0%) |
| 12 to 14 Years | 0 (0.0%) | 0 (0.0%) |
| 15 Years | 0 (0.0%) | 0 (0.0%) |
| 16 and 17 Years | 27 (14.1%) | 0 (0.0%) |
| 18 to 24 Years | 4 (1.8%) | 0 (0.0%) |
| 25 to 34 Years | 57 (13.5%) | 35 (11.8%) |
| 35 to 44 Years | 42 (7.5%) | 66 (15.4%) |
| 45 to 54 Years | 0 (0.0%) | 22 (5.4%) |
| 55 to 64 Years | 11 (4.4%) | 46 (9.7%) |
| 65 to 74 Years | 16 (5.0%) | 90 (24.9%) |
| 75 Years and over | 20 (15.9%) | 84 (33.1%) |
| Total | 197 (7.2%) | 343 (11.2%) |
Income Above Poverty by Sex and Age in Glendora
According to the poverty statistics in Glendora, males aged under 5 years and females aged under 5 years are the age groups that are most secure financially, with 100.0% of males and 100.0% of females in these age groups living above the poverty line.
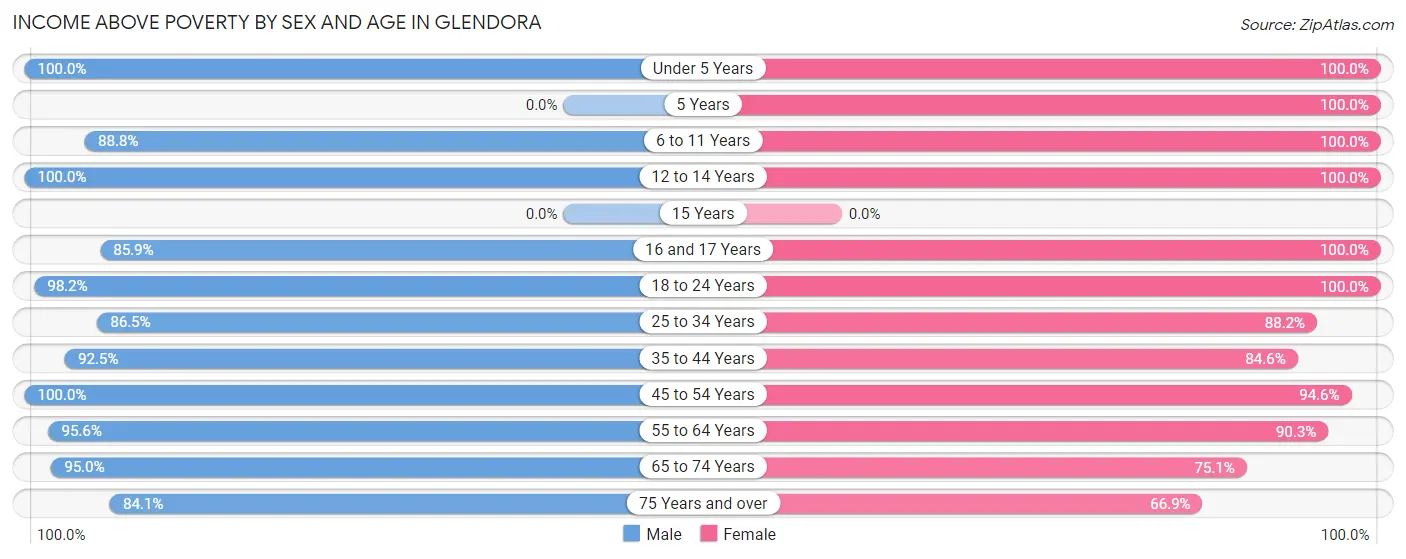
| Age Bracket | Male | Female |
| Under 5 Years | 96 (100.0%) | 94 (100.0%) |
| 5 Years | 0 (0.0%) | 76 (100.0%) |
| 6 to 11 Years | 158 (88.8%) | 251 (100.0%) |
| 12 to 14 Years | 36 (100.0%) | 74 (100.0%) |
| 15 Years | 0 (0.0%) | 0 (0.0%) |
| 16 and 17 Years | 165 (85.9%) | 16 (100.0%) |
| 18 to 24 Years | 217 (98.2%) | 332 (100.0%) |
| 25 to 34 Years | 365 (86.5%) | 261 (88.2%) |
| 35 to 44 Years | 517 (92.5%) | 362 (84.6%) |
| 45 to 54 Years | 349 (100.0%) | 383 (94.6%) |
| 55 to 64 Years | 236 (95.6%) | 427 (90.3%) |
| 65 to 74 Years | 306 (95.0%) | 272 (75.1%) |
| 75 Years and over | 106 (84.1%) | 170 (66.9%) |
| Total | 2,551 (92.8%) | 2,718 (88.8%) |
Income Below Poverty Among Married-Couple Families in Glendora
The poverty statistics for married-couple families in Glendora show that 4.9% or 51 of the total 1,051 families live below the poverty line. Families with 1 or 2 children have the highest poverty rate of 6.7%, comprising of 35 families. On the other hand, families with 3 or 4 children have the lowest poverty rate of 0.0%, which includes 0 families.
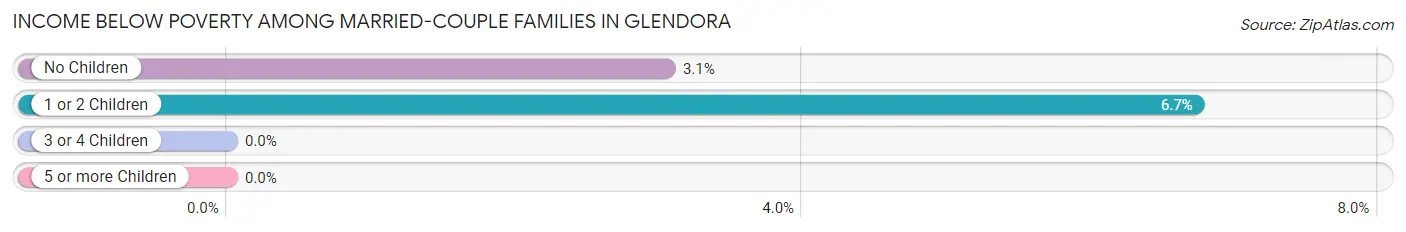
| Children | Above Poverty | Below Poverty |
| No Children | 509 (97.0%) | 16 (3.0%) |
| 1 or 2 Children | 485 (93.3%) | 35 (6.7%) |
| 3 or 4 Children | 6 (100.0%) | 0 (0.0%) |
| 5 or more Children | 0 (0.0%) | 0 (0.0%) |
| Total | 1,000 (95.2%) | 51 (4.9%) |
Income Below Poverty Among Single-Parent Households in Glendora
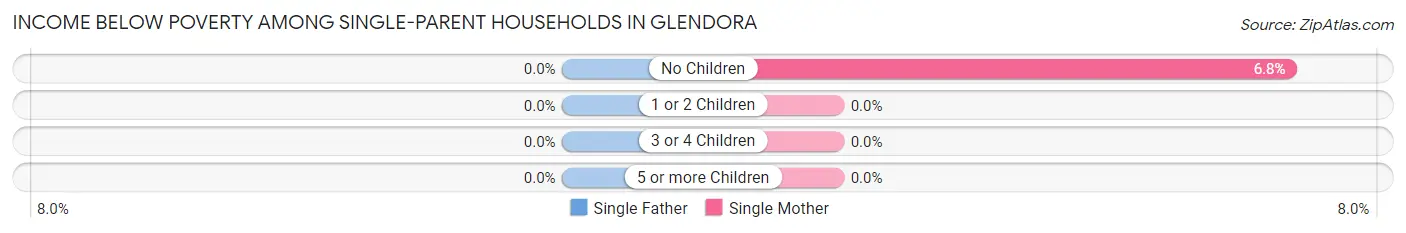
| Children | Single Father | Single Mother |
| No Children | 0 (0.0%) | 10 (6.8%) |
| 1 or 2 Children | 0 (0.0%) | 0 (0.0%) |
| 3 or 4 Children | 0 (0.0%) | 0 (0.0%) |
| 5 or more Children | 0 (0.0%) | 0 (0.0%) |
| Total | 0 (0.0%) | 10 (4.3%) |
Income Below Poverty Among Married-Couple vs Single-Parent Households in Glendora
The poverty data for Glendora shows that 51 of the married-couple family households (4.9%) and 10 of the single-parent households (2.9%) are living below the poverty level. Within the married-couple family households, those with 1 or 2 children have the highest poverty rate, with 35 households (6.7%) falling below the poverty line. Among the single-parent households, those with no children have the highest poverty rate, with 10 household (4.8%) living below poverty.
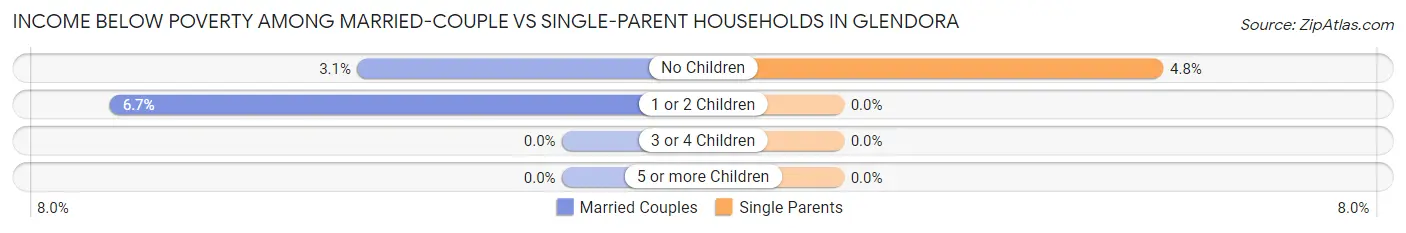
| Children | Married-Couple Families | Single-Parent Households |
| No Children | 16 (3.0%) | 10 (4.8%) |
| 1 or 2 Children | 35 (6.7%) | 0 (0.0%) |
| 3 or 4 Children | 0 (0.0%) | 0 (0.0%) |
| 5 or more Children | 0 (0.0%) | 0 (0.0%) |
| Total | 51 (4.9%) | 10 (2.9%) |
Race in Glendora
The most populous races in Glendora are White / Caucasian (4,868 | 83.7%), Hispanic or Latino (572 | 9.8%), and Black / African American (484 | 8.3%).
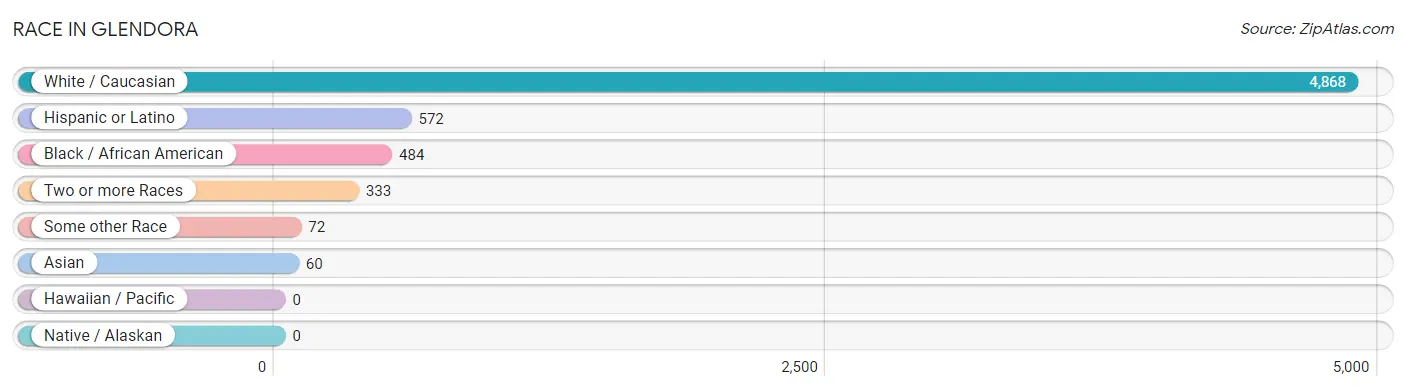
| Race | # Population | % Population |
| Asian | 60 | 1.0% |
| Black / African American | 484 | 8.3% |
| Hawaiian / Pacific | 0 | 0.0% |
| Hispanic or Latino | 572 | 9.8% |
| Native / Alaskan | 0 | 0.0% |
| White / Caucasian | 4,868 | 83.7% |
| Two or more Races | 333 | 5.7% |
| Some other Race | 72 | 1.2% |
| Total | 5,817 | 100.0% |
Ancestry in Glendora
The most populous ancestries reported in Glendora are Irish (1,361 | 23.4%), Italian (1,262 | 21.7%), German (1,004 | 17.3%), English (829 | 14.2%), and Puerto Rican (334 | 5.7%), together accounting for 82.4% of all Glendora residents.
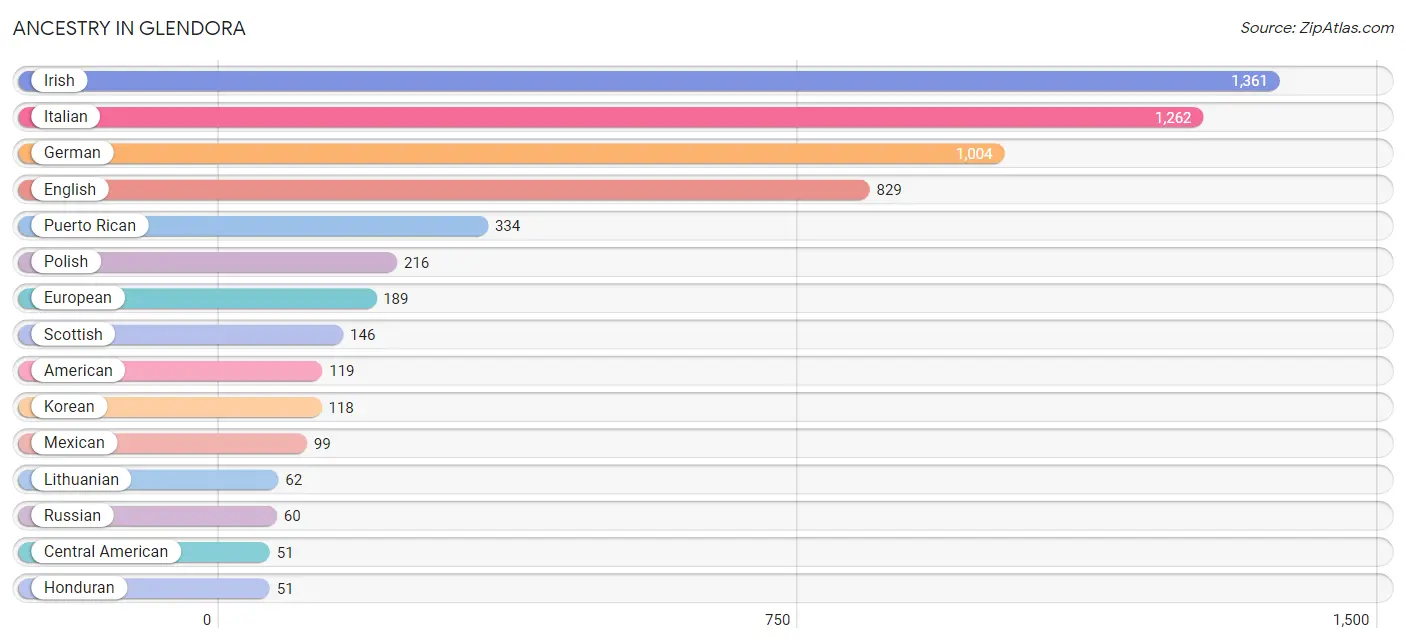
| Ancestry | # Population | % Population |
| American | 119 | 2.1% |
| Austrian | 31 | 0.5% |
| Blackfeet | 32 | 0.5% |
| British | 14 | 0.2% |
| Central American | 51 | 0.9% |
| Cherokee | 24 | 0.4% |
| Choctaw | 9 | 0.2% |
| Cuban | 32 | 0.5% |
| Dominican | 47 | 0.8% |
| Dutch | 35 | 0.6% |
| Ecuadorian | 9 | 0.2% |
| English | 829 | 14.2% |
| European | 189 | 3.3% |
| French | 37 | 0.6% |
| German | 1,004 | 17.3% |
| Greek | 13 | 0.2% |
| Honduran | 51 | 0.9% |
| Hungarian | 20 | 0.3% |
| Irish | 1,361 | 23.4% |
| Italian | 1,262 | 21.7% |
| Jamaican | 8 | 0.1% |
| Korean | 118 | 2.0% |
| Lithuanian | 62 | 1.1% |
| Mexican | 99 | 1.7% |
| Pakistani | 6 | 0.1% |
| Pennsylvania German | 19 | 0.3% |
| Polish | 216 | 3.7% |
| Puerto Rican | 334 | 5.7% |
| Russian | 60 | 1.0% |
| Scotch-Irish | 27 | 0.5% |
| Scottish | 146 | 2.5% |
| Slovak | 10 | 0.2% |
| South American | 9 | 0.2% |
| Swedish | 12 | 0.2% |
| Ukrainian | 47 | 0.8% |
| Welsh | 32 | 0.5% | View All 36 Rows |
Immigrants in Glendora
The most numerous immigrant groups reported in Glendora came from Latin America (115 | 2.0%), Europe (61 | 1.1%), Caribbean (49 | 0.8%), Central America (41 | 0.7%), and England (38 | 0.6%), together accounting for 5.2% of all Glendora residents.
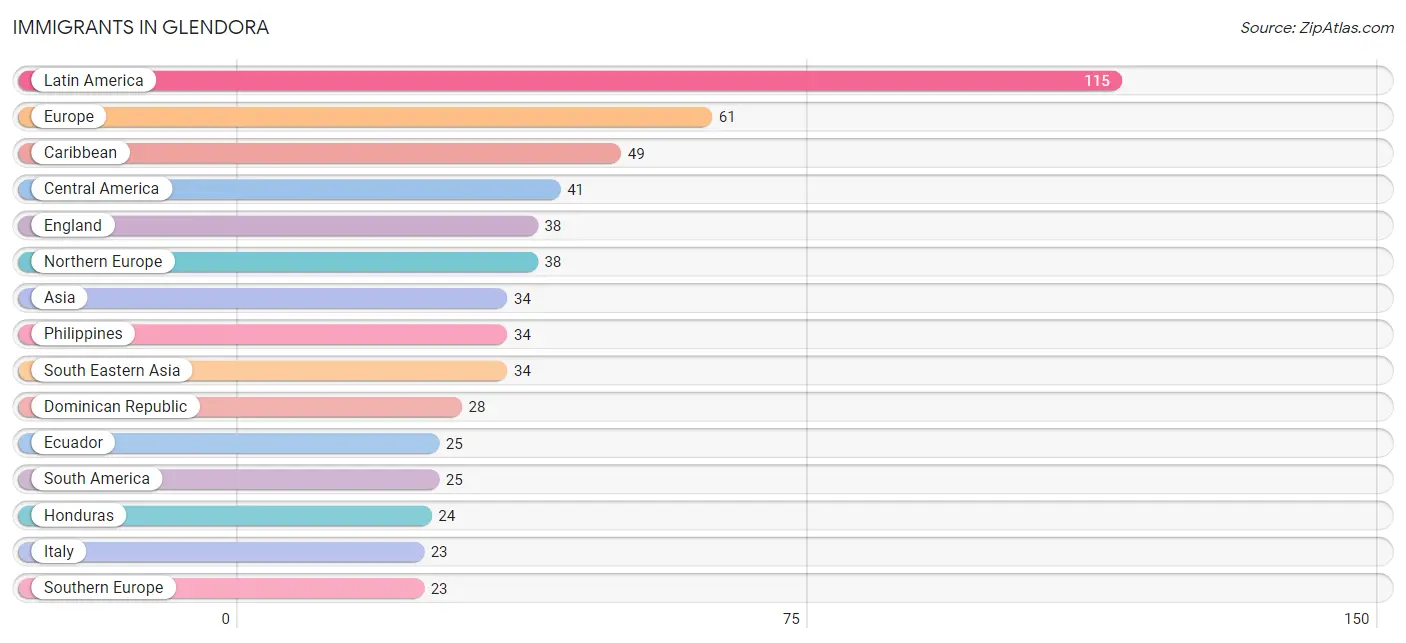
| Immigration Origin | # Population | % Population |
| Asia | 34 | 0.6% |
| Caribbean | 49 | 0.8% |
| Central America | 41 | 0.7% |
| Cuba | 13 | 0.2% |
| Dominican Republic | 28 | 0.5% |
| Ecuador | 25 | 0.4% |
| England | 38 | 0.6% |
| Europe | 61 | 1.1% |
| Honduras | 24 | 0.4% |
| Italy | 23 | 0.4% |
| Jamaica | 8 | 0.1% |
| Latin America | 115 | 2.0% |
| Mexico | 17 | 0.3% |
| Northern Europe | 38 | 0.6% |
| Philippines | 34 | 0.6% |
| South America | 25 | 0.4% |
| South Eastern Asia | 34 | 0.6% |
| Southern Europe | 23 | 0.4% | View All 18 Rows |
Sex and Age in Glendora
Sex and Age in Glendora
The most populous age groups in Glendora are 35 to 39 Years (450 | 16.4%) for men and 35 to 39 Years (328 | 10.7%) for women.
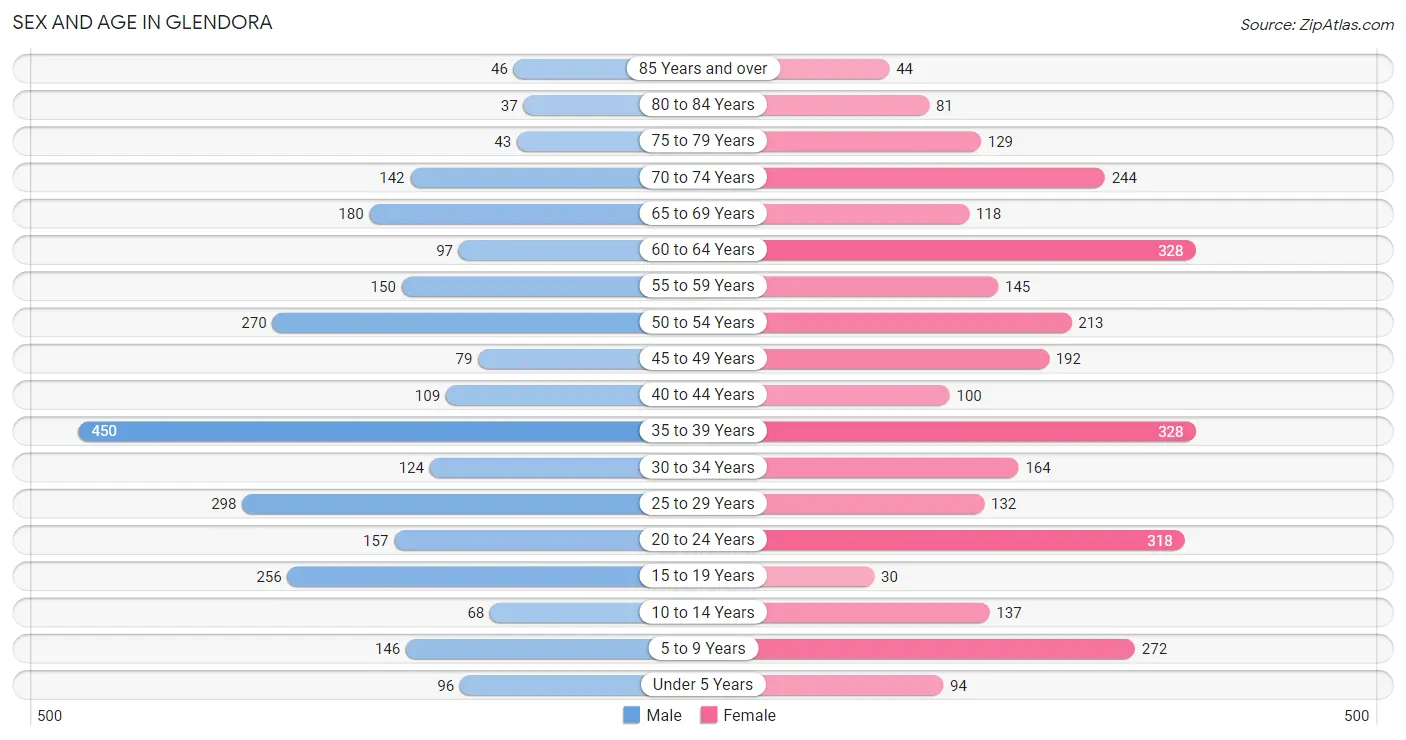
| Age Bracket | Male | Female |
| Under 5 Years | 96 (3.5%) | 94 (3.1%) |
| 5 to 9 Years | 146 (5.3%) | 272 (8.9%) |
| 10 to 14 Years | 68 (2.5%) | 137 (4.5%) |
| 15 to 19 Years | 256 (9.3%) | 30 (1.0%) |
| 20 to 24 Years | 157 (5.7%) | 318 (10.4%) |
| 25 to 29 Years | 298 (10.8%) | 132 (4.3%) |
| 30 to 34 Years | 124 (4.5%) | 164 (5.3%) |
| 35 to 39 Years | 450 (16.4%) | 328 (10.7%) |
| 40 to 44 Years | 109 (4.0%) | 100 (3.3%) |
| 45 to 49 Years | 79 (2.9%) | 192 (6.3%) |
| 50 to 54 Years | 270 (9.8%) | 213 (6.9%) |
| 55 to 59 Years | 150 (5.5%) | 145 (4.7%) |
| 60 to 64 Years | 97 (3.5%) | 328 (10.7%) |
| 65 to 69 Years | 180 (6.6%) | 118 (3.8%) |
| 70 to 74 Years | 142 (5.2%) | 244 (8.0%) |
| 75 to 79 Years | 43 (1.6%) | 129 (4.2%) |
| 80 to 84 Years | 37 (1.3%) | 81 (2.6%) |
| 85 Years and over | 46 (1.7%) | 44 (1.4%) |
| Total | 2,748 (100.0%) | 3,069 (100.0%) |
Families and Households in Glendora
Median Family Size in Glendora
The median family size in Glendora is 3.28 persons per family, with single male/father families (115 | 8.2%) accounting for the largest median family size of 3.81 persons per family. On the other hand, single female/mother families (235 | 16.8%) represent the smallest median family size with 3.22 persons per family.
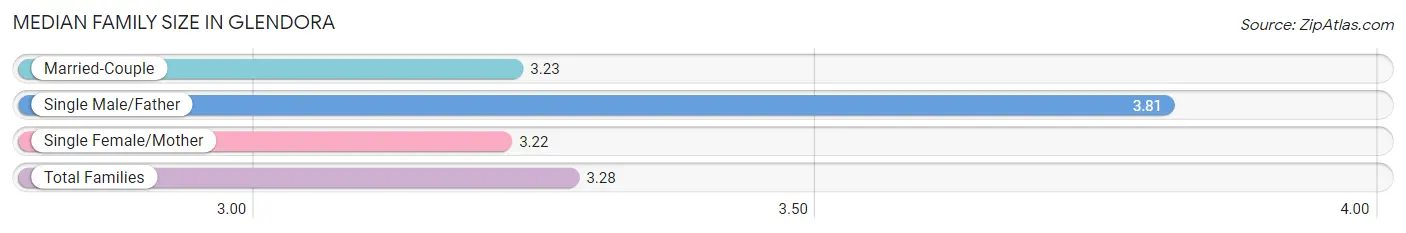
| Family Type | # Families | Family Size |
| Married-Couple | 1,051 (75.0%) | 3.23 |
| Single Male/Father | 115 (8.2%) | 3.81 |
| Single Female/Mother | 235 (16.8%) | 3.22 |
| Total Families | 1,401 (100.0%) | 3.28 |
Median Household Size in Glendora
The median household size in Glendora is 2.53 persons per household, with single male/father households (115 | 5.0%) accounting for the largest median household size of 4.39 persons per household. non-family households (895 | 39.0%) represent the smallest median household size with 1.22 persons per household.
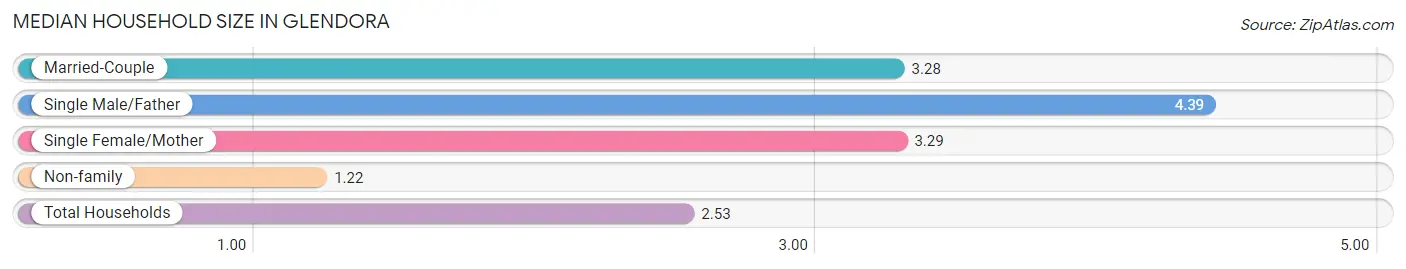
| Household Type | # Households | Household Size |
| Married-Couple | 1,051 (45.8%) | 3.28 |
| Single Male/Father | 115 (5.0%) | 4.39 |
| Single Female/Mother | 235 (10.2%) | 3.29 |
| Non-family | 895 (39.0%) | 1.22 |
| Total Households | 2,296 (100.0%) | 2.53 |
Household Size by Marriage Status in Glendora
Out of a total of 2,296 households in Glendora, 1,401 (61.0%) are family households, while 895 (39.0%) are nonfamily households. The most numerous type of family households are 2-person households, comprising 468, and the most common type of nonfamily households are 1-person households, comprising 716.
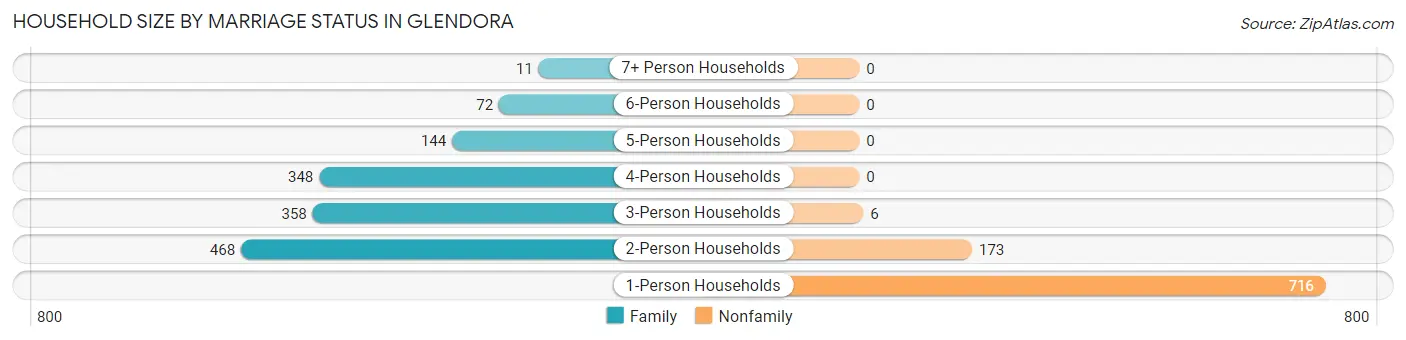
| Household Size | Family Households | Nonfamily Households |
| 1-Person Households | - | 716 (31.2%) |
| 2-Person Households | 468 (20.4%) | 173 (7.5%) |
| 3-Person Households | 358 (15.6%) | 6 (0.3%) |
| 4-Person Households | 348 (15.2%) | 0 (0.0%) |
| 5-Person Households | 144 (6.3%) | 0 (0.0%) |
| 6-Person Households | 72 (3.1%) | 0 (0.0%) |
| 7+ Person Households | 11 (0.5%) | 0 (0.0%) |
| Total | 1,401 (61.0%) | 895 (39.0%) |
Female Fertility in Glendora
Fertility by Age in Glendora
Average fertility rate in Glendora is 31.0 births per 1,000 women. Women in the age bracket of 20 to 34 years have the highest fertility rate with 55.0 births per 1,000 women. Women in the age bracket of 20 to 34 years acount for 82.9% of all women with births.
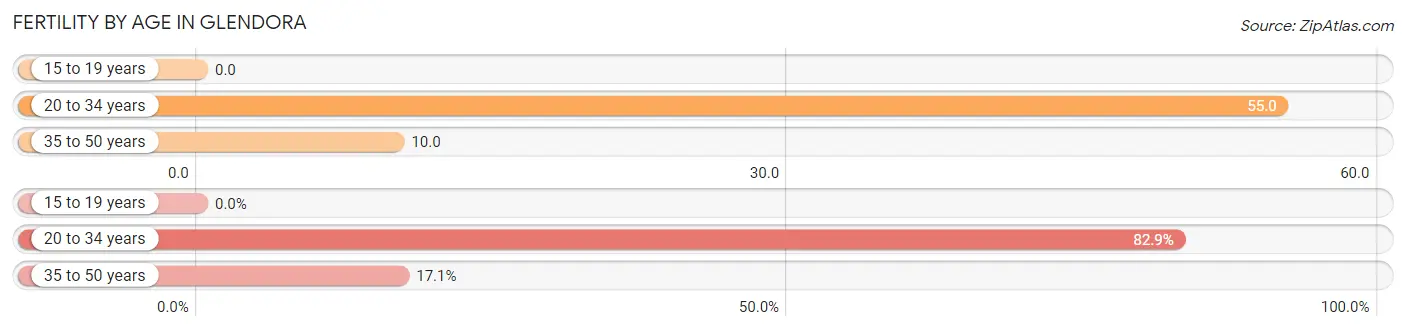
| Age Bracket | Women with Births | Births / 1,000 Women |
| 15 to 19 years | 0 (0.0%) | 0.0 |
| 20 to 34 years | 34 (82.9%) | 55.0 |
| 35 to 50 years | 7 (17.1%) | 10.0 |
| Total | 41 (100.0%) | 31.0 |
Fertility by Age by Marriage Status in Glendora
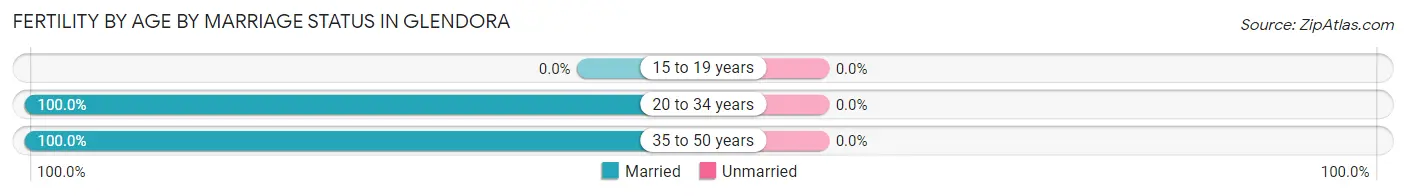
| Age Bracket | Married | Unmarried |
| 15 to 19 years | 0 (0.0%) | 0 (0.0%) |
| 20 to 34 years | 34 (100.0%) | 0 (0.0%) |
| 35 to 50 years | 7 (100.0%) | 0 (0.0%) |
| Total | 41 (100.0%) | 0 (0.0%) |
Fertility by Education in Glendora
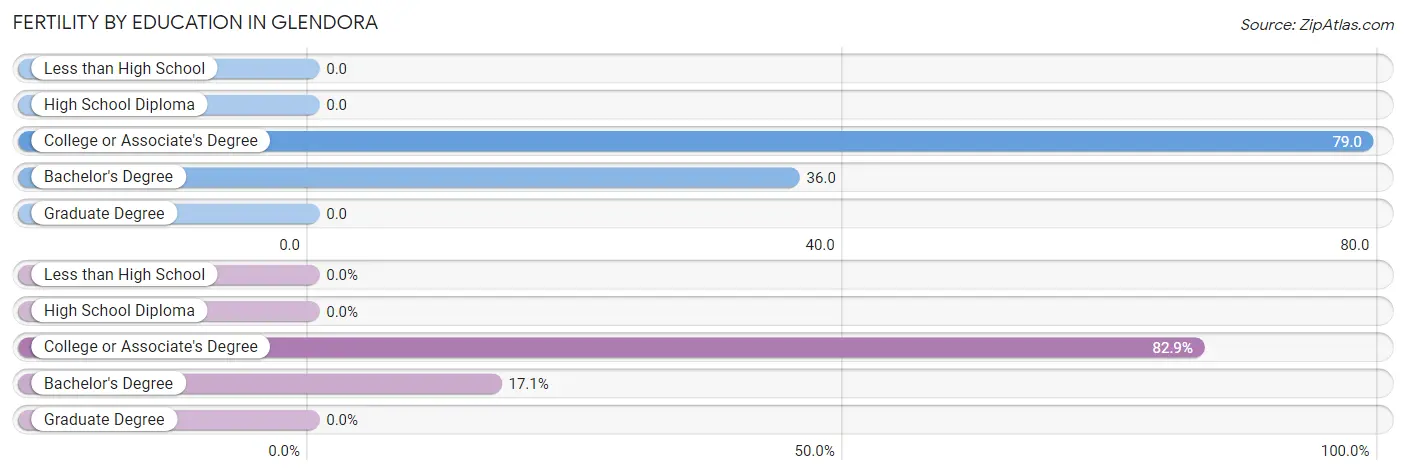
| Educational Attainment | Women with Births | Births / 1,000 Women |
| Less than High School | 0 (0.0%) | 0.0 |
| High School Diploma | 0 (0.0%) | 0.0 |
| College or Associate's Degree | 34 (82.9%) | 79.0 |
| Bachelor's Degree | 7 (17.1%) | 36.0 |
| Graduate Degree | 0 (0.0%) | 0.0 |
| Total | 41 (100.0%) | 31.0 |
Fertility by Education by Marriage Status in Glendora
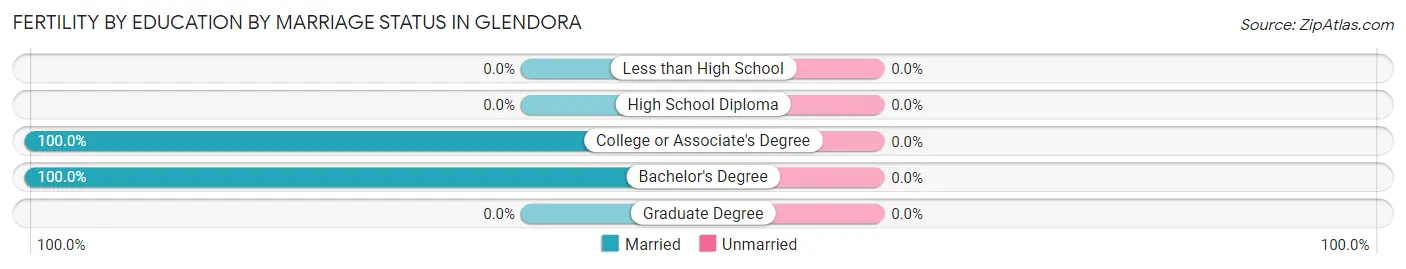
| Educational Attainment | Married | Unmarried |
| Less than High School | 0 (0.0%) | 0 (0.0%) |
| High School Diploma | 0 (0.0%) | 0 (0.0%) |
| College or Associate's Degree | 34 (100.0%) | 0 (0.0%) |
| Bachelor's Degree | 7 (100.0%) | 0 (0.0%) |
| Graduate Degree | 0 (0.0%) | 0 (0.0%) |
| Total | 41 (100.0%) | 0 (0.0%) |
Employment Characteristics in Glendora
Employment by Class of Employer in Glendora
Among the 2,746 employed individuals in Glendora, private company employees (1,963 | 71.5%), local government employees (235 | 8.6%), and state government employees (212 | 7.7%) make up the most common classes of employment.
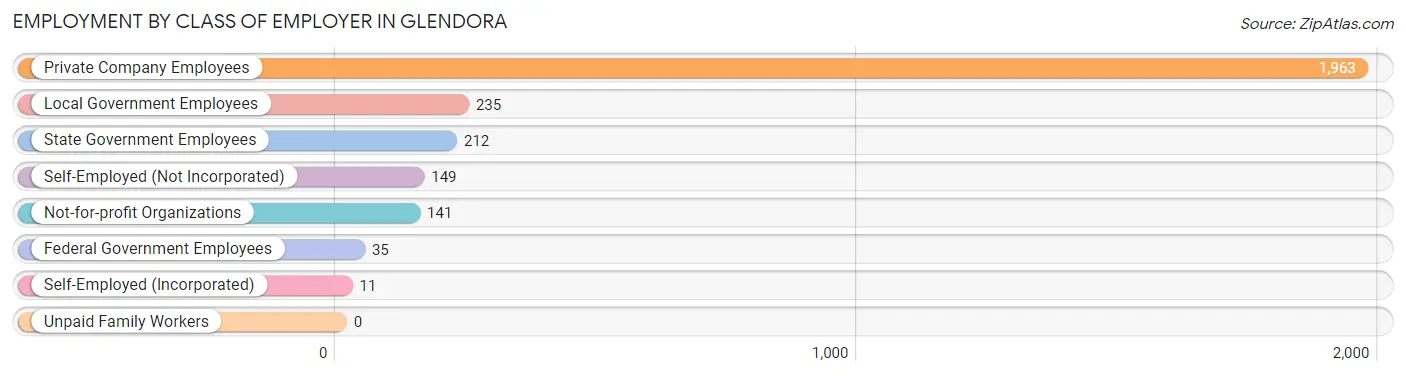
| Employer Class | # Employees | % Employees |
| Private Company Employees | 1,963 | 71.5% |
| Self-Employed (Incorporated) | 11 | 0.4% |
| Self-Employed (Not Incorporated) | 149 | 5.4% |
| Not-for-profit Organizations | 141 | 5.1% |
| Local Government Employees | 235 | 8.6% |
| State Government Employees | 212 | 7.7% |
| Federal Government Employees | 35 | 1.3% |
| Unpaid Family Workers | 0 | 0.0% |
| Total | 2,746 | 100.0% |
Employment Status by Age in Glendora
According to the labor force statistics for Glendora, out of the total population over 16 years of age (5,004), 67.1% or 3,358 individuals are in the labor force, with 13.7% or 460 of them unemployed. The age group with the highest labor force participation rate is 25 to 29 years, with 96.3% or 414 individuals in the labor force. Within the labor force, the 16 to 19 years age range has the highest percentage of unemployed individuals, with 65.2% or 107 of them being unemployed.
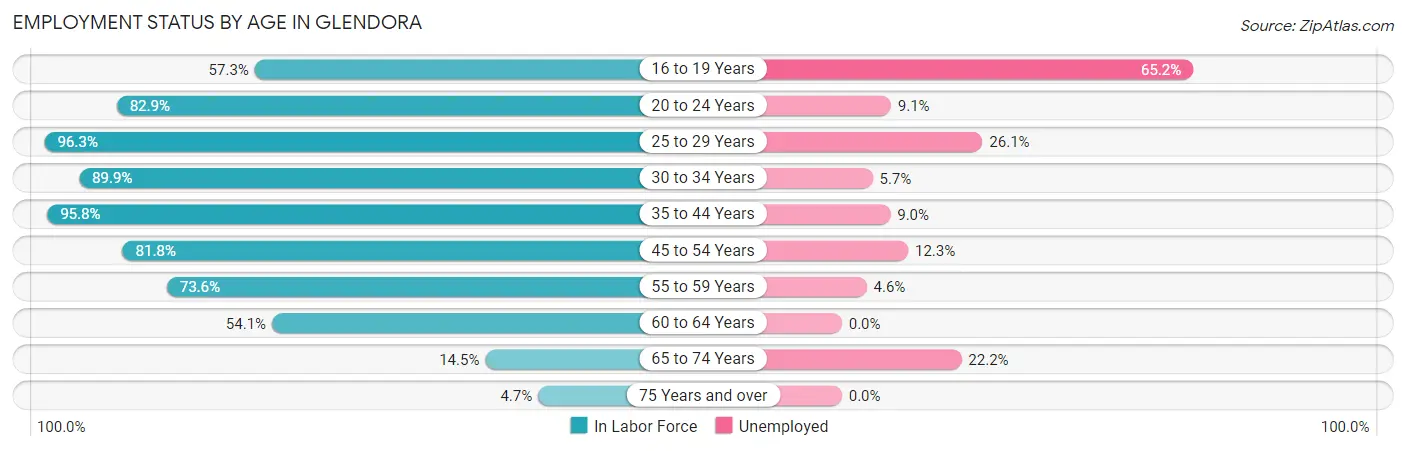
| Age Bracket | In Labor Force | Unemployed |
| 16 to 19 Years | 164 (57.3%) | 107 (65.2%) |
| 20 to 24 Years | 394 (82.9%) | 36 (9.1%) |
| 25 to 29 Years | 414 (96.3%) | 108 (26.1%) |
| 30 to 34 Years | 259 (89.9%) | 15 (5.7%) |
| 35 to 44 Years | 946 (95.8%) | 85 (9.0%) |
| 45 to 54 Years | 617 (81.8%) | 76 (12.3%) |
| 55 to 59 Years | 217 (73.6%) | 10 (4.6%) |
| 60 to 64 Years | 230 (54.1%) | 0 (0.0%) |
| 65 to 74 Years | 99 (14.5%) | 22 (22.2%) |
| 75 Years and over | 18 (4.7%) | 0 (0.0%) |
| Total | 3,358 (67.1%) | 460 (13.7%) |
Employment Status by Educational Attainment in Glendora
According to labor force statistics for Glendora, 84.4% of individuals (2,683) out of the total population between 25 and 64 years of age (3,179) are in the labor force, with 11.0% or 295 of them being unemployed. The group with the highest labor force participation rate are those with the educational attainment of bachelor's degree or higher, with 90.7% or 764 individuals in the labor force. Within the labor force, individuals with less than high school education have the highest percentage of unemployment, with 46.4% or 26 of them being unemployed.
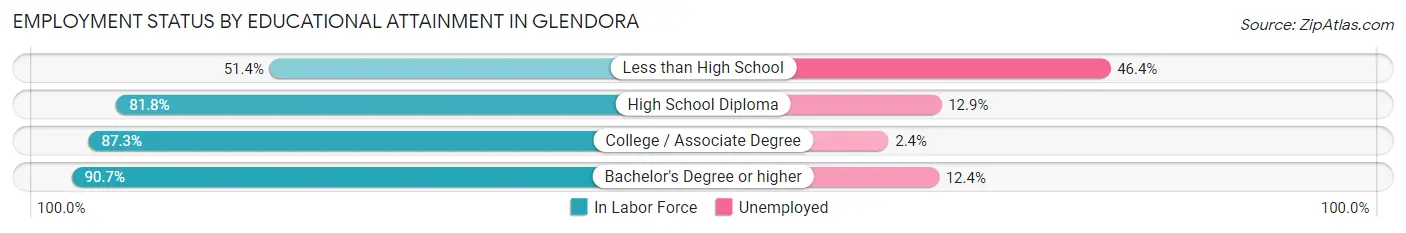
| Educational Attainment | In Labor Force | Unemployed |
| Less than High School | 56 (51.4%) | 51 (46.4%) |
| High School Diploma | 1,219 (81.8%) | 192 (12.9%) |
| College / Associate Degree | 644 (87.3%) | 18 (2.4%) |
| Bachelor's Degree or higher | 764 (90.7%) | 104 (12.4%) |
| Total | 2,683 (84.4%) | 350 (11.0%) |
Employment Occupations by Sex in Glendora
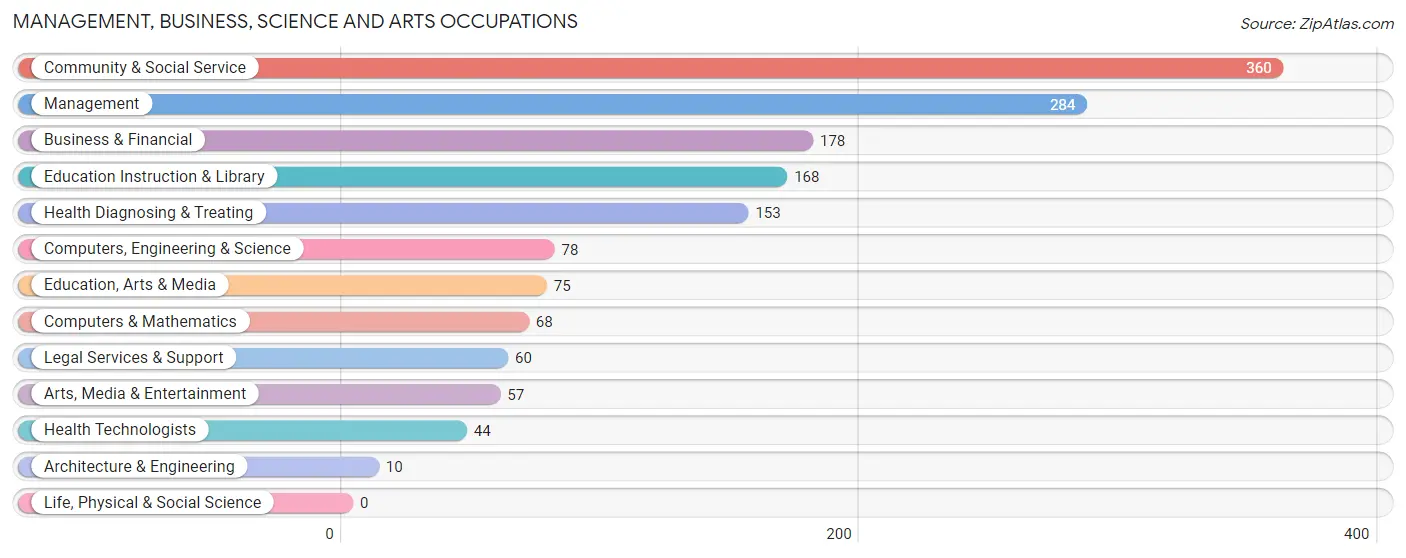
Management, Business, Science and Arts Occupations
The most common Management, Business, Science and Arts occupations in Glendora are Community & Social Service (360 | 12.5%), Management (284 | 9.8%), Business & Financial (178 | 6.2%), Education Instruction & Library (168 | 5.8%), and Health Diagnosing & Treating (153 | 5.3%).
Management, Business, Science and Arts Occupations by Sex
Within the Management, Business, Science and Arts occupations in Glendora, the most male-oriented occupations are Architecture & Engineering (100.0%), Computers, Engineering & Science (82.1%), and Computers & Mathematics (79.4%), while the most female-oriented occupations are Health Technologists (100.0%), Education, Arts & Media (88.0%), and Education Instruction & Library (66.1%).
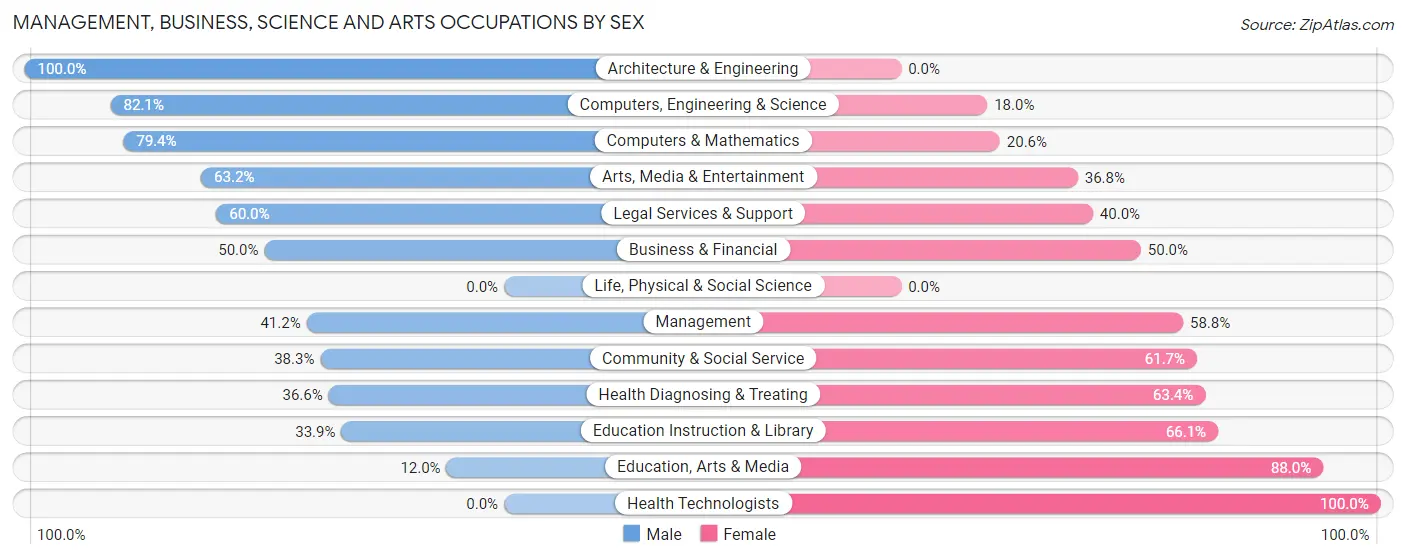
| Occupation | Male | Female |
| Management | 117 (41.2%) | 167 (58.8%) |
| Business & Financial | 89 (50.0%) | 89 (50.0%) |
| Computers, Engineering & Science | 64 (82.1%) | 14 (17.9%) |
| Computers & Mathematics | 54 (79.4%) | 14 (20.6%) |
| Architecture & Engineering | 10 (100.0%) | 0 (0.0%) |
| Life, Physical & Social Science | 0 (0.0%) | 0 (0.0%) |
| Community & Social Service | 138 (38.3%) | 222 (61.7%) |
| Education, Arts & Media | 9 (12.0%) | 66 (88.0%) |
| Legal Services & Support | 36 (60.0%) | 24 (40.0%) |
| Education Instruction & Library | 57 (33.9%) | 111 (66.1%) |
| Arts, Media & Entertainment | 36 (63.2%) | 21 (36.8%) |
| Health Diagnosing & Treating | 56 (36.6%) | 97 (63.4%) |
| Health Technologists | 0 (0.0%) | 44 (100.0%) |
| Total (Category) | 464 (44.1%) | 589 (55.9%) |
| Total (Overall) | 1,502 (52.0%) | 1,386 (48.0%) |
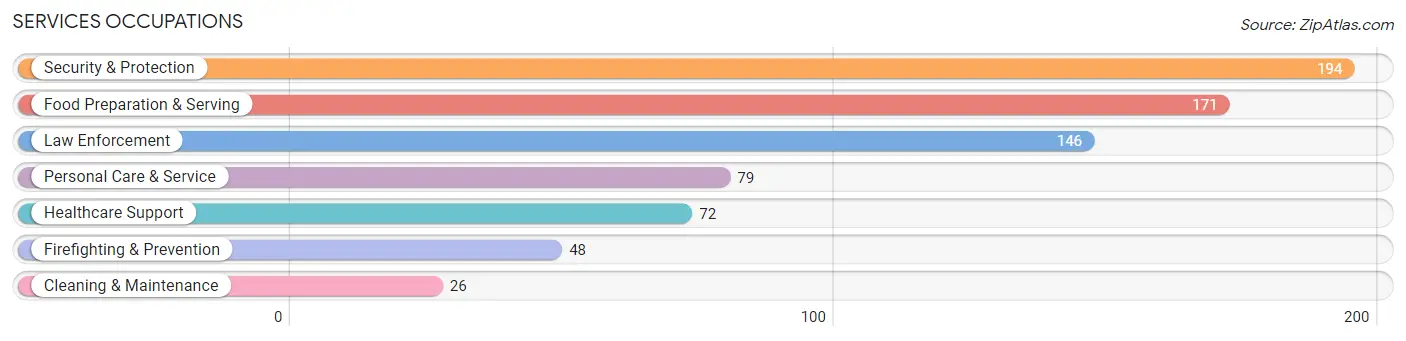
Services Occupations
The most common Services occupations in Glendora are Security & Protection (194 | 6.7%), Food Preparation & Serving (171 | 5.9%), Law Enforcement (146 | 5.1%), Personal Care & Service (79 | 2.7%), and Healthcare Support (72 | 2.5%).
Services Occupations by Sex
Within the Services occupations in Glendora, the most male-oriented occupations are Cleaning & Maintenance (100.0%), Law Enforcement (61.0%), and Security & Protection (53.1%), while the most female-oriented occupations are Healthcare Support (100.0%), Personal Care & Service (81.0%), and Firefighting & Prevention (70.8%).
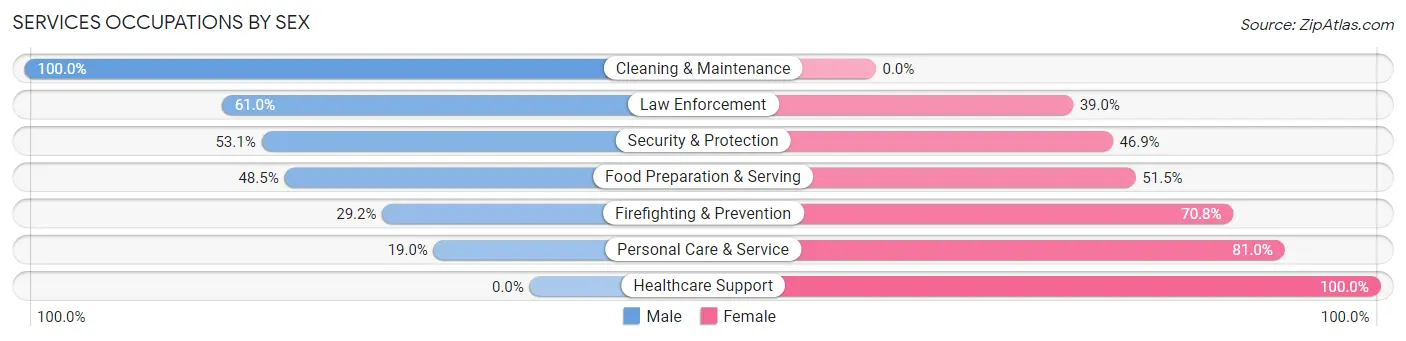
| Occupation | Male | Female |
| Healthcare Support | 0 (0.0%) | 72 (100.0%) |
| Security & Protection | 103 (53.1%) | 91 (46.9%) |
| Firefighting & Prevention | 14 (29.2%) | 34 (70.8%) |
| Law Enforcement | 89 (61.0%) | 57 (39.0%) |
| Food Preparation & Serving | 83 (48.5%) | 88 (51.5%) |
| Cleaning & Maintenance | 26 (100.0%) | 0 (0.0%) |
| Personal Care & Service | 15 (19.0%) | 64 (81.0%) |
| Total (Category) | 227 (41.9%) | 315 (58.1%) |
| Total (Overall) | 1,502 (52.0%) | 1,386 (48.0%) |
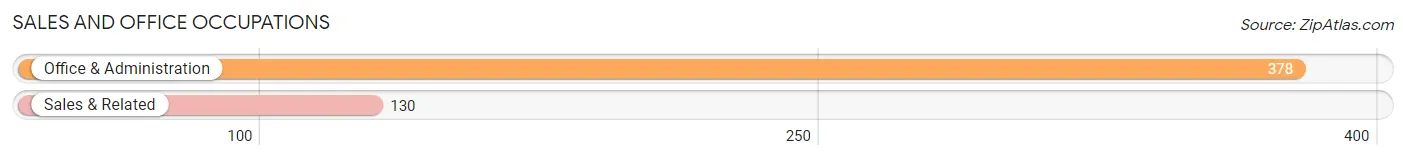
Sales and Office Occupations
The most common Sales and Office occupations in Glendora are Office & Administration (378 | 13.1%), and Sales & Related (130 | 4.5%).
Sales and Office Occupations by Sex
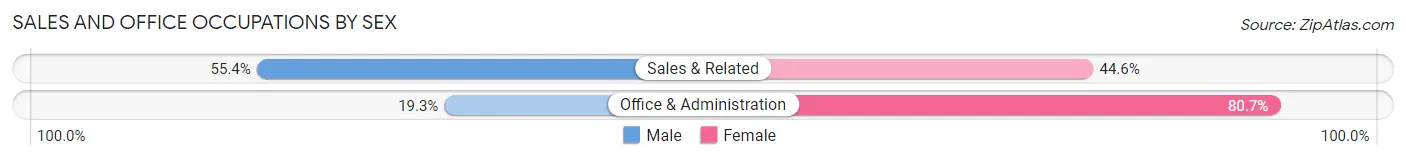
| Occupation | Male | Female |
| Sales & Related | 72 (55.4%) | 58 (44.6%) |
| Office & Administration | 73 (19.3%) | 305 (80.7%) |
| Total (Category) | 145 (28.5%) | 363 (71.5%) |
| Total (Overall) | 1,502 (52.0%) | 1,386 (48.0%) |
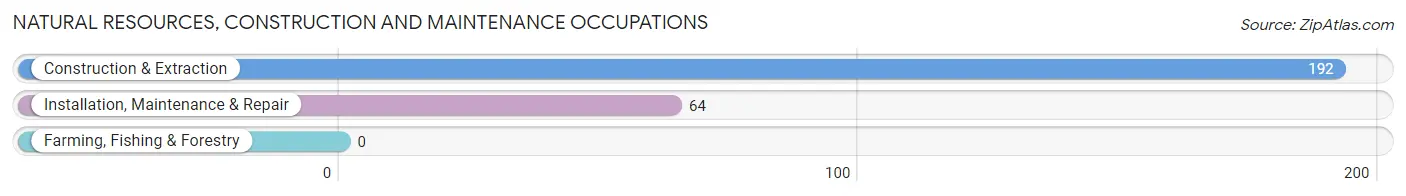
Natural Resources, Construction and Maintenance Occupations
The most common Natural Resources, Construction and Maintenance occupations in Glendora are Construction & Extraction (192 | 6.7%), and Installation, Maintenance & Repair (64 | 2.2%).
Natural Resources, Construction and Maintenance Occupations by Sex
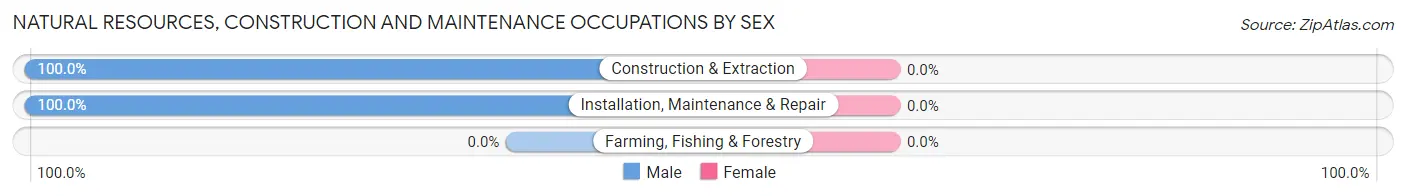
| Occupation | Male | Female |
| Farming, Fishing & Forestry | 0 (0.0%) | 0 (0.0%) |
| Construction & Extraction | 192 (100.0%) | 0 (0.0%) |
| Installation, Maintenance & Repair | 64 (100.0%) | 0 (0.0%) |
| Total (Category) | 256 (100.0%) | 0 (0.0%) |
| Total (Overall) | 1,502 (52.0%) | 1,386 (48.0%) |
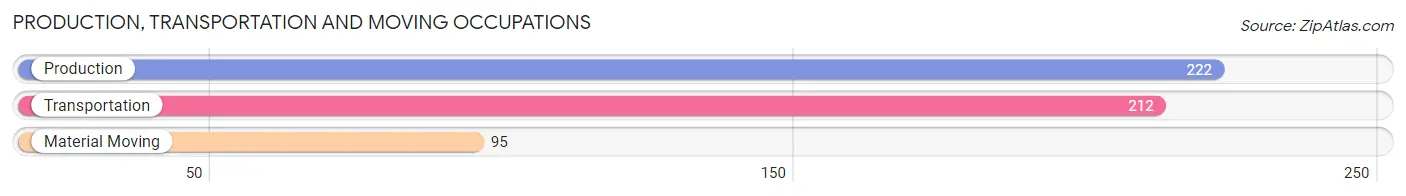
Production, Transportation and Moving Occupations
The most common Production, Transportation and Moving occupations in Glendora are Production (222 | 7.7%), Transportation (212 | 7.3%), and Material Moving (95 | 3.3%).
Production, Transportation and Moving Occupations by Sex
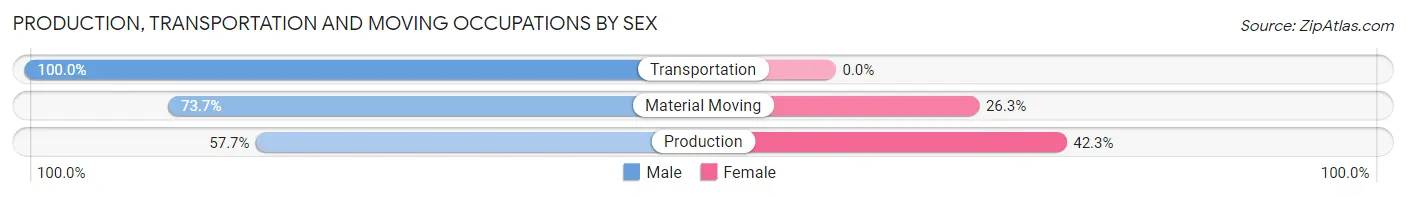
| Occupation | Male | Female |
| Production | 128 (57.7%) | 94 (42.3%) |
| Transportation | 212 (100.0%) | 0 (0.0%) |
| Material Moving | 70 (73.7%) | 25 (26.3%) |
| Total (Category) | 410 (77.5%) | 119 (22.5%) |
| Total (Overall) | 1,502 (52.0%) | 1,386 (48.0%) |
Employment Industries by Sex in Glendora
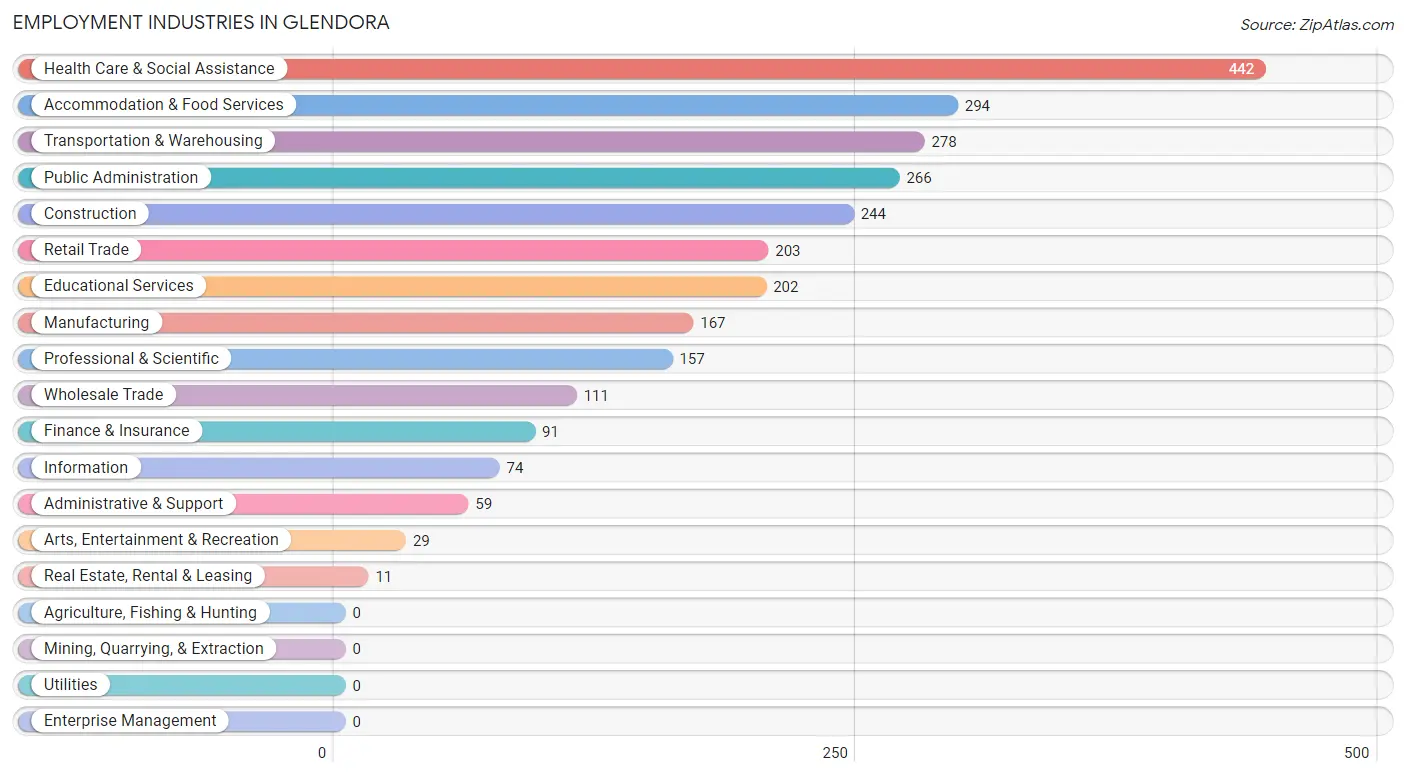
Employment Industries in Glendora
The major employment industries in Glendora include Health Care & Social Assistance (442 | 15.3%), Accommodation & Food Services (294 | 10.2%), Transportation & Warehousing (278 | 9.6%), Public Administration (266 | 9.2%), and Construction (244 | 8.5%).
Employment Industries by Sex in Glendora
The Glendora industries that see more men than women are Arts, Entertainment & Recreation (100.0%), Construction (91.0%), and Manufacturing (83.8%), whereas the industries that tend to have a higher number of women are Real Estate, Rental & Leasing (100.0%), Health Care & Social Assistance (83.9%), and Educational Services (71.8%).
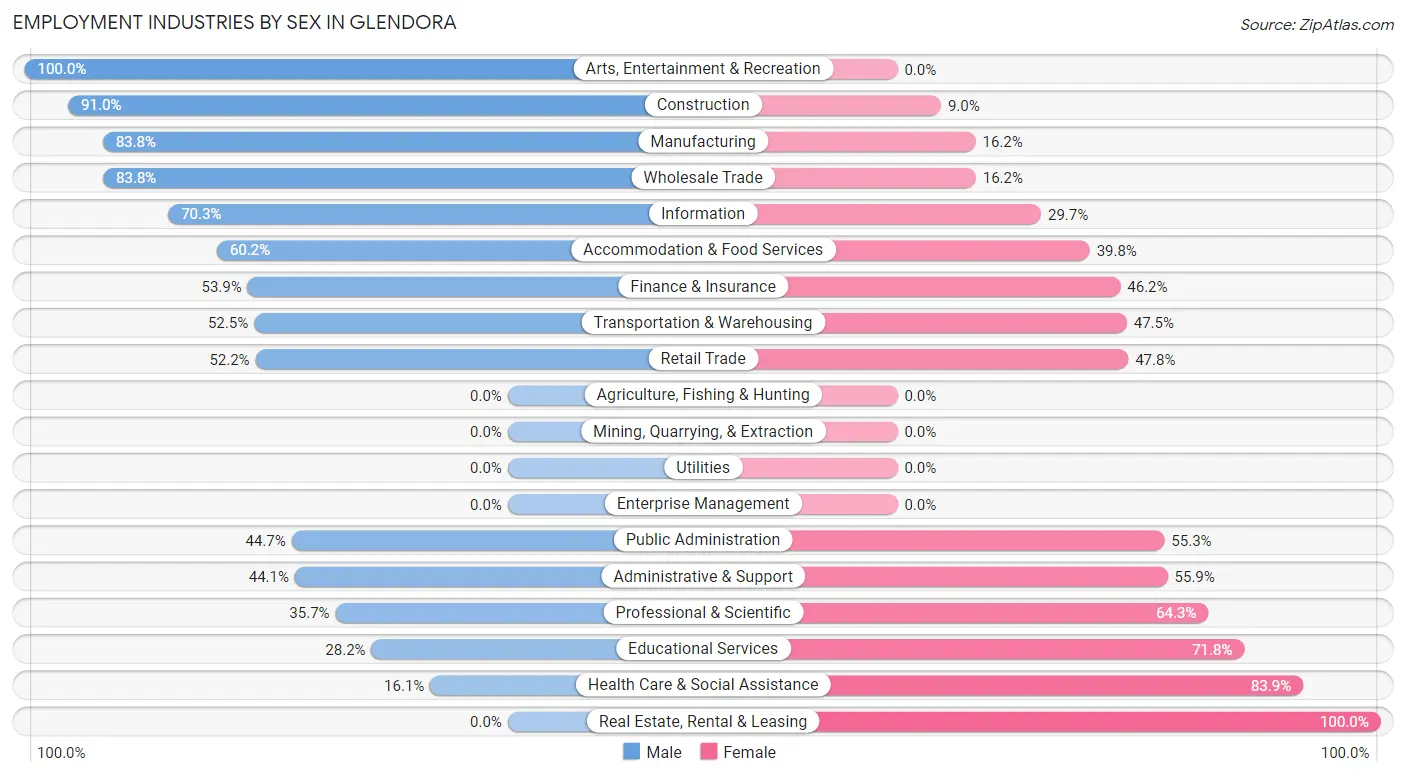
| Industry | Male | Female |
| Agriculture, Fishing & Hunting | 0 (0.0%) | 0 (0.0%) |
| Mining, Quarrying, & Extraction | 0 (0.0%) | 0 (0.0%) |
| Construction | 222 (91.0%) | 22 (9.0%) |
| Manufacturing | 140 (83.8%) | 27 (16.2%) |
| Wholesale Trade | 93 (83.8%) | 18 (16.2%) |
| Retail Trade | 106 (52.2%) | 97 (47.8%) |
| Transportation & Warehousing | 146 (52.5%) | 132 (47.5%) |
| Utilities | 0 (0.0%) | 0 (0.0%) |
| Information | 52 (70.3%) | 22 (29.7%) |
| Finance & Insurance | 49 (53.8%) | 42 (46.2%) |
| Real Estate, Rental & Leasing | 0 (0.0%) | 11 (100.0%) |
| Professional & Scientific | 56 (35.7%) | 101 (64.3%) |
| Enterprise Management | 0 (0.0%) | 0 (0.0%) |
| Administrative & Support | 26 (44.1%) | 33 (55.9%) |
| Educational Services | 57 (28.2%) | 145 (71.8%) |
| Health Care & Social Assistance | 71 (16.1%) | 371 (83.9%) |
| Arts, Entertainment & Recreation | 29 (100.0%) | 0 (0.0%) |
| Accommodation & Food Services | 177 (60.2%) | 117 (39.8%) |
| Public Administration | 119 (44.7%) | 147 (55.3%) |
| Total | 1,502 (52.0%) | 1,386 (48.0%) |
Education in Glendora
School Enrollment in Glendora
The most common levels of schooling among the 1,279 students in Glendora are elementary school (360 | 28.1%), college / undergraduate (270 | 21.1%), and high school (256 | 20.0%).
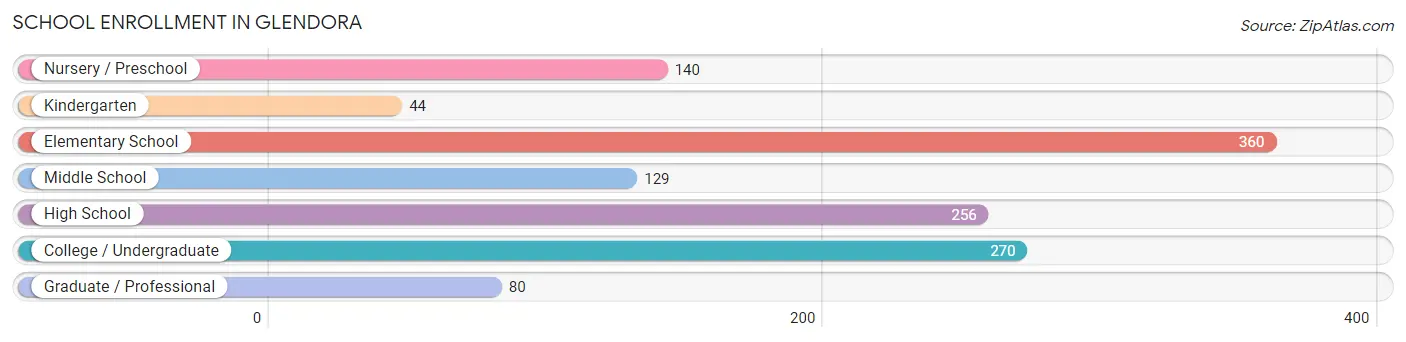
| School Level | # Students | % Students |
| Nursery / Preschool | 140 | 11.0% |
| Kindergarten | 44 | 3.4% |
| Elementary School | 360 | 28.1% |
| Middle School | 129 | 10.1% |
| High School | 256 | 20.0% |
| College / Undergraduate | 270 | 21.1% |
| Graduate / Professional | 80 | 6.2% |
| Total | 1,279 | 100.0% |
School Enrollment by Age by Funding Source in Glendora
Out of a total of 1,279 students who are enrolled in schools in Glendora, 350 (27.4%) attend a private institution, while the remaining 929 (72.6%) are enrolled in public schools. The age group of 25 to 34 year olds has the highest likelihood of being enrolled in private schools, with 17 (58.6% in the age bracket) enrolled. Conversely, the age group of 15 to 17 year olds has the lowest likelihood of being enrolled in a private school, with 208 (100.0% in the age bracket) attending a public institution.
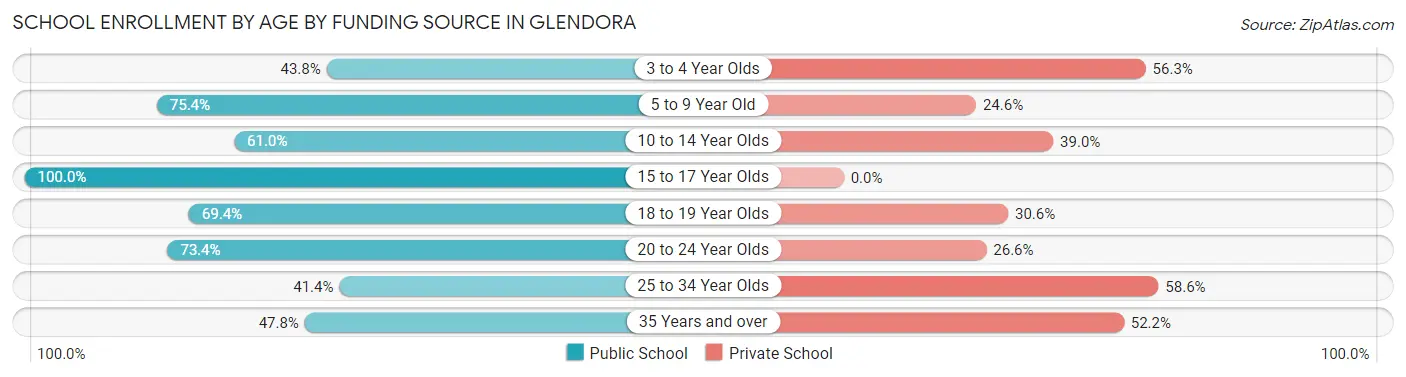
| Age Bracket | Public School | Private School |
| 3 to 4 Year Olds | 28 (43.8%) | 36 (56.2%) |
| 5 to 9 Year Old | 315 (75.4%) | 103 (24.6%) |
| 10 to 14 Year Olds | 125 (61.0%) | 80 (39.0%) |
| 15 to 17 Year Olds | 208 (100.0%) | 0 (0.0%) |
| 18 to 19 Year Olds | 34 (69.4%) | 15 (30.6%) |
| 20 to 24 Year Olds | 174 (73.4%) | 63 (26.6%) |
| 25 to 34 Year Olds | 12 (41.4%) | 17 (58.6%) |
| 35 Years and over | 33 (47.8%) | 36 (52.2%) |
| Total | 929 (72.6%) | 350 (27.4%) |
Educational Attainment by Field of Study in Glendora
Business (180 | 18.9%), education (143 | 15.0%), science & technology (119 | 12.5%), liberal arts & history (93 | 9.8%), and literature & languages (72 | 7.6%) are the most common fields of study among 953 individuals in Glendora who have obtained a bachelor's degree or higher.
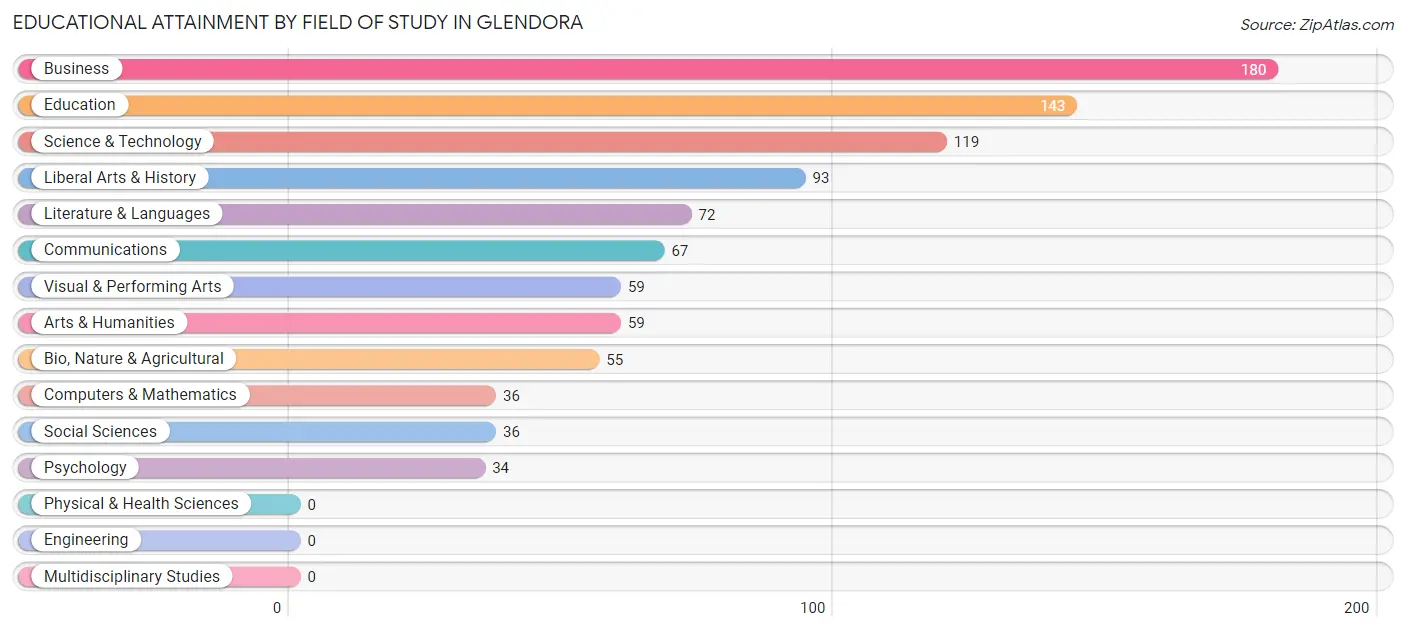
| Field of Study | # Graduates | % Graduates |
| Computers & Mathematics | 36 | 3.8% |
| Bio, Nature & Agricultural | 55 | 5.8% |
| Physical & Health Sciences | 0 | 0.0% |
| Psychology | 34 | 3.6% |
| Social Sciences | 36 | 3.8% |
| Engineering | 0 | 0.0% |
| Multidisciplinary Studies | 0 | 0.0% |
| Science & Technology | 119 | 12.5% |
| Business | 180 | 18.9% |
| Education | 143 | 15.0% |
| Literature & Languages | 72 | 7.6% |
| Liberal Arts & History | 93 | 9.8% |
| Visual & Performing Arts | 59 | 6.2% |
| Communications | 67 | 7.0% |
| Arts & Humanities | 59 | 6.2% |
| Total | 953 | 100.0% |
Transportation & Commute in Glendora
Vehicle Availability by Sex in Glendora
The most prevalent vehicle ownership categories in Glendora are males with 2 vehicles (770, accounting for 51.9%) and females with 2 vehicles (461, making up 61.0%).
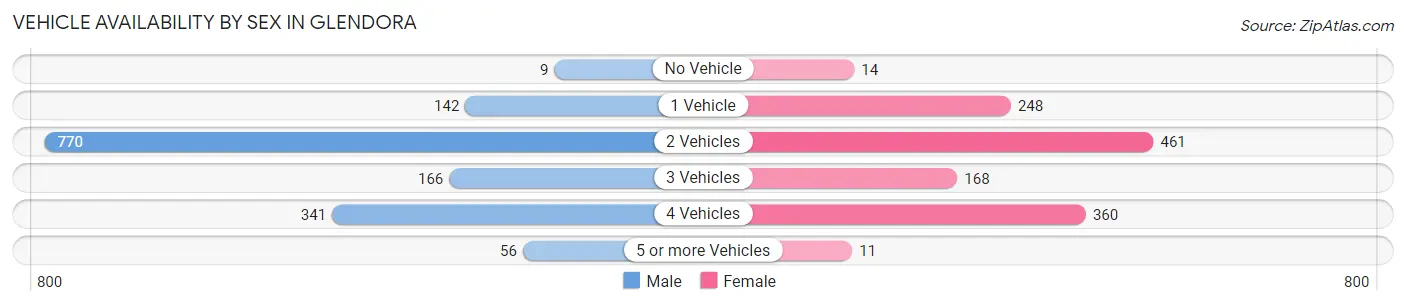
| Vehicles Available | Male | Female |
| No Vehicle | 9 (0.6%) | 14 (1.1%) |
| 1 Vehicle | 142 (9.6%) | 248 (19.7%) |
| 2 Vehicles | 770 (51.9%) | 461 (36.5%) |
| 3 Vehicles | 166 (11.2%) | 168 (13.3%) |
| 4 Vehicles | 341 (23.0%) | 360 (28.5%) |
| 5 or more Vehicles | 56 (3.8%) | 11 (0.9%) |
| Total | 1,484 (100.0%) | 1,262 (100.0%) |
Commute Time in Glendora
The most frequently occuring commute durations in Glendora are 30 to 34 minutes (374 commuters, 15.0%), 15 to 19 minutes (371 commuters, 14.9%), and 10 to 14 minutes (369 commuters, 14.8%).
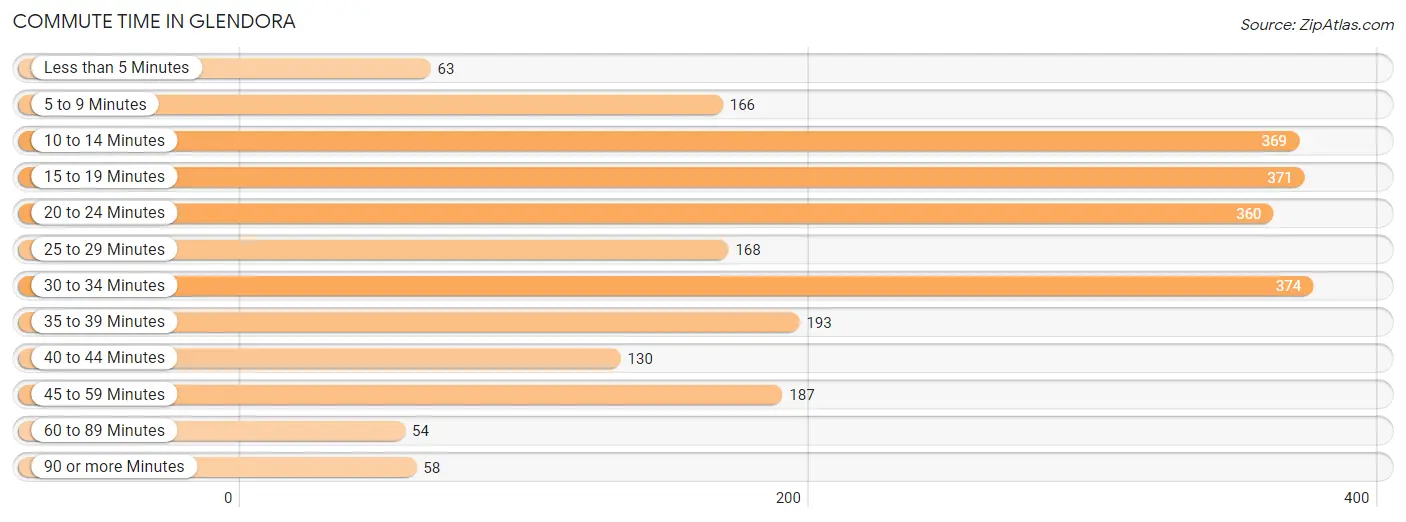
| Commute Time | # Commuters | % Commuters |
| Less than 5 Minutes | 63 | 2.5% |
| 5 to 9 Minutes | 166 | 6.7% |
| 10 to 14 Minutes | 369 | 14.8% |
| 15 to 19 Minutes | 371 | 14.9% |
| 20 to 24 Minutes | 360 | 14.4% |
| 25 to 29 Minutes | 168 | 6.7% |
| 30 to 34 Minutes | 374 | 15.0% |
| 35 to 39 Minutes | 193 | 7.7% |
| 40 to 44 Minutes | 130 | 5.2% |
| 45 to 59 Minutes | 187 | 7.5% |
| 60 to 89 Minutes | 54 | 2.2% |
| 90 or more Minutes | 58 | 2.3% |
Commute Time by Sex in Glendora
The most common commute times in Glendora are 10 to 14 minutes (312 commuters, 22.9%) for males and 20 to 24 minutes (224 commuters, 19.8%) for females.
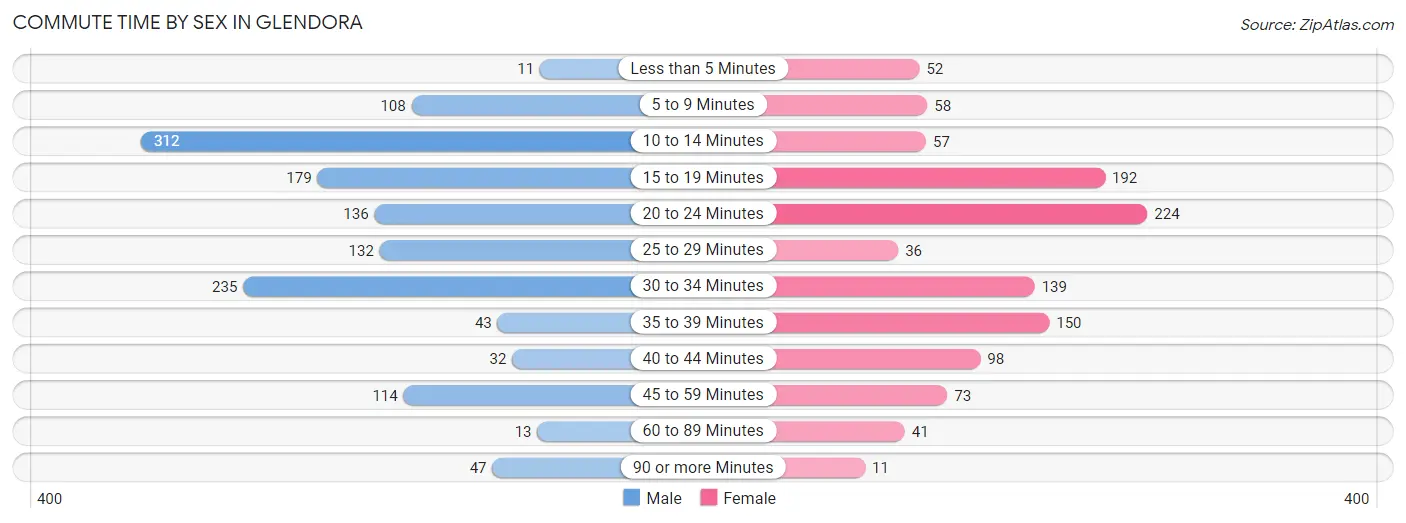
| Commute Time | Male | Female |
| Less than 5 Minutes | 11 (0.8%) | 52 (4.6%) |
| 5 to 9 Minutes | 108 (7.9%) | 58 (5.1%) |
| 10 to 14 Minutes | 312 (22.9%) | 57 (5.0%) |
| 15 to 19 Minutes | 179 (13.1%) | 192 (17.0%) |
| 20 to 24 Minutes | 136 (10.0%) | 224 (19.8%) |
| 25 to 29 Minutes | 132 (9.7%) | 36 (3.2%) |
| 30 to 34 Minutes | 235 (17.2%) | 139 (12.3%) |
| 35 to 39 Minutes | 43 (3.2%) | 150 (13.3%) |
| 40 to 44 Minutes | 32 (2.4%) | 98 (8.7%) |
| 45 to 59 Minutes | 114 (8.4%) | 73 (6.5%) |
| 60 to 89 Minutes | 13 (0.9%) | 41 (3.6%) |
| 90 or more Minutes | 47 (3.5%) | 11 (1.0%) |
Time of Departure to Work by Sex in Glendora
The most frequent times of departure to work in Glendora are 7:30 AM to 7:59 AM (246, 18.1%) for males and 7:00 AM to 7:29 AM (243, 21.5%) for females.
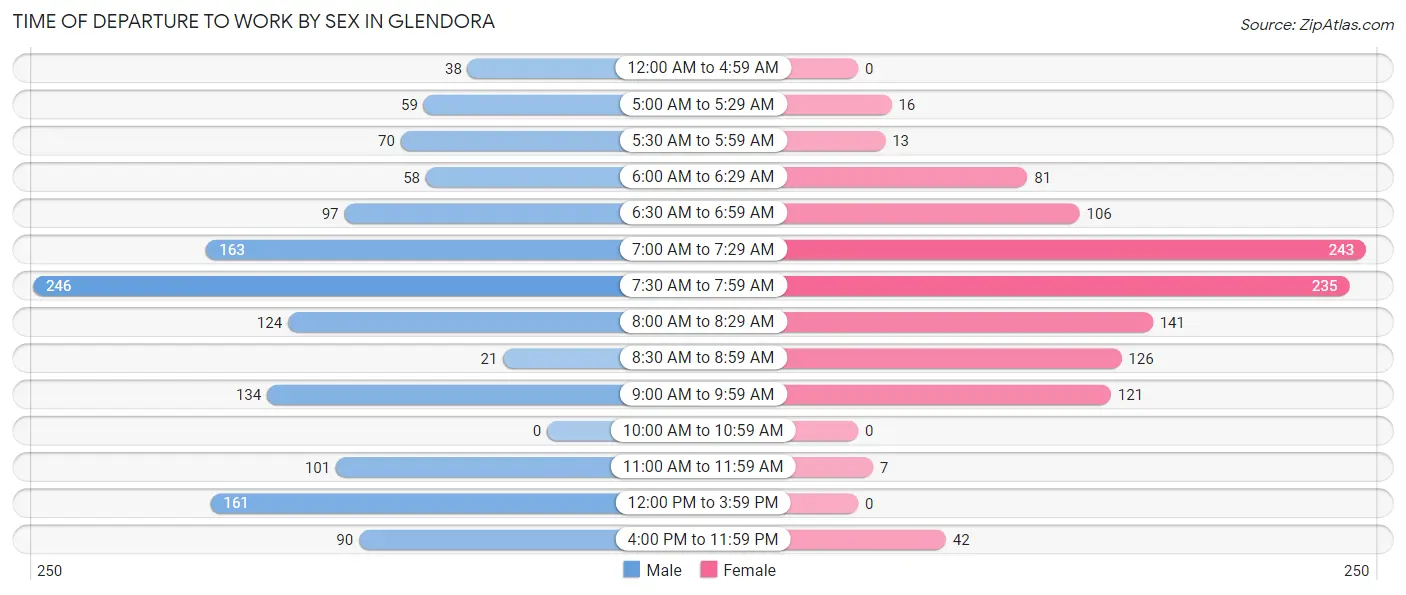
| Time of Departure | Male | Female |
| 12:00 AM to 4:59 AM | 38 (2.8%) | 0 (0.0%) |
| 5:00 AM to 5:29 AM | 59 (4.3%) | 16 (1.4%) |
| 5:30 AM to 5:59 AM | 70 (5.1%) | 13 (1.1%) |
| 6:00 AM to 6:29 AM | 58 (4.3%) | 81 (7.2%) |
| 6:30 AM to 6:59 AM | 97 (7.1%) | 106 (9.4%) |
| 7:00 AM to 7:29 AM | 163 (12.0%) | 243 (21.5%) |
| 7:30 AM to 7:59 AM | 246 (18.1%) | 235 (20.8%) |
| 8:00 AM to 8:29 AM | 124 (9.1%) | 141 (12.5%) |
| 8:30 AM to 8:59 AM | 21 (1.5%) | 126 (11.1%) |
| 9:00 AM to 9:59 AM | 134 (9.8%) | 121 (10.7%) |
| 10:00 AM to 10:59 AM | 0 (0.0%) | 0 (0.0%) |
| 11:00 AM to 11:59 AM | 101 (7.4%) | 7 (0.6%) |
| 12:00 PM to 3:59 PM | 161 (11.8%) | 0 (0.0%) |
| 4:00 PM to 11:59 PM | 90 (6.6%) | 42 (3.7%) |
| Total | 1,362 (100.0%) | 1,131 (100.0%) |
Housing Occupancy in Glendora
Occupancy by Ownership in Glendora
Of the total 2,296 dwellings in Glendora, owner-occupied units account for 1,670 (72.7%), while renter-occupied units make up 626 (27.3%).
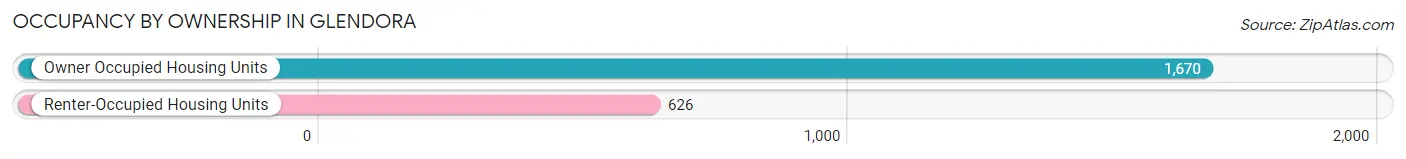
| Occupancy | # Housing Units | % Housing Units |
| Owner Occupied Housing Units | 1,670 | 72.7% |
| Renter-Occupied Housing Units | 626 | 27.3% |
| Total Occupied Housing Units | 2,296 | 100.0% |
Occupancy by Household Size in Glendora
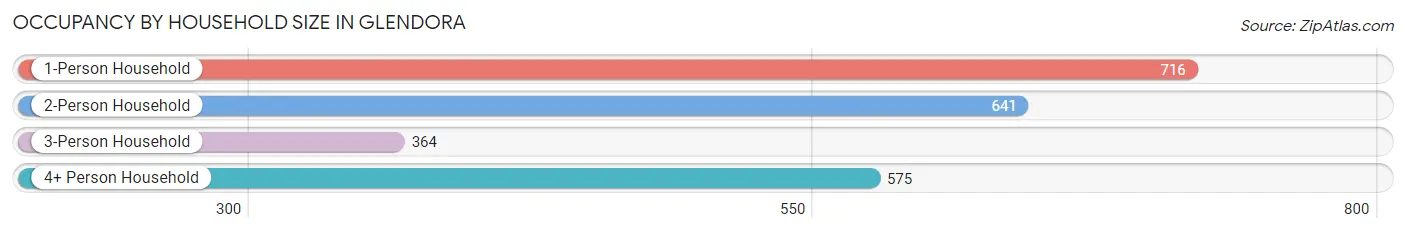
| Household Size | # Housing Units | % Housing Units |
| 1-Person Household | 716 | 31.2% |
| 2-Person Household | 641 | 27.9% |
| 3-Person Household | 364 | 15.9% |
| 4+ Person Household | 575 | 25.0% |
| Total Housing Units | 2,296 | 100.0% |
Occupancy by Ownership by Household Size in Glendora
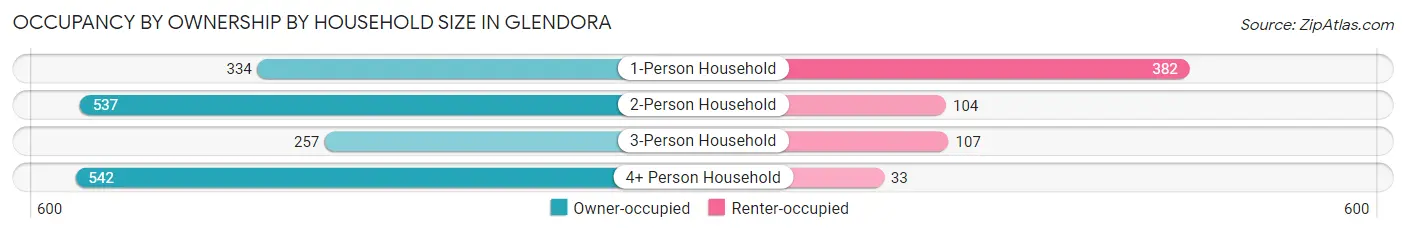
| Household Size | Owner-occupied | Renter-occupied |
| 1-Person Household | 334 (46.7%) | 382 (53.3%) |
| 2-Person Household | 537 (83.8%) | 104 (16.2%) |
| 3-Person Household | 257 (70.6%) | 107 (29.4%) |
| 4+ Person Household | 542 (94.3%) | 33 (5.7%) |
| Total Housing Units | 1,670 (72.7%) | 626 (27.3%) |
Occupancy by Educational Attainment in Glendora
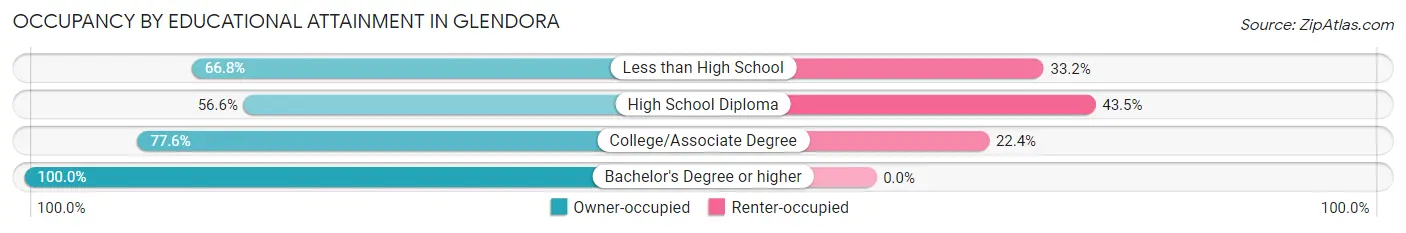
| Household Size | Owner-occupied | Renter-occupied |
| Less than High School | 141 (66.8%) | 70 (33.2%) |
| High School Diploma | 561 (56.6%) | 431 (43.4%) |
| College/Associate Degree | 434 (77.6%) | 125 (22.4%) |
| Bachelor's Degree or higher | 534 (100.0%) | 0 (0.0%) |
Occupancy by Age of Householder in Glendora
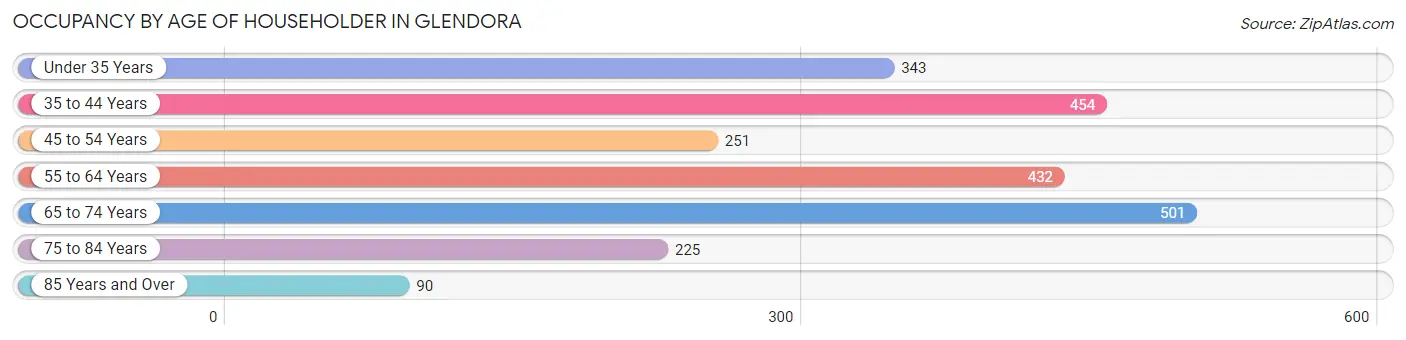
| Age Bracket | # Households | % Households |
| Under 35 Years | 343 | 14.9% |
| 35 to 44 Years | 454 | 19.8% |
| 45 to 54 Years | 251 | 10.9% |
| 55 to 64 Years | 432 | 18.8% |
| 65 to 74 Years | 501 | 21.8% |
| 75 to 84 Years | 225 | 9.8% |
| 85 Years and Over | 90 | 3.9% |
| Total | 2,296 | 100.0% |
Housing Finances in Glendora
Median Income by Occupancy in Glendora
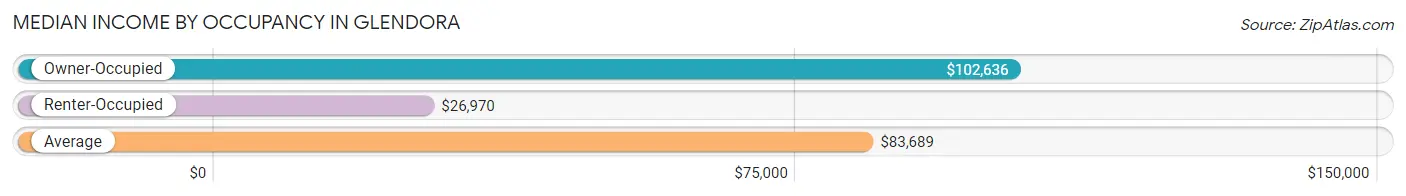
| Occupancy Type | # Households | Median Income |
| Owner-Occupied | 1,670 (72.7%) | $102,636 |
| Renter-Occupied | 626 (27.3%) | $26,970 |
| Average | 2,296 (100.0%) | $83,689 |
Occupancy by Householder Income Bracket in Glendora
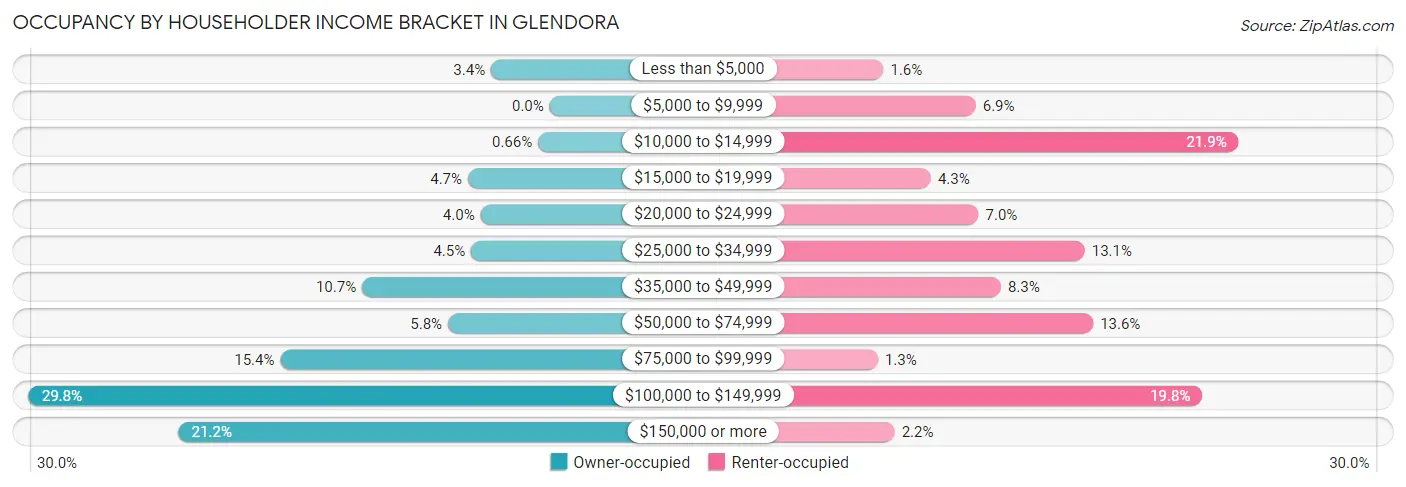
| Income Bracket | Owner-occupied | Renter-occupied |
| Less than $5,000 | 56 (3.4%) | 10 (1.6%) |
| $5,000 to $9,999 | 0 (0.0%) | 43 (6.9%) |
| $10,000 to $14,999 | 11 (0.7%) | 137 (21.9%) |
| $15,000 to $19,999 | 78 (4.7%) | 27 (4.3%) |
| $20,000 to $24,999 | 66 (4.0%) | 44 (7.0%) |
| $25,000 to $34,999 | 75 (4.5%) | 82 (13.1%) |
| $35,000 to $49,999 | 179 (10.7%) | 52 (8.3%) |
| $50,000 to $74,999 | 97 (5.8%) | 85 (13.6%) |
| $75,000 to $99,999 | 257 (15.4%) | 8 (1.3%) |
| $100,000 to $149,999 | 497 (29.8%) | 124 (19.8%) |
| $150,000 or more | 354 (21.2%) | 14 (2.2%) |
| Total | 1,670 (100.0%) | 626 (100.0%) |
Monthly Housing Cost Tiers in Glendora
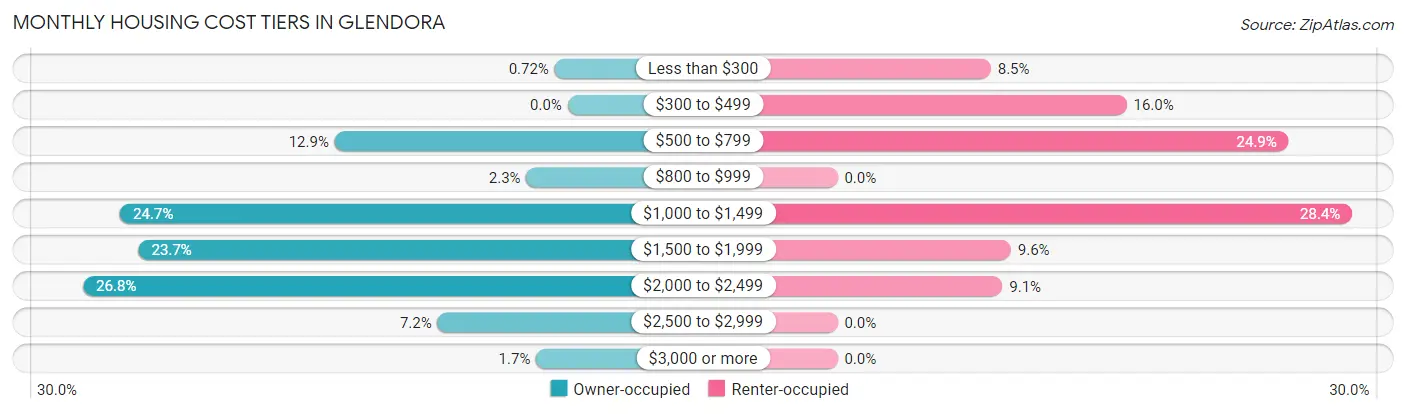
| Monthly Cost | Owner-occupied | Renter-occupied |
| Less than $300 | 12 (0.7%) | 53 (8.5%) |
| $300 to $499 | 0 (0.0%) | 100 (16.0%) |
| $500 to $799 | 215 (12.9%) | 156 (24.9%) |
| $800 to $999 | 38 (2.3%) | 0 (0.0%) |
| $1,000 to $1,499 | 413 (24.7%) | 178 (28.4%) |
| $1,500 to $1,999 | 396 (23.7%) | 60 (9.6%) |
| $2,000 to $2,499 | 447 (26.8%) | 57 (9.1%) |
| $2,500 to $2,999 | 120 (7.2%) | 0 (0.0%) |
| $3,000 or more | 29 (1.7%) | 0 (0.0%) |
| Total | 1,670 (100.0%) | 626 (100.0%) |
Physical Housing Characteristics in Glendora
Housing Structures in Glendora
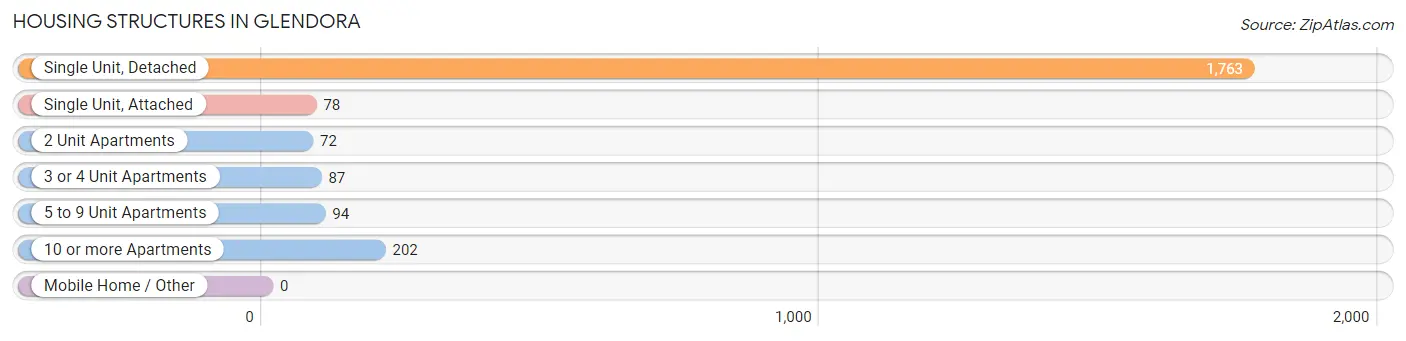
| Structure Type | # Housing Units | % Housing Units |
| Single Unit, Detached | 1,763 | 76.8% |
| Single Unit, Attached | 78 | 3.4% |
| 2 Unit Apartments | 72 | 3.1% |
| 3 or 4 Unit Apartments | 87 | 3.8% |
| 5 to 9 Unit Apartments | 94 | 4.1% |
| 10 or more Apartments | 202 | 8.8% |
| Mobile Home / Other | 0 | 0.0% |
| Total | 2,296 | 100.0% |
Housing Structures by Occupancy in Glendora
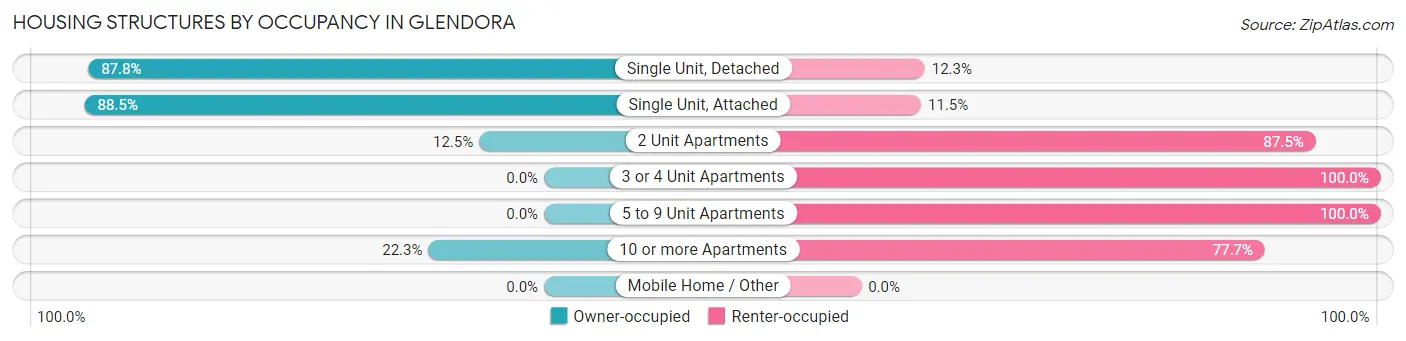
| Structure Type | Owner-occupied | Renter-occupied |
| Single Unit, Detached | 1,547 (87.7%) | 216 (12.2%) |
| Single Unit, Attached | 69 (88.5%) | 9 (11.5%) |
| 2 Unit Apartments | 9 (12.5%) | 63 (87.5%) |
| 3 or 4 Unit Apartments | 0 (0.0%) | 87 (100.0%) |
| 5 to 9 Unit Apartments | 0 (0.0%) | 94 (100.0%) |
| 10 or more Apartments | 45 (22.3%) | 157 (77.7%) |
| Mobile Home / Other | 0 (0.0%) | 0 (0.0%) |
| Total | 1,670 (72.7%) | 626 (27.3%) |
Housing Structures by Number of Rooms in Glendora
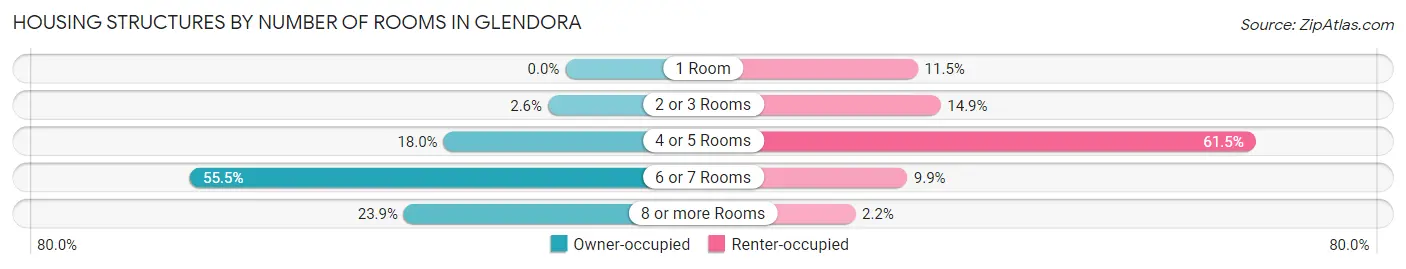
| Number of Rooms | Owner-occupied | Renter-occupied |
| 1 Room | 0 (0.0%) | 72 (11.5%) |
| 2 or 3 Rooms | 43 (2.6%) | 93 (14.9%) |
| 4 or 5 Rooms | 301 (18.0%) | 385 (61.5%) |
| 6 or 7 Rooms | 927 (55.5%) | 62 (9.9%) |
| 8 or more Rooms | 399 (23.9%) | 14 (2.2%) |
| Total | 1,670 (100.0%) | 626 (100.0%) |
Housing Structure by Heating Type in Glendora
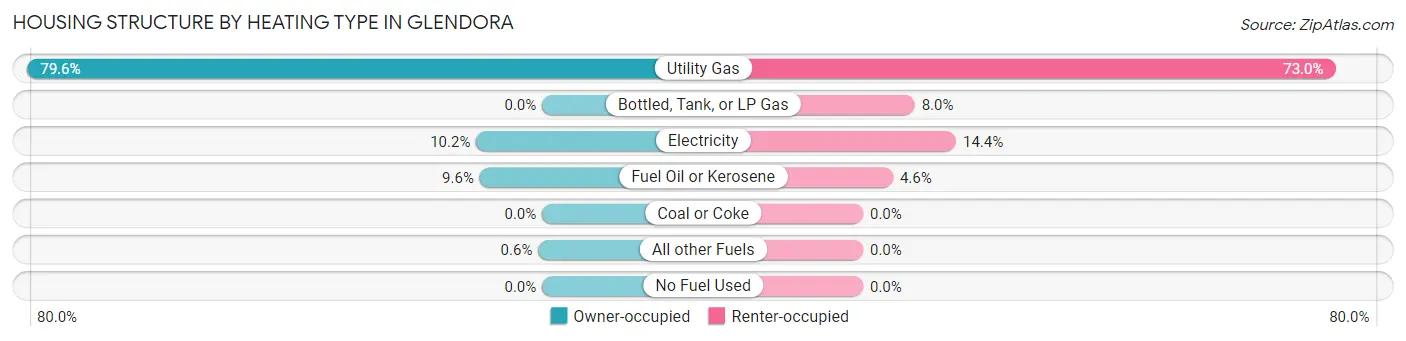
| Heating Type | Owner-occupied | Renter-occupied |
| Utility Gas | 1,329 (79.6%) | 457 (73.0%) |
| Bottled, Tank, or LP Gas | 0 (0.0%) | 50 (8.0%) |
| Electricity | 170 (10.2%) | 90 (14.4%) |
| Fuel Oil or Kerosene | 161 (9.6%) | 29 (4.6%) |
| Coal or Coke | 0 (0.0%) | 0 (0.0%) |
| All other Fuels | 10 (0.6%) | 0 (0.0%) |
| No Fuel Used | 0 (0.0%) | 0 (0.0%) |
| Total | 1,670 (100.0%) | 626 (100.0%) |
Household Vehicle Usage in Glendora
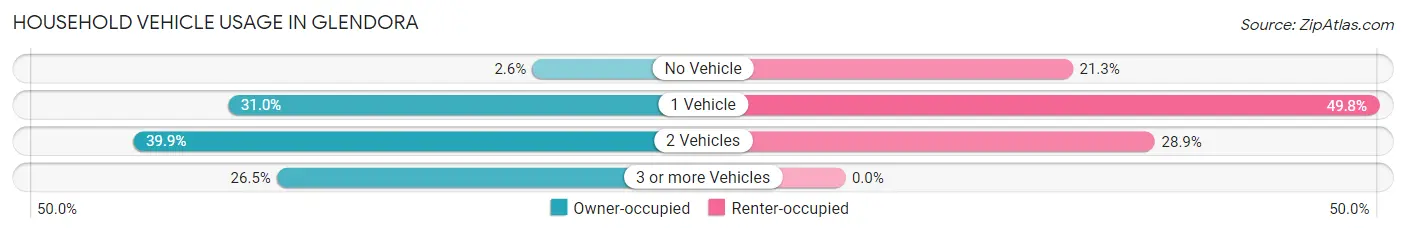
| Vehicles per Household | Owner-occupied | Renter-occupied |
| No Vehicle | 44 (2.6%) | 133 (21.2%) |
| 1 Vehicle | 518 (31.0%) | 312 (49.8%) |
| 2 Vehicles | 666 (39.9%) | 181 (28.9%) |
| 3 or more Vehicles | 442 (26.5%) | 0 (0.0%) |
| Total | 1,670 (100.0%) | 626 (100.0%) |
Real Estate & Mortgages in Glendora
Real Estate and Mortgage Overview in Glendora
| Characteristic | Without Mortgage | With Mortgage |
| Housing Units | 612 | 1,058 |
| Median Property Value | $187,700 | $210,400 |
| Median Household Income | $89,531 | $211 |
| Monthly Housing Costs | $1,038 | $29 |
| Real Estate Taxes | $6,875 | $11 |
Property Value by Mortgage Status in Glendora
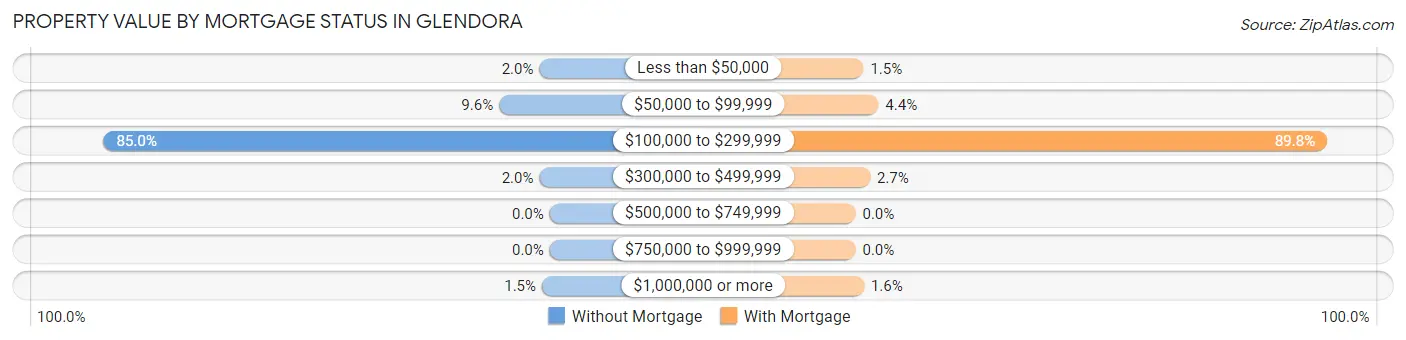
| Property Value | Without Mortgage | With Mortgage |
| Less than $50,000 | 12 (2.0%) | 16 (1.5%) |
| $50,000 to $99,999 | 59 (9.6%) | 46 (4.3%) |
| $100,000 to $299,999 | 520 (85.0%) | 950 (89.8%) |
| $300,000 to $499,999 | 12 (2.0%) | 29 (2.7%) |
| $500,000 to $749,999 | 0 (0.0%) | 0 (0.0%) |
| $750,000 to $999,999 | 0 (0.0%) | 0 (0.0%) |
| $1,000,000 or more | 9 (1.5%) | 17 (1.6%) |
| Total | 612 (100.0%) | 1,058 (100.0%) |
Household Income by Mortgage Status in Glendora
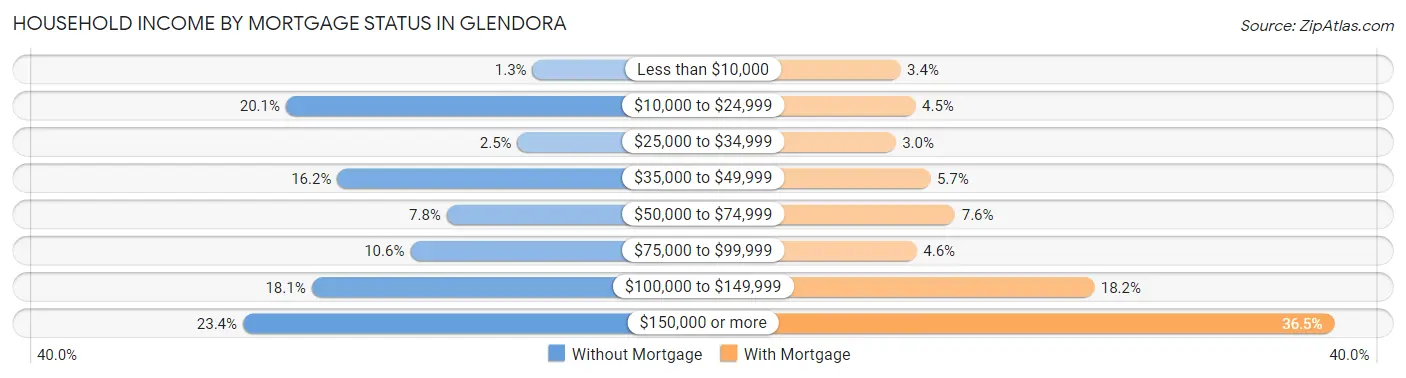
| Household Income | Without Mortgage | With Mortgage |
| Less than $10,000 | 8 (1.3%) | 36 (3.4%) |
| $10,000 to $24,999 | 123 (20.1%) | 48 (4.5%) |
| $25,000 to $34,999 | 15 (2.5%) | 32 (3.0%) |
| $35,000 to $49,999 | 99 (16.2%) | 60 (5.7%) |
| $50,000 to $74,999 | 48 (7.8%) | 80 (7.6%) |
| $75,000 to $99,999 | 65 (10.6%) | 49 (4.6%) |
| $100,000 to $149,999 | 111 (18.1%) | 192 (18.1%) |
| $150,000 or more | 143 (23.4%) | 386 (36.5%) |
| Total | 612 (100.0%) | 1,058 (100.0%) |
Property Value to Household Income Ratio in Glendora
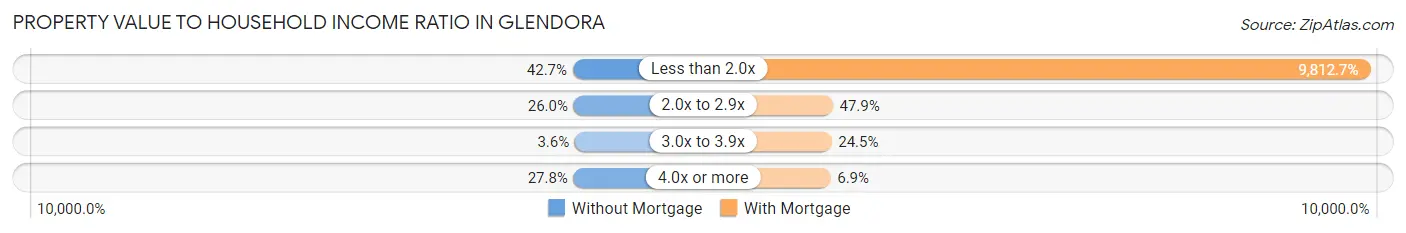
| Value-to-Income Ratio | Without Mortgage | With Mortgage |
| Less than 2.0x | 261 (42.6%) | 103,818 (9,812.7%) |
| 2.0x to 2.9x | 159 (26.0%) | 507 (47.9%) |
| 3.0x to 3.9x | 22 (3.6%) | 259 (24.5%) |
| 4.0x or more | 170 (27.8%) | 73 (6.9%) |
| Total | 612 (100.0%) | 1,058 (100.0%) |
Real Estate Taxes by Mortgage Status in Glendora
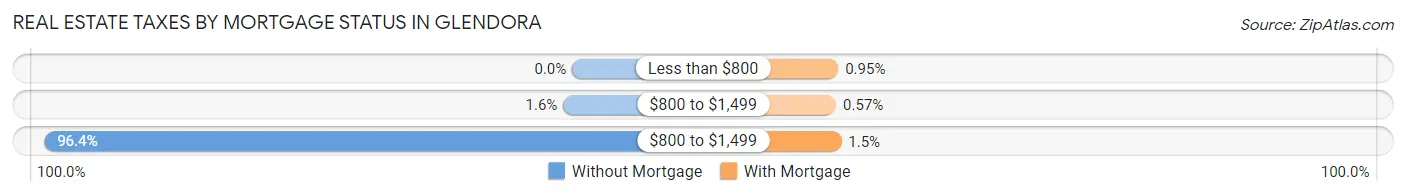
| Property Taxes | Without Mortgage | With Mortgage |
| Less than $800 | 0 (0.0%) | 10 (0.9%) |
| $800 to $1,499 | 10 (1.6%) | 6 (0.6%) |
| $800 to $1,499 | 590 (96.4%) | 16 (1.5%) |
| Total | 612 (100.0%) | 1,058 (100.0%) |
Health & Disability in Glendora
Health Insurance Coverage by Age in Glendora
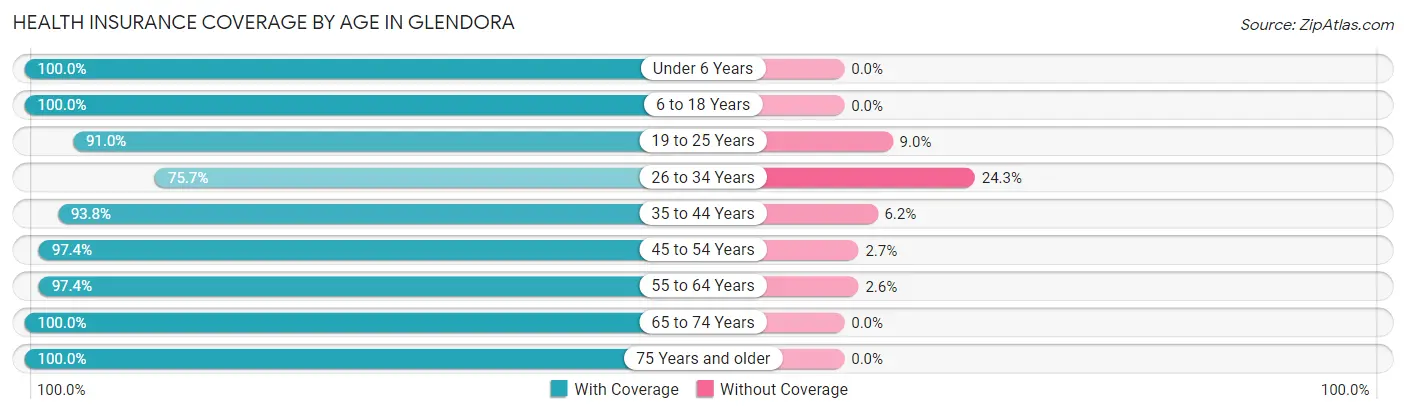
| Age Bracket | With Coverage | Without Coverage |
| Under 6 Years | 266 (100.0%) | 0 (0.0%) |
| 6 to 18 Years | 789 (100.0%) | 0 (0.0%) |
| 19 to 25 Years | 565 (91.0%) | 56 (9.0%) |
| 26 to 34 Years | 457 (75.7%) | 147 (24.3%) |
| 35 to 44 Years | 926 (93.8%) | 61 (6.2%) |
| 45 to 54 Years | 734 (97.4%) | 20 (2.6%) |
| 55 to 64 Years | 701 (97.4%) | 19 (2.6%) |
| 65 to 74 Years | 684 (100.0%) | 0 (0.0%) |
| 75 Years and older | 380 (100.0%) | 0 (0.0%) |
| Total | 5,502 (94.8%) | 303 (5.2%) |
Health Insurance Coverage by Citizenship Status in Glendora
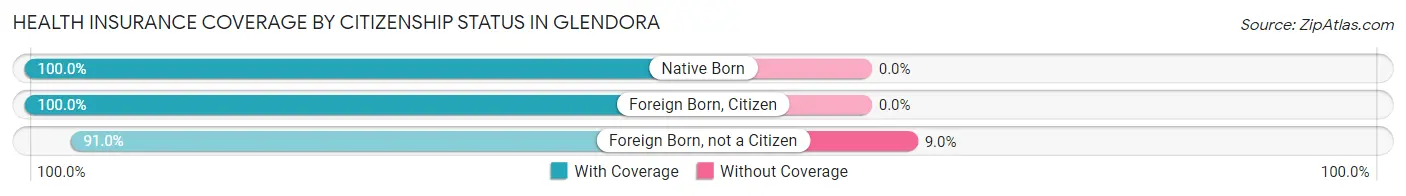
| Citizenship Status | With Coverage | Without Coverage |
| Native Born | 266 (100.0%) | 0 (0.0%) |
| Foreign Born, Citizen | 789 (100.0%) | 0 (0.0%) |
| Foreign Born, not a Citizen | 565 (91.0%) | 56 (9.0%) |
Health Insurance Coverage by Household Income in Glendora
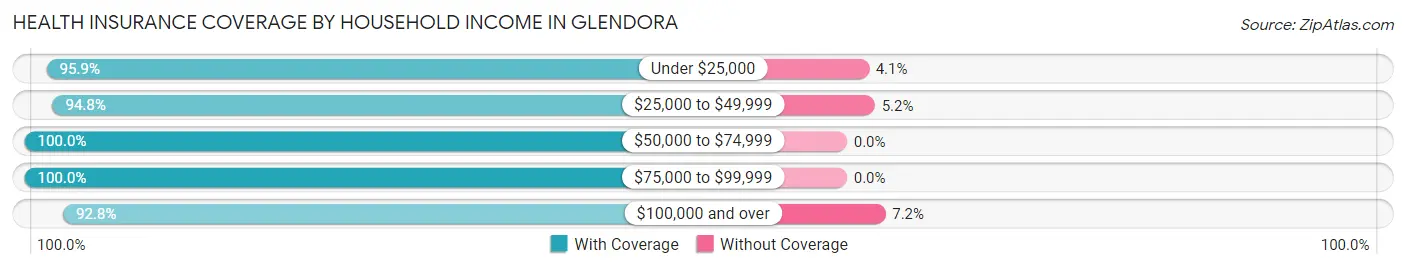
| Household Income | With Coverage | Without Coverage |
| Under $25,000 | 560 (95.9%) | 24 (4.1%) |
| $25,000 to $49,999 | 742 (94.8%) | 41 (5.2%) |
| $50,000 to $74,999 | 375 (100.0%) | 0 (0.0%) |
| $75,000 to $99,999 | 763 (100.0%) | 0 (0.0%) |
| $100,000 and over | 3,062 (92.8%) | 238 (7.2%) |
Public vs Private Health Insurance Coverage by Age in Glendora
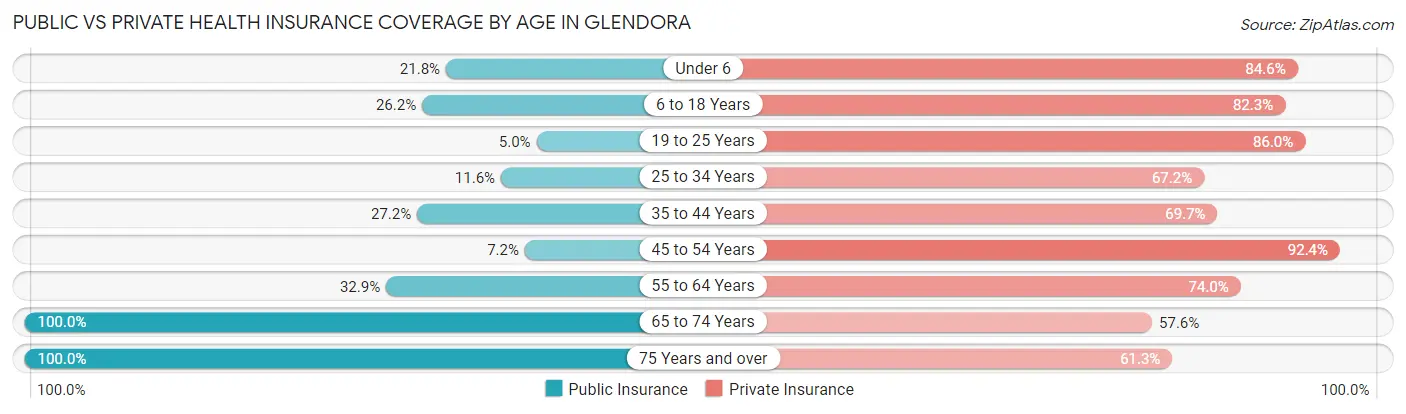
| Age Bracket | Public Insurance | Private Insurance |
| Under 6 | 58 (21.8%) | 225 (84.6%) |
| 6 to 18 Years | 207 (26.2%) | 649 (82.3%) |
| 19 to 25 Years | 31 (5.0%) | 534 (86.0%) |
| 25 to 34 Years | 70 (11.6%) | 406 (67.2%) |
| 35 to 44 Years | 268 (27.2%) | 688 (69.7%) |
| 45 to 54 Years | 54 (7.2%) | 697 (92.4%) |
| 55 to 64 Years | 237 (32.9%) | 533 (74.0%) |
| 65 to 74 Years | 684 (100.0%) | 394 (57.6%) |
| 75 Years and over | 380 (100.0%) | 233 (61.3%) |
| Total | 1,989 (34.3%) | 4,359 (75.1%) |
Disability Status by Sex by Age in Glendora
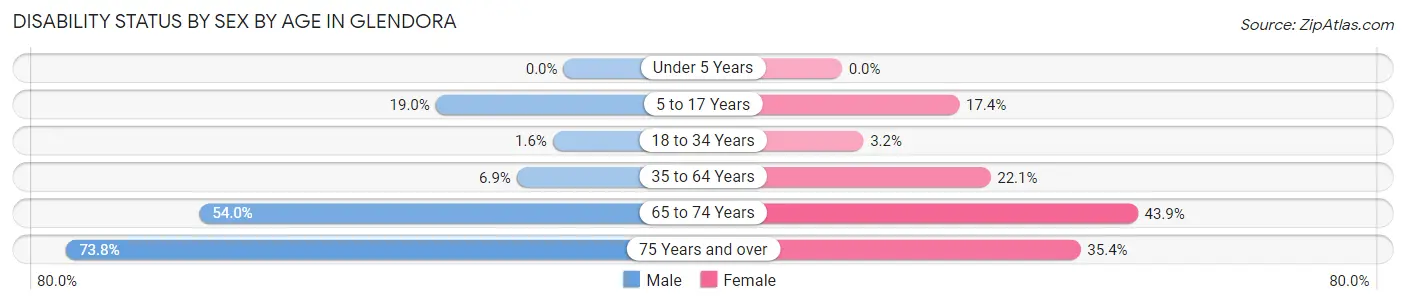
| Age Bracket | Male | Female |
| Under 5 Years | 0 (0.0%) | 0 (0.0%) |
| 5 to 17 Years | 77 (19.0%) | 74 (17.4%) |
| 18 to 34 Years | 10 (1.6%) | 20 (3.2%) |
| 35 to 64 Years | 80 (6.9%) | 288 (22.1%) |
| 65 to 74 Years | 174 (54.0%) | 159 (43.9%) |
| 75 Years and over | 93 (73.8%) | 90 (35.4%) |
Disability Class by Sex by Age in Glendora
Disability Class: Hearing Difficulty
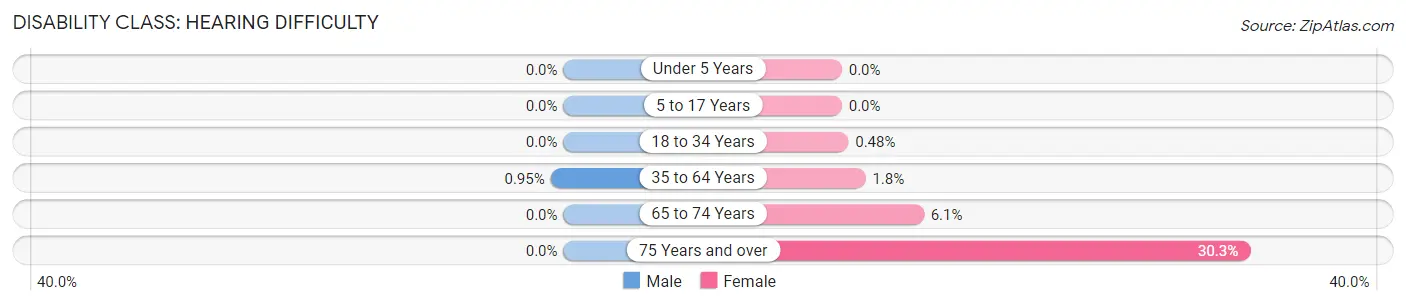
| Age Bracket | Male | Female |
| Under 5 Years | 0 (0.0%) | 0 (0.0%) |
| 5 to 17 Years | 0 (0.0%) | 0 (0.0%) |
| 18 to 34 Years | 0 (0.0%) | 3 (0.5%) |
| 35 to 64 Years | 11 (0.9%) | 23 (1.8%) |
| 65 to 74 Years | 0 (0.0%) | 22 (6.1%) |
| 75 Years and over | 0 (0.0%) | 77 (30.3%) |
Disability Class: Vision Difficulty
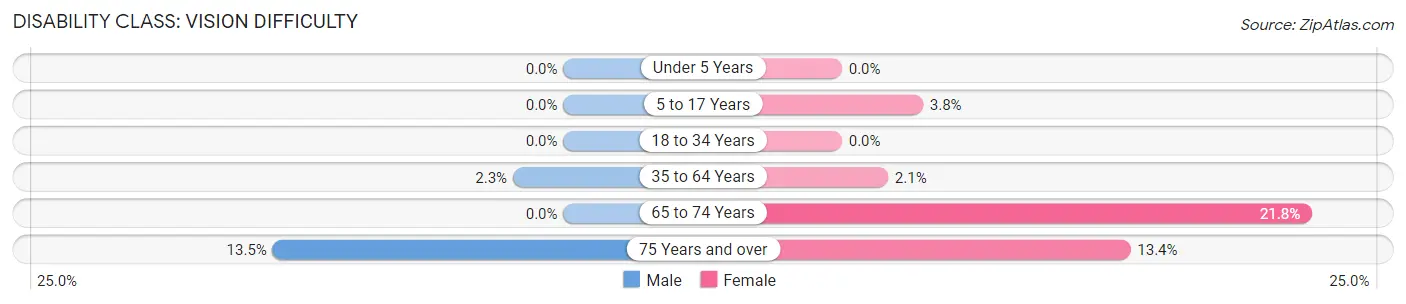
| Age Bracket | Male | Female |
| Under 5 Years | 0 (0.0%) | 0 (0.0%) |
| 5 to 17 Years | 0 (0.0%) | 16 (3.8%) |
| 18 to 34 Years | 0 (0.0%) | 0 (0.0%) |
| 35 to 64 Years | 27 (2.3%) | 28 (2.1%) |
| 65 to 74 Years | 0 (0.0%) | 79 (21.8%) |
| 75 Years and over | 17 (13.5%) | 34 (13.4%) |
Disability Class: Cognitive Difficulty
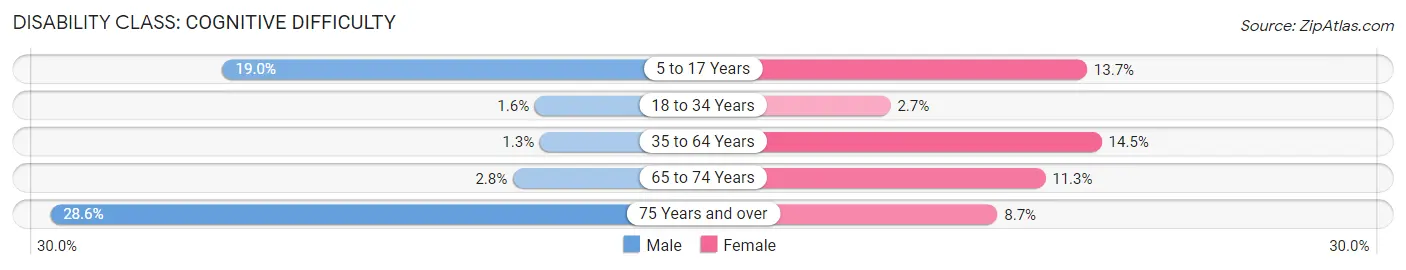
| Age Bracket | Male | Female |
| 5 to 17 Years | 77 (19.0%) | 58 (13.7%) |
| 18 to 34 Years | 10 (1.6%) | 17 (2.7%) |
| 35 to 64 Years | 15 (1.3%) | 189 (14.5%) |
| 65 to 74 Years | 9 (2.8%) | 41 (11.3%) |
| 75 Years and over | 36 (28.6%) | 22 (8.7%) |
Disability Class: Ambulatory Difficulty
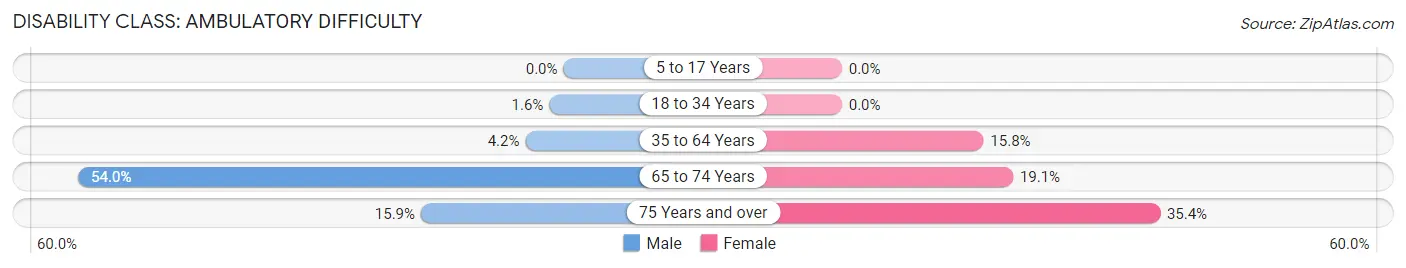
| Age Bracket | Male | Female |
| 5 to 17 Years | 0 (0.0%) | 0 (0.0%) |
| 18 to 34 Years | 10 (1.6%) | 0 (0.0%) |
| 35 to 64 Years | 49 (4.2%) | 206 (15.8%) |
| 65 to 74 Years | 174 (54.0%) | 69 (19.1%) |
| 75 Years and over | 20 (15.9%) | 90 (35.4%) |
Disability Class: Self-Care Difficulty
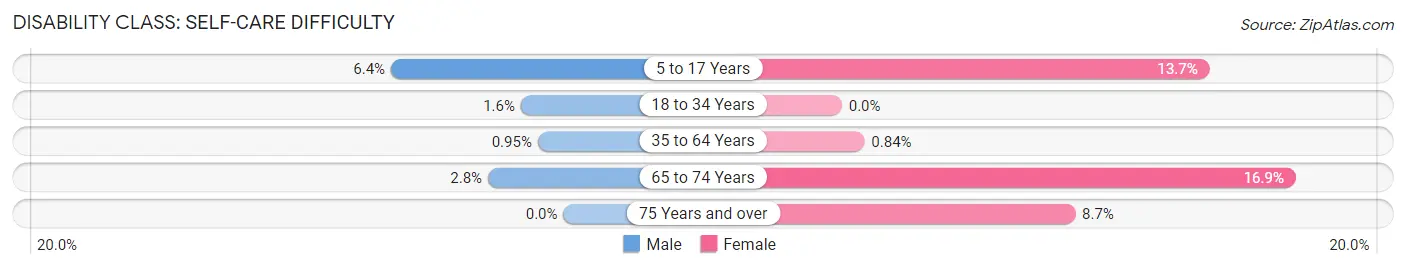
| Age Bracket | Male | Female |
| 5 to 17 Years | 26 (6.4%) | 58 (13.7%) |
| 18 to 34 Years | 10 (1.6%) | 0 (0.0%) |
| 35 to 64 Years | 11 (0.9%) | 11 (0.8%) |
| 65 to 74 Years | 9 (2.8%) | 61 (16.9%) |
| 75 Years and over | 0 (0.0%) | 22 (8.7%) |
Technology Access in Glendora
Computing Device Access in Glendora
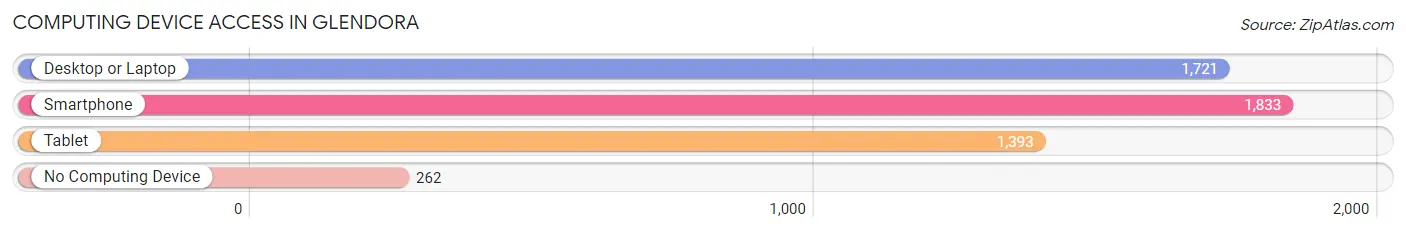
| Device Type | # Households | % Households |
| Desktop or Laptop | 1,721 | 75.0% |
| Smartphone | 1,833 | 79.8% |
| Tablet | 1,393 | 60.7% |
| No Computing Device | 262 | 11.4% |
| Total | 2,296 | 100.0% |
Internet Access in Glendora
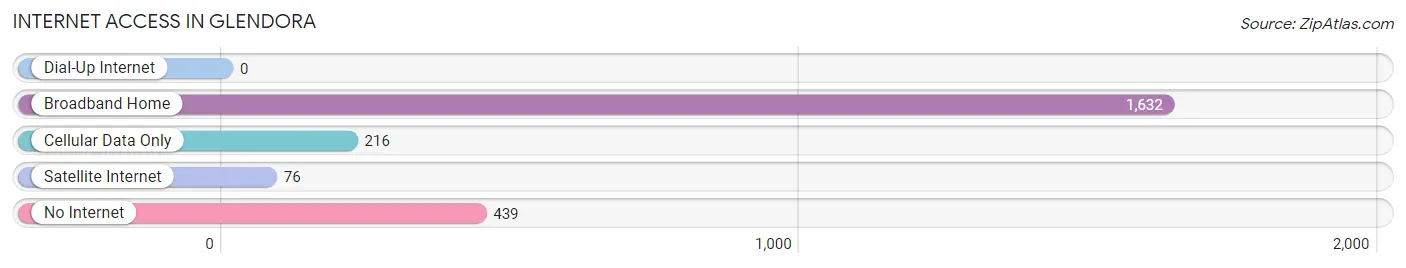
| Internet Type | # Households | % Households |
| Dial-Up Internet | 0 | 0.0% |
| Broadband Home | 1,632 | 71.1% |
| Cellular Data Only | 216 | 9.4% |
| Satellite Internet | 76 | 3.3% |
| No Internet | 439 | 19.1% |
| Total | 2,296 | 100.0% |
Glendora Summary
Glendora is a small borough located in Gloucester County, New Jersey. It is situated in the southwestern part of the state, approximately 10 miles from Philadelphia. The borough was incorporated in 1894 and has a population of approximately 4,000 people.
Geography
Glendora is located in the southwestern part of Gloucester County, New Jersey. It is situated on the border of Camden and Gloucester counties, and is approximately 10 miles from Philadelphia. The borough is bordered by the townships of Deptford, Washington, and Monroe. Glendora is located on the banks of the Big Timber Creek, which flows through the borough and into the Delaware River. The borough is also home to several small lakes, including Lake Tohickon, Lake Nockamixon, and Lake Lenape.
The borough has a total area of 1.3 square miles, all of which is land. Glendora is located in the humid subtropical climate zone, with hot, humid summers and cold, wet winters. The average temperature in the summer is around 80 degrees Fahrenheit, and the average temperature in the winter is around 40 degrees Fahrenheit.
Economy
Glendora’s economy is largely based on small businesses and services. The borough is home to a variety of small businesses, including restaurants, retail stores, and professional services. Glendora is also home to several industrial parks, which provide employment opportunities for local residents. The borough is also home to a number of small manufacturing companies, which produce a variety of products, including furniture, clothing, and electronics.
Demographics
As of the 2010 census, Glendora had a population of 4,000 people. The racial makeup of the borough was 94.2% White, 2.2% African American, 0.3% Native American, 0.7% Asian, 0.1% Pacific Islander, 1.2% from other races, and 1.4% from two or more races. Hispanic or Latino of any race were 3.2% of the population.
The median household income in Glendora was $60,000, and the median family income was $68,000. The per capita income for the borough was $25,000. About 8.2% of families and 10.2% of the population were below the poverty line, including 14.2% of those under age 18 and 6.2% of those age 65 or over.
Conclusion
Glendora is a small borough located in Gloucester County, New Jersey. It is situated in the southwestern part of the state, approximately 10 miles from Philadelphia. The borough was incorporated in 1894 and has a population of approximately 4,000 people. Glendora’s economy is largely based on small businesses and services, and the borough is home to a variety of small businesses, industrial parks, and manufacturing companies. The racial makeup of the borough is 94.2% White, 2.2% African American, 0.3% Native American, 0.7% Asian, 0.1% Pacific Islander, 1.2% from other races, and 1.4% from two or more races. The median household income in Glendora was $60,000, and the median family income was $68,000.
Common Questions
What is Per Capita Income in Glendora?
Per Capita income in Glendora is $35,584.
What is the Median Family Income in Glendora?
Median Family Income in Glendora is $103,716.
What is the Median Household income in Glendora?
Median Household Income in Glendora is $83,689.
What is Income or Wage Gap in Glendora?
Income or Wage Gap in Glendora is 38.4%.
Women in Glendora earn 61.6 cents for every dollar earned by a man.
What is Inequality or Gini Index in Glendora?
Inequality or Gini Index in Glendora is 0.41.
What is the Total Population of Glendora?
Total Population of Glendora is 5,817.
What is the Total Male Population of Glendora?
Total Male Population of Glendora is 2,748.
What is the Total Female Population of Glendora?
Total Female Population of Glendora is 3,069.
What is the Ratio of Males per 100 Females in Glendora?
There are 89.54 Males per 100 Females in Glendora.
What is the Ratio of Females per 100 Males in Glendora?
There are 111.68 Females per 100 Males in Glendora.
What is the Median Population Age in Glendora?
Median Population Age in Glendora is 39.2 Years.
What is the Average Family Size in Glendora
Average Family Size in Glendora is 3.3 People.
What is the Average Household Size in Glendora
Average Household Size in Glendora is 2.5 People.
How Large is the Labor Force in Glendora?
There are 3,358 People in the Labor Forcein in Glendora.
What is the Percentage of People in the Labor Force in Glendora?
67.1% of People are in the Labor Force in Glendora.
What is the Unemployment Rate in Glendora?
Unemployment Rate in Glendora is 13.7%.