Blackwood, NJ Map & Demographics
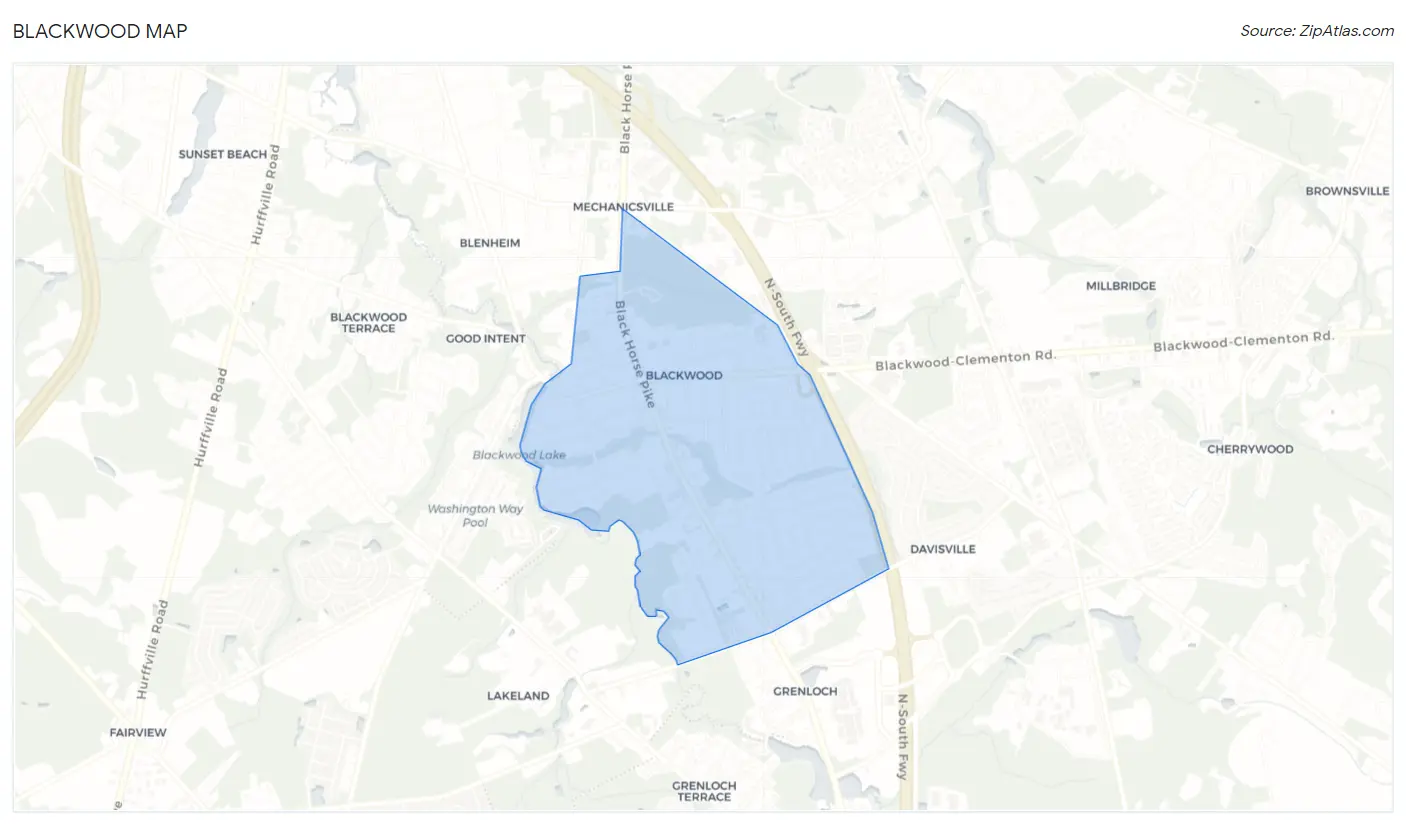
Blackwood Map
Blackwood Overview
$37,494
PER CAPITA INCOME
$83,716
AVG FAMILY INCOME
$82,741
AVG HOUSEHOLD INCOME
56.0%
WAGE / INCOME GAP [ % ]
44.0¢/ $1
WAGE / INCOME GAP [ $ ]
0.41
INEQUALITY / GINI INDEX
4,588
TOTAL POPULATION
2,230
MALE POPULATION
2,358
FEMALE POPULATION
94.57
MALES / 100 FEMALES
105.74
FEMALES / 100 MALES
37.5
MEDIAN AGE
3.2
AVG FAMILY SIZE
2.8
AVG HOUSEHOLD SIZE
2,530
LABOR FORCE [ PEOPLE ]
67.3%
PERCENT IN LABOR FORCE
6.6%
UNEMPLOYMENT RATE
Blackwood Zip Codes
Blackwood Area Codes
Income in Blackwood
Income Overview in Blackwood
Per Capita Income in Blackwood is $37,494, while median incomes of families and households are $83,716 and $82,741 respectively.
| Characteristic | Number | Measure |
| Per Capita Income | 4,588 | $37,494 |
| Median Family Income | 1,180 | $83,716 |
| Mean Family Income | 1,180 | $97,924 |
| Median Household Income | 1,618 | $82,741 |
| Mean Household Income | 1,618 | $99,063 |
| Income Deficit | 1,180 | $0 |
| Wage / Income Gap (%) | 4,588 | 56.02% |
| Wage / Income Gap ($) | 4,588 | 43.98¢ per $1 |
| Gini / Inequality Index | 4,588 | 0.41 |
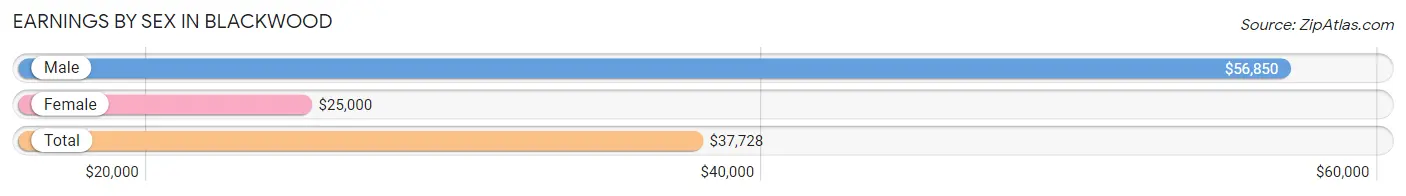
Earnings by Sex in Blackwood
Average Earnings in Blackwood are $37,728, $56,850 for men and $25,000 for women, a difference of 56.0%.
| Sex | Number | Average Earnings |
| Male | 1,309 (51.2%) | $56,850 |
| Female | 1,248 (48.8%) | $25,000 |
| Total | 2,557 (100.0%) | $37,728 |
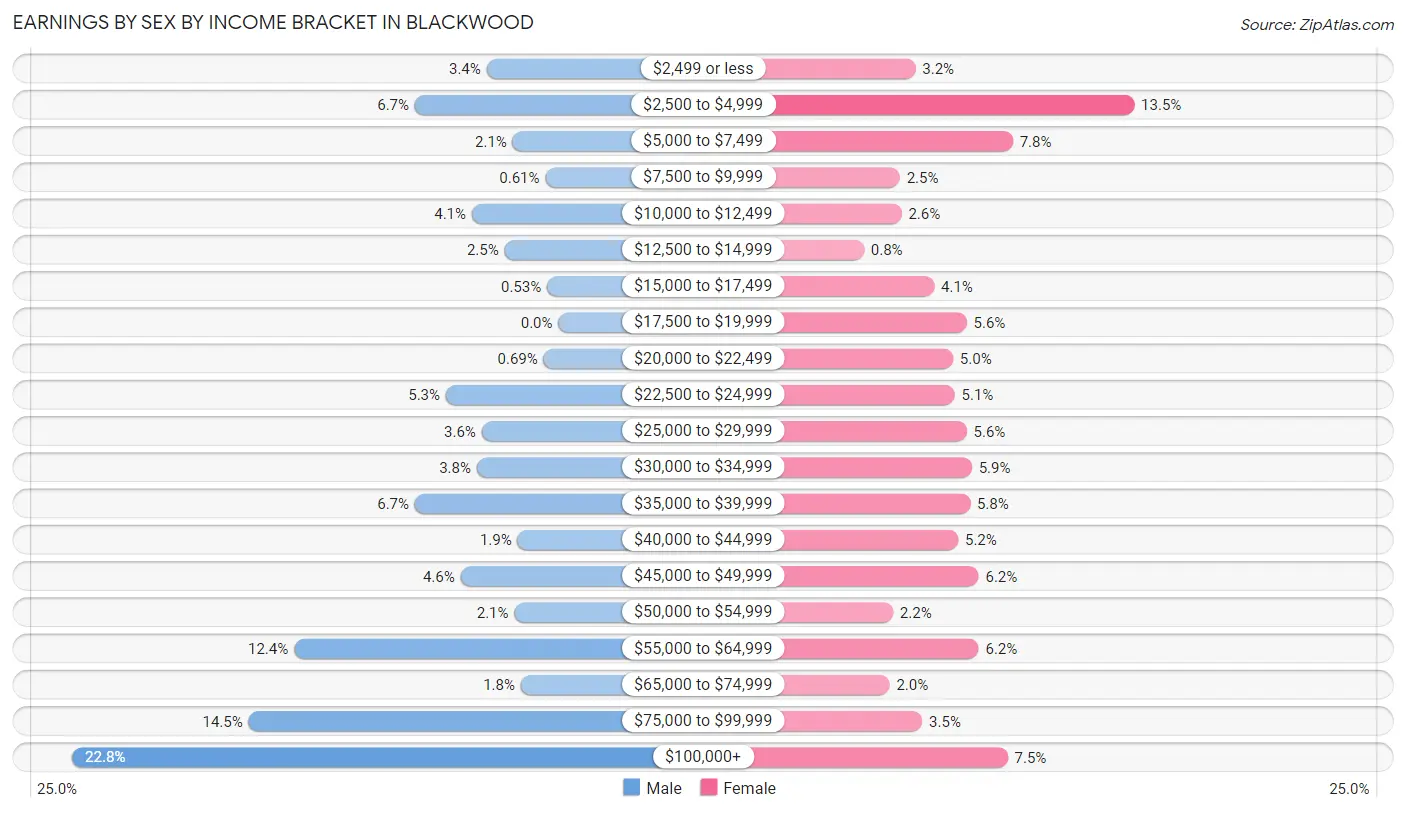
Earnings by Sex by Income Bracket in Blackwood
The most common earnings brackets in Blackwood are $100,000+ for men (298 | 22.8%) and $2,500 to $4,999 for women (168 | 13.5%).
| Income | Male | Female |
| $2,499 or less | 44 (3.4%) | 40 (3.2%) |
| $2,500 to $4,999 | 88 (6.7%) | 168 (13.5%) |
| $5,000 to $7,499 | 28 (2.1%) | 97 (7.8%) |
| $7,500 to $9,999 | 8 (0.6%) | 31 (2.5%) |
| $10,000 to $12,499 | 53 (4.1%) | 32 (2.6%) |
| $12,500 to $14,999 | 33 (2.5%) | 10 (0.8%) |
| $15,000 to $17,499 | 7 (0.5%) | 51 (4.1%) |
| $17,500 to $19,999 | 0 (0.0%) | 70 (5.6%) |
| $20,000 to $22,499 | 9 (0.7%) | 62 (5.0%) |
| $22,500 to $24,999 | 69 (5.3%) | 63 (5.1%) |
| $25,000 to $29,999 | 47 (3.6%) | 70 (5.6%) |
| $30,000 to $34,999 | 50 (3.8%) | 73 (5.9%) |
| $35,000 to $39,999 | 88 (6.7%) | 72 (5.8%) |
| $40,000 to $44,999 | 25 (1.9%) | 65 (5.2%) |
| $45,000 to $49,999 | 60 (4.6%) | 77 (6.2%) |
| $50,000 to $54,999 | 27 (2.1%) | 27 (2.2%) |
| $55,000 to $64,999 | 162 (12.4%) | 77 (6.2%) |
| $65,000 to $74,999 | 23 (1.8%) | 25 (2.0%) |
| $75,000 to $99,999 | 190 (14.5%) | 44 (3.5%) |
| $100,000+ | 298 (22.8%) | 94 (7.5%) |
| Total | 1,309 (100.0%) | 1,248 (100.0%) |
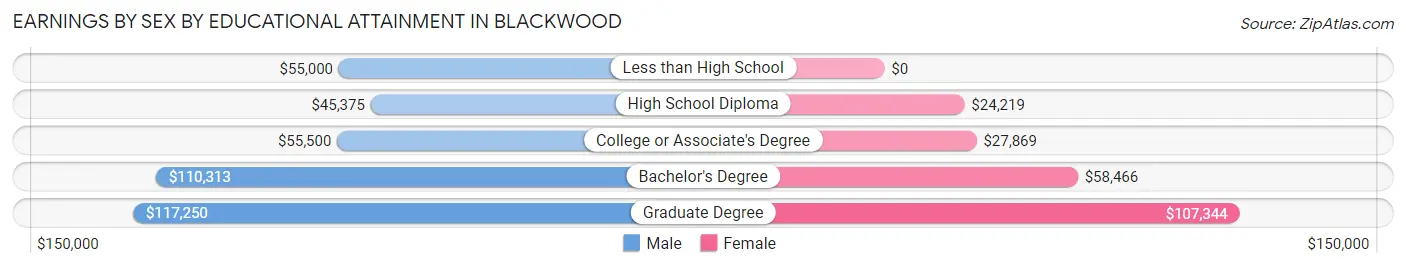
Earnings by Sex by Educational Attainment in Blackwood
Average earnings in Blackwood are $60,563 for men and $31,938 for women, a difference of 47.3%. Men with an educational attainment of graduate degree enjoy the highest average annual earnings of $117,250, while those with high school diploma education earn the least with $45,375. Women with an educational attainment of graduate degree earn the most with the average annual earnings of $107,344, while those with high school diploma education have the smallest earnings of $24,219.
| Educational Attainment | Male Income | Female Income |
| Less than High School | $55,000 | $0 |
| High School Diploma | $45,375 | $24,219 |
| College or Associate's Degree | $55,500 | $27,869 |
| Bachelor's Degree | $110,313 | $58,466 |
| Graduate Degree | $117,250 | $107,344 |
| Total | $60,563 | $31,938 |
Family Income in Blackwood
Family Income Brackets in Blackwood
According to the Blackwood family income data, there are 289 families falling into the $100,000 to $149,999 income range, which is the most common income bracket and makes up 24.5% of all families. Conversely, the $10,000 to $14,999 income bracket is the least frequent group with only 17 families (1.4%) belonging to this category.
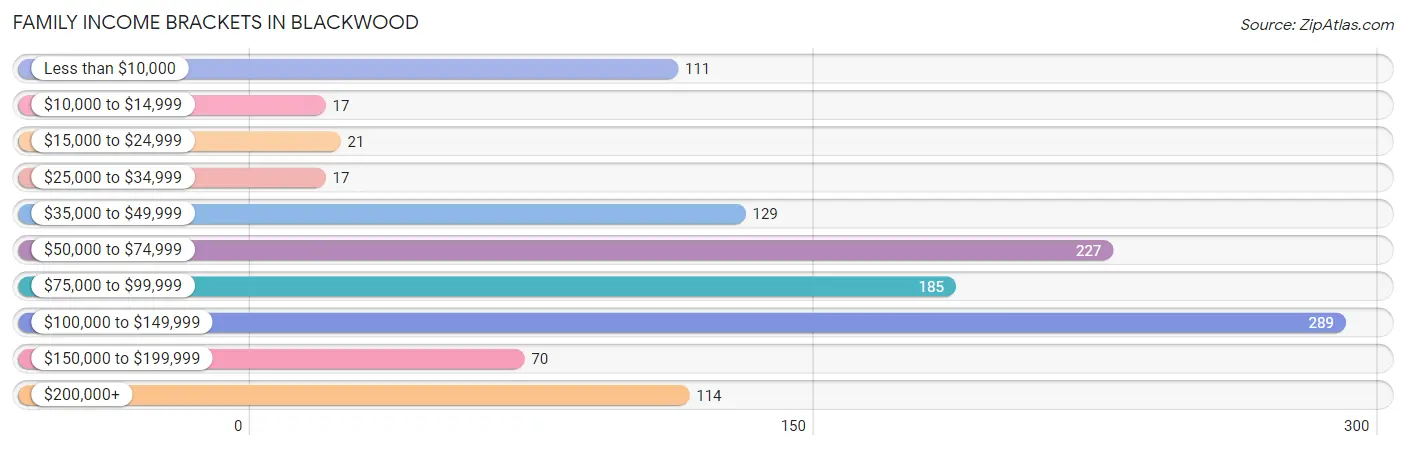
| Income Bracket | # Families | % Families |
| Less than $10,000 | 111 | 9.4% |
| $10,000 to $14,999 | 17 | 1.4% |
| $15,000 to $24,999 | 21 | 1.8% |
| $25,000 to $34,999 | 17 | 1.4% |
| $35,000 to $49,999 | 129 | 10.9% |
| $50,000 to $74,999 | 227 | 19.2% |
| $75,000 to $99,999 | 185 | 15.7% |
| $100,000 to $149,999 | 289 | 24.5% |
| $150,000 to $199,999 | 70 | 5.9% |
| $200,000+ | 114 | 9.7% |
Family Income by Famaliy Size in Blackwood
4-person families (167 | 14.1%) account for the highest median family income in Blackwood with $126,510 per family, while 2-person families (541 | 45.9%) have the highest median income of $36,354 per family member.
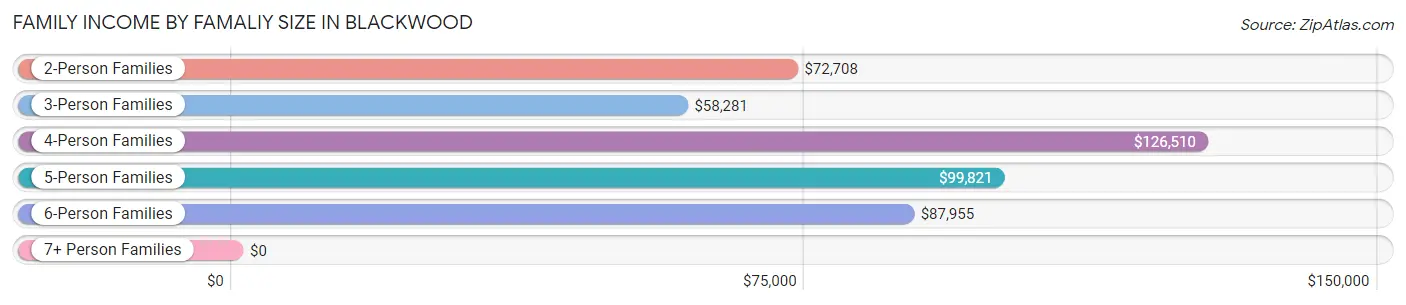
| Income Bracket | # Families | Median Income |
| 2-Person Families | 541 (45.9%) | $72,708 |
| 3-Person Families | 285 (24.1%) | $58,281 |
| 4-Person Families | 167 (14.1%) | $126,510 |
| 5-Person Families | 119 (10.1%) | $99,821 |
| 6-Person Families | 68 (5.8%) | $87,955 |
| 7+ Person Families | 0 (0.0%) | $0 |
| Total | 1,180 (100.0%) | $83,716 |
Family Income by Number of Earners in Blackwood
The median family income in Blackwood is $83,716, with families comprising 2 earners (409) having the highest median family income of $126,094, while families with no earners (136) have the lowest median family income of $43,750, accounting for 34.7% and 11.5% of families, respectively.
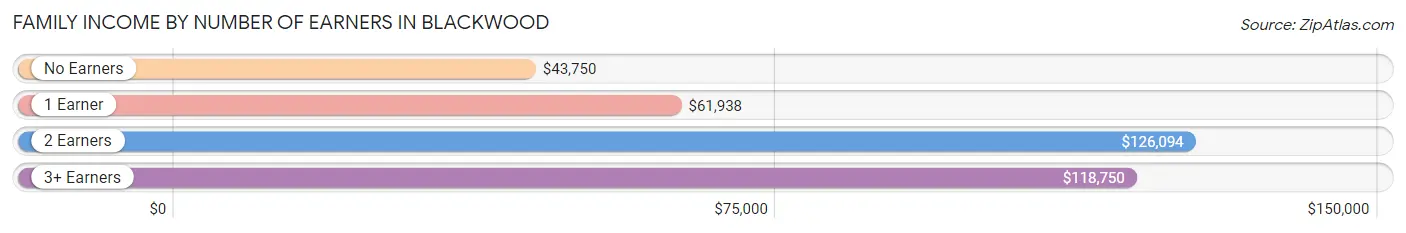
| Number of Earners | # Families | Median Income |
| No Earners | 136 (11.5%) | $43,750 |
| 1 Earner | 433 (36.7%) | $61,938 |
| 2 Earners | 409 (34.7%) | $126,094 |
| 3+ Earners | 202 (17.1%) | $118,750 |
| Total | 1,180 (100.0%) | $83,716 |
Household Income in Blackwood
Household Income Brackets in Blackwood
With 377 households falling in the category, the $100,000 to $149,999 income range is the most frequent in Blackwood, accounting for 23.3% of all households. In contrast, only 36 households (2.2%) fall into the $10,000 to $14,999 income bracket, making it the least populous group.
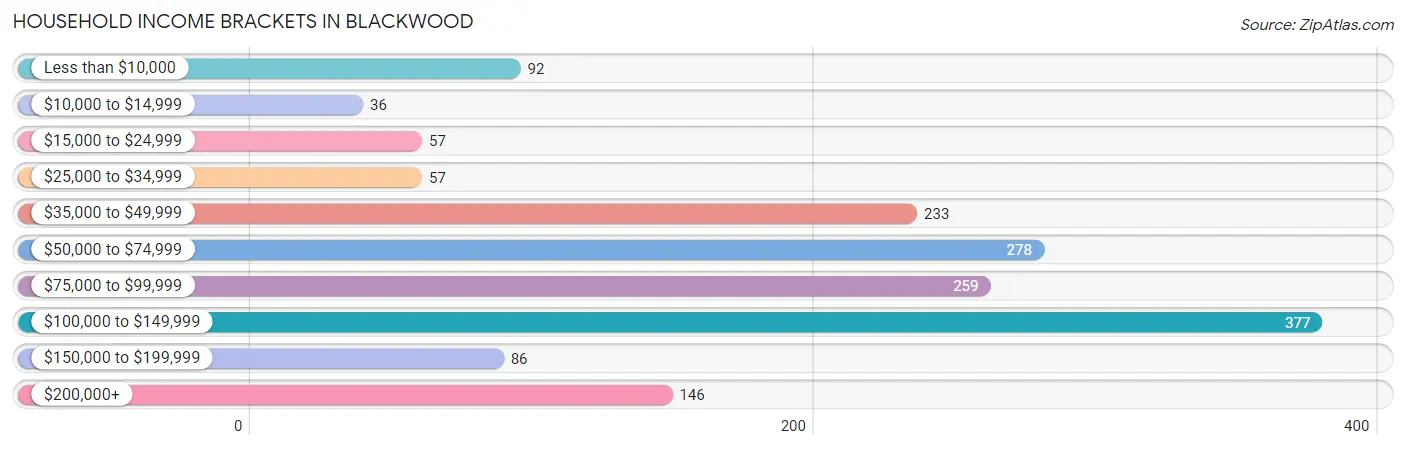
| Income Bracket | # Households | % Households |
| Less than $10,000 | 92 | 5.7% |
| $10,000 to $14,999 | 36 | 2.2% |
| $15,000 to $24,999 | 57 | 3.5% |
| $25,000 to $34,999 | 57 | 3.5% |
| $35,000 to $49,999 | 233 | 14.4% |
| $50,000 to $74,999 | 278 | 17.2% |
| $75,000 to $99,999 | 259 | 16.0% |
| $100,000 to $149,999 | 377 | 23.3% |
| $150,000 to $199,999 | 86 | 5.3% |
| $200,000+ | 146 | 9.0% |
Household Income by Householder Age in Blackwood
The median household income in Blackwood is $82,741, with the highest median household income of $116,691 found in the 15 to 24 years age bracket for the primary householder. A total of 64 households (4.0%) fall into this category. Meanwhile, the 65+ years age bracket for the primary householder has the lowest median household income of $57,813, with 446 households (27.6%) in this group.
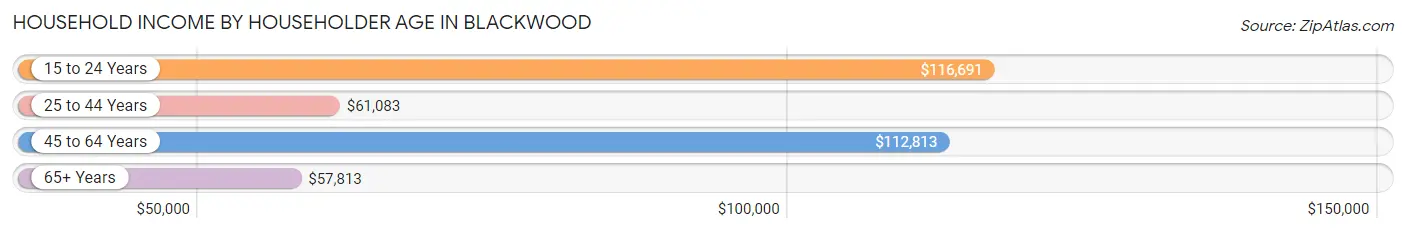
| Income Bracket | # Households | Median Income |
| 15 to 24 Years | 64 (4.0%) | $116,691 |
| 25 to 44 Years | 506 (31.3%) | $61,083 |
| 45 to 64 Years | 602 (37.2%) | $112,813 |
| 65+ Years | 446 (27.6%) | $57,813 |
| Total | 1,618 (100.0%) | $82,741 |
Poverty in Blackwood
Income Below Poverty by Sex and Age in Blackwood
With 12.3% poverty level for males and 12.9% for females among the residents of Blackwood, 6 to 11 year old males and 35 to 44 year old females are the most vulnerable to poverty, with 86 males (57.7%) and 72 females (35.6%) in their respective age groups living below the poverty level.
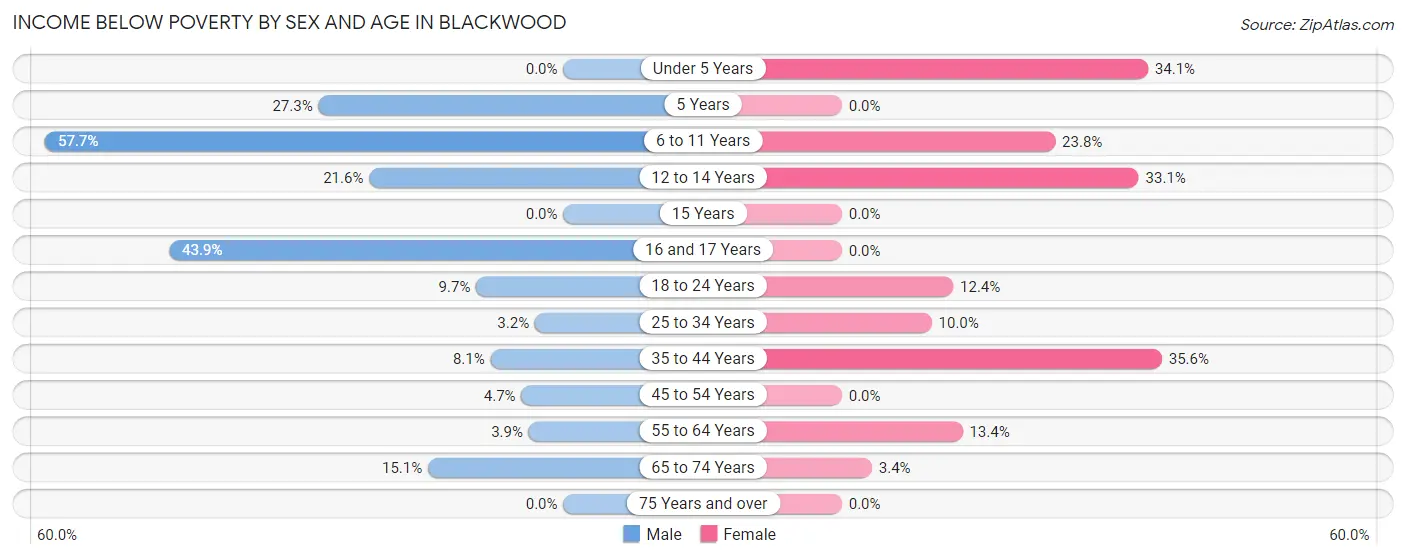
| Age Bracket | Male | Female |
| Under 5 Years | 0 (0.0%) | 30 (34.1%) |
| 5 Years | 9 (27.3%) | 0 (0.0%) |
| 6 to 11 Years | 86 (57.7%) | 43 (23.8%) |
| 12 to 14 Years | 8 (21.6%) | 40 (33.1%) |
| 15 Years | 0 (0.0%) | 0 (0.0%) |
| 16 and 17 Years | 54 (43.9%) | 0 (0.0%) |
| 18 to 24 Years | 16 (9.7%) | 32 (12.4%) |
| 25 to 34 Years | 11 (3.2%) | 36 (10.0%) |
| 35 to 44 Years | 27 (8.1%) | 72 (35.6%) |
| 45 to 54 Years | 12 (4.7%) | 0 (0.0%) |
| 55 to 64 Years | 12 (3.8%) | 43 (13.4%) |
| 65 to 74 Years | 33 (15.1%) | 7 (3.4%) |
| 75 Years and over | 0 (0.0%) | 0 (0.0%) |
| Total | 268 (12.3%) | 303 (12.9%) |
Income Above Poverty by Sex and Age in Blackwood
According to the poverty statistics in Blackwood, males aged under 5 years and females aged 5 years are the age groups that are most secure financially, with 100.0% of males and 100.0% of females in these age groups living above the poverty line.
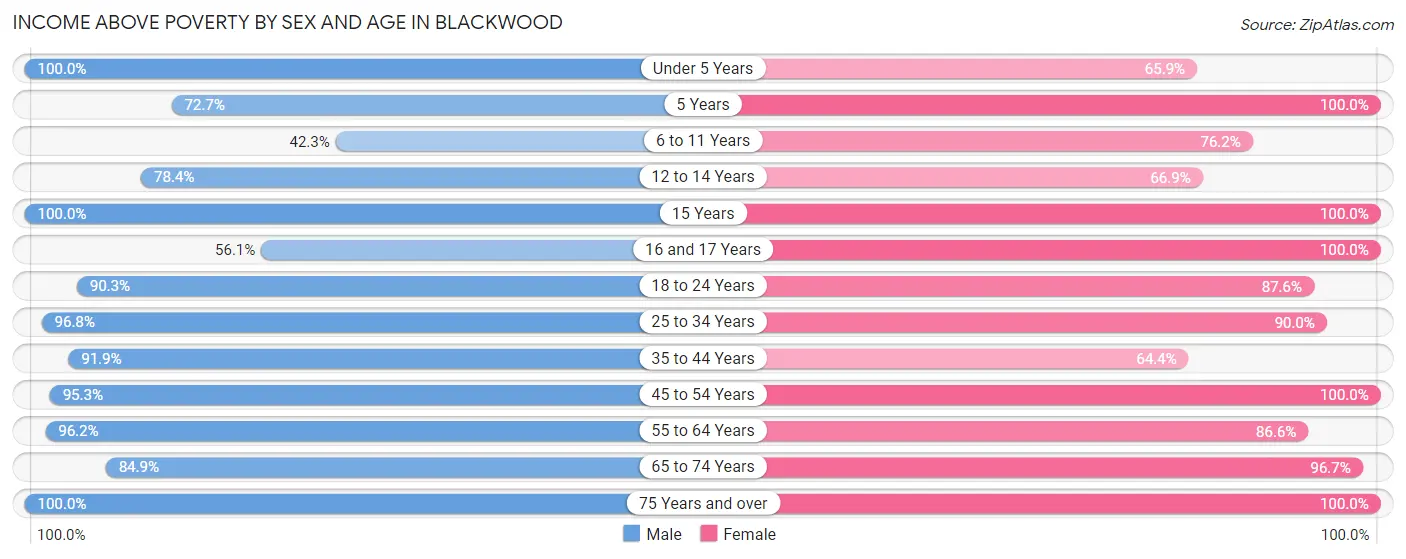
| Age Bracket | Male | Female |
| Under 5 Years | 119 (100.0%) | 58 (65.9%) |
| 5 Years | 24 (72.7%) | 22 (100.0%) |
| 6 to 11 Years | 63 (42.3%) | 138 (76.2%) |
| 12 to 14 Years | 29 (78.4%) | 81 (66.9%) |
| 15 Years | 14 (100.0%) | 20 (100.0%) |
| 16 and 17 Years | 69 (56.1%) | 56 (100.0%) |
| 18 to 24 Years | 149 (90.3%) | 226 (87.6%) |
| 25 to 34 Years | 337 (96.8%) | 324 (90.0%) |
| 35 to 44 Years | 306 (91.9%) | 130 (64.4%) |
| 45 to 54 Years | 245 (95.3%) | 331 (100.0%) |
| 55 to 64 Years | 300 (96.2%) | 277 (86.6%) |
| 65 to 74 Years | 186 (84.9%) | 202 (96.7%) |
| 75 Years and over | 76 (100.0%) | 190 (100.0%) |
| Total | 1,917 (87.7%) | 2,055 (87.2%) |
Income Below Poverty Among Married-Couple Families in Blackwood
The poverty statistics for married-couple families in Blackwood show that 6.1% or 50 of the total 824 families live below the poverty line. Families with 3 or 4 children have the highest poverty rate of 23.6%, comprising of 17 families. On the other hand, families with 1 or 2 children have the lowest poverty rate of 0.0%, which includes 0 families.
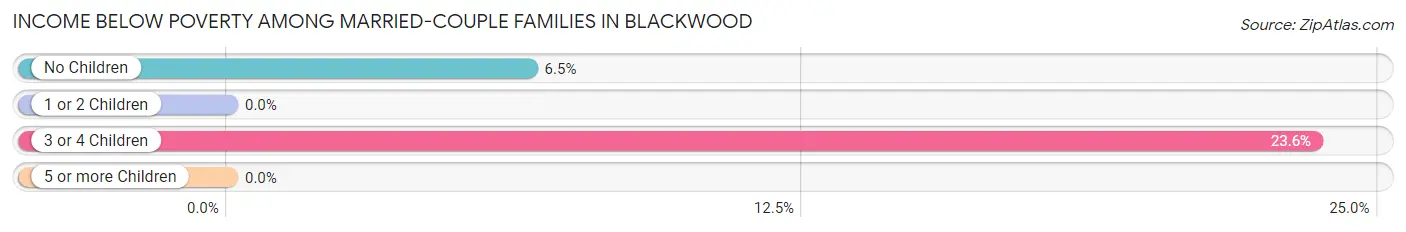
| Children | Above Poverty | Below Poverty |
| No Children | 473 (93.5%) | 33 (6.5%) |
| 1 or 2 Children | 246 (100.0%) | 0 (0.0%) |
| 3 or 4 Children | 55 (76.4%) | 17 (23.6%) |
| 5 or more Children | 0 (0.0%) | 0 (0.0%) |
| Total | 774 (93.9%) | 50 (6.1%) |
Income Below Poverty Among Single-Parent Households in Blackwood
According to the poverty data in Blackwood, 8.0% or 8 single-father households and 35.5% or 91 single-mother households are living below the poverty line. Among single-father households, those with 1 or 2 children have the highest poverty rate, with 8 households (27.6%) experiencing poverty. Likewise, among single-mother households, those with 1 or 2 children have the highest poverty rate, with 91 households (62.3%) falling below the poverty line.
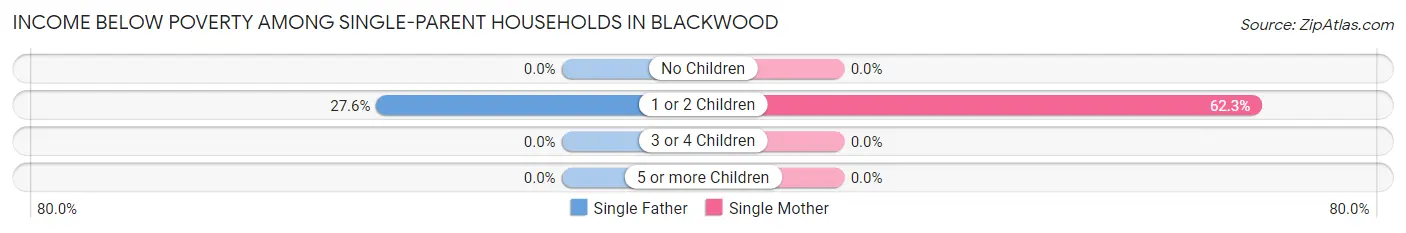
| Children | Single Father | Single Mother |
| No Children | 0 (0.0%) | 0 (0.0%) |
| 1 or 2 Children | 8 (27.6%) | 91 (62.3%) |
| 3 or 4 Children | 0 (0.0%) | 0 (0.0%) |
| 5 or more Children | 0 (0.0%) | 0 (0.0%) |
| Total | 8 (8.0%) | 91 (35.5%) |
Income Below Poverty Among Married-Couple vs Single-Parent Households in Blackwood
The poverty data for Blackwood shows that 50 of the married-couple family households (6.1%) and 99 of the single-parent households (27.8%) are living below the poverty level. Within the married-couple family households, those with 3 or 4 children have the highest poverty rate, with 17 households (23.6%) falling below the poverty line. Among the single-parent households, those with 1 or 2 children have the highest poverty rate, with 99 household (56.6%) living below poverty.
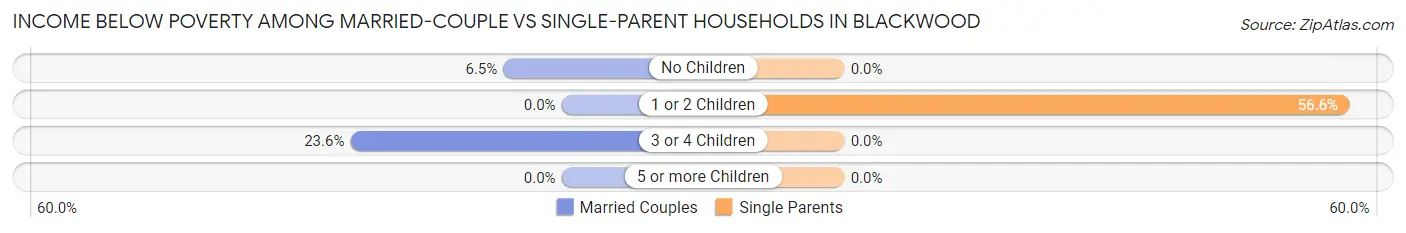
| Children | Married-Couple Families | Single-Parent Households |
| No Children | 33 (6.5%) | 0 (0.0%) |
| 1 or 2 Children | 0 (0.0%) | 99 (56.6%) |
| 3 or 4 Children | 17 (23.6%) | 0 (0.0%) |
| 5 or more Children | 0 (0.0%) | 0 (0.0%) |
| Total | 50 (6.1%) | 99 (27.8%) |
Race in Blackwood
The most populous races in Blackwood are White / Caucasian (3,737 | 81.5%), Hispanic or Latino (480 | 10.5%), and Black / African American (329 | 7.2%).
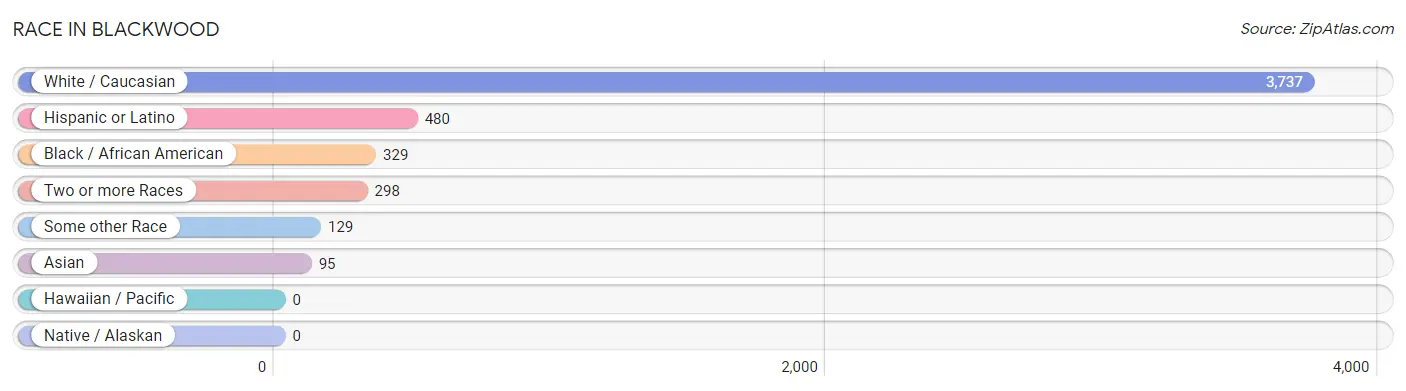
| Race | # Population | % Population |
| Asian | 95 | 2.1% |
| Black / African American | 329 | 7.2% |
| Hawaiian / Pacific | 0 | 0.0% |
| Hispanic or Latino | 480 | 10.5% |
| Native / Alaskan | 0 | 0.0% |
| White / Caucasian | 3,737 | 81.5% |
| Two or more Races | 298 | 6.5% |
| Some other Race | 129 | 2.8% |
| Total | 4,588 | 100.0% |
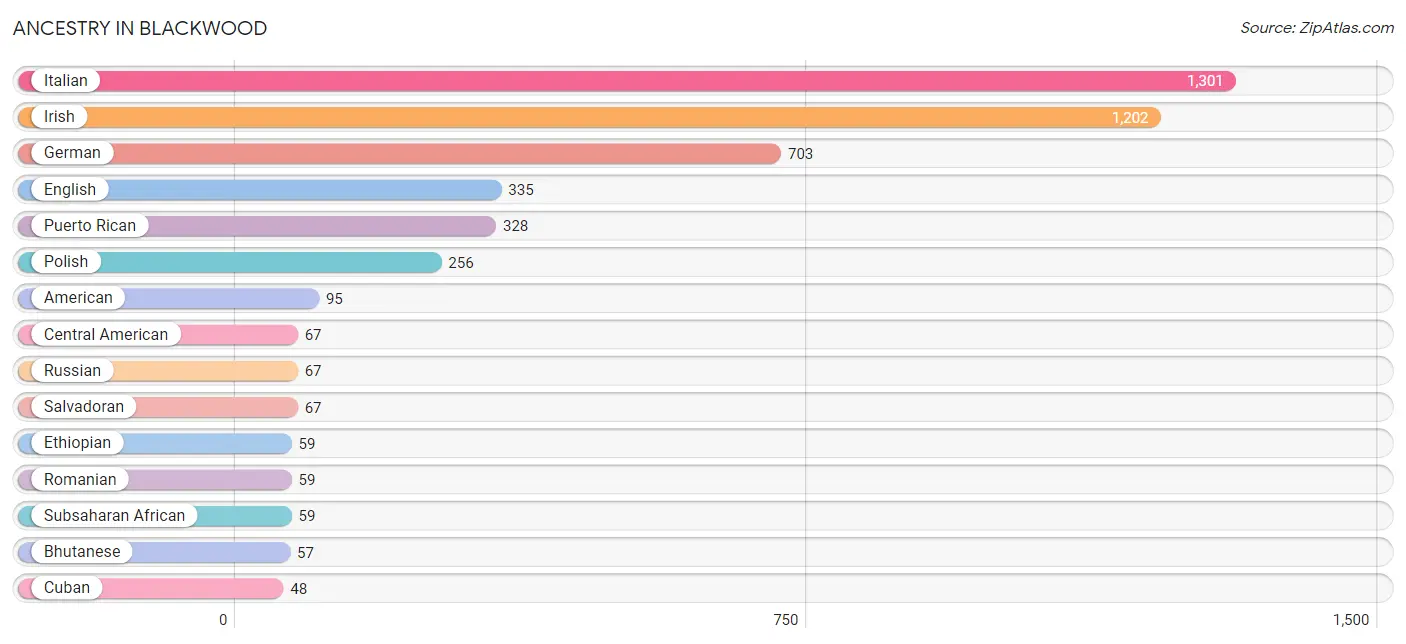
Ancestry in Blackwood
The most populous ancestries reported in Blackwood are Italian (1,301 | 28.4%), Irish (1,202 | 26.2%), German (703 | 15.3%), English (335 | 7.3%), and Puerto Rican (328 | 7.1%), together accounting for 84.3% of all Blackwood residents.
| Ancestry | # Population | % Population |
| American | 95 | 2.1% |
| Bhutanese | 57 | 1.2% |
| Brazilian | 9 | 0.2% |
| British | 8 | 0.2% |
| Canadian | 22 | 0.5% |
| Central American | 67 | 1.5% |
| Cherokee | 24 | 0.5% |
| Croatian | 17 | 0.4% |
| Cuban | 48 | 1.1% |
| Czech | 7 | 0.2% |
| Dominican | 19 | 0.4% |
| Dutch | 47 | 1.0% |
| English | 335 | 7.3% |
| Ethiopian | 59 | 1.3% |
| French | 43 | 0.9% |
| French Canadian | 11 | 0.2% |
| German | 703 | 15.3% |
| Hungarian | 9 | 0.2% |
| Irish | 1,202 | 26.2% |
| Italian | 1,301 | 28.4% |
| Korean | 32 | 0.7% |
| Mexican | 11 | 0.2% |
| Native Hawaiian | 7 | 0.2% |
| Northern European | 9 | 0.2% |
| Norwegian | 7 | 0.2% |
| Polish | 256 | 5.6% |
| Portuguese | 20 | 0.4% |
| Puerto Rican | 328 | 7.1% |
| Romanian | 59 | 1.3% |
| Russian | 67 | 1.5% |
| Salvadoran | 67 | 1.5% |
| Scandinavian | 7 | 0.2% |
| Scotch-Irish | 10 | 0.2% |
| Scottish | 16 | 0.4% |
| Slovak | 7 | 0.2% |
| Spanish | 7 | 0.2% |
| Subsaharan African | 59 | 1.3% |
| Thai | 33 | 0.7% |
| Turkish | 29 | 0.6% |
| Ukrainian | 31 | 0.7% |
| Welsh | 22 | 0.5% | View All 41 Rows |
Immigrants in Blackwood
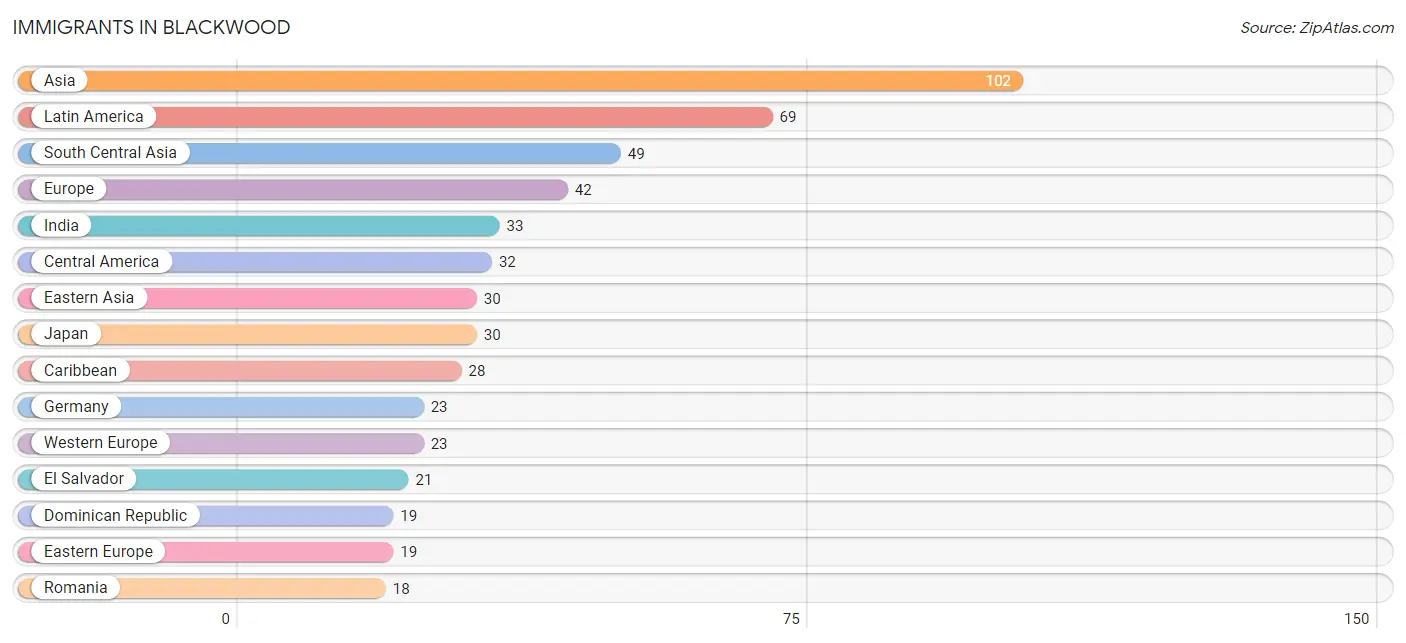
The most numerous immigrant groups reported in Blackwood came from Asia (102 | 2.2%), Latin America (69 | 1.5%), South Central Asia (49 | 1.1%), Europe (42 | 0.9%), and India (33 | 0.7%), together accounting for 6.4% of all Blackwood residents.
| Immigration Origin | # Population | % Population |
| Asia | 102 | 2.2% |
| Bangladesh | 16 | 0.4% |
| Brazil | 9 | 0.2% |
| Caribbean | 28 | 0.6% |
| Central America | 32 | 0.7% |
| Cuba | 9 | 0.2% |
| Dominican Republic | 19 | 0.4% |
| Eastern Asia | 30 | 0.6% |
| Eastern Europe | 19 | 0.4% |
| El Salvador | 21 | 0.5% |
| Europe | 42 | 0.9% |
| Germany | 23 | 0.5% |
| India | 33 | 0.7% |
| Japan | 30 | 0.6% |
| Latin America | 69 | 1.5% |
| Mexico | 11 | 0.2% |
| Philippines | 16 | 0.4% |
| Poland | 1 | 0.0% |
| Romania | 18 | 0.4% |
| South America | 9 | 0.2% |
| South Central Asia | 49 | 1.1% |
| South Eastern Asia | 16 | 0.4% |
| Turkey | 7 | 0.2% |
| Western Asia | 7 | 0.2% |
| Western Europe | 23 | 0.5% | View All 25 Rows |
Sex and Age in Blackwood
Sex and Age in Blackwood
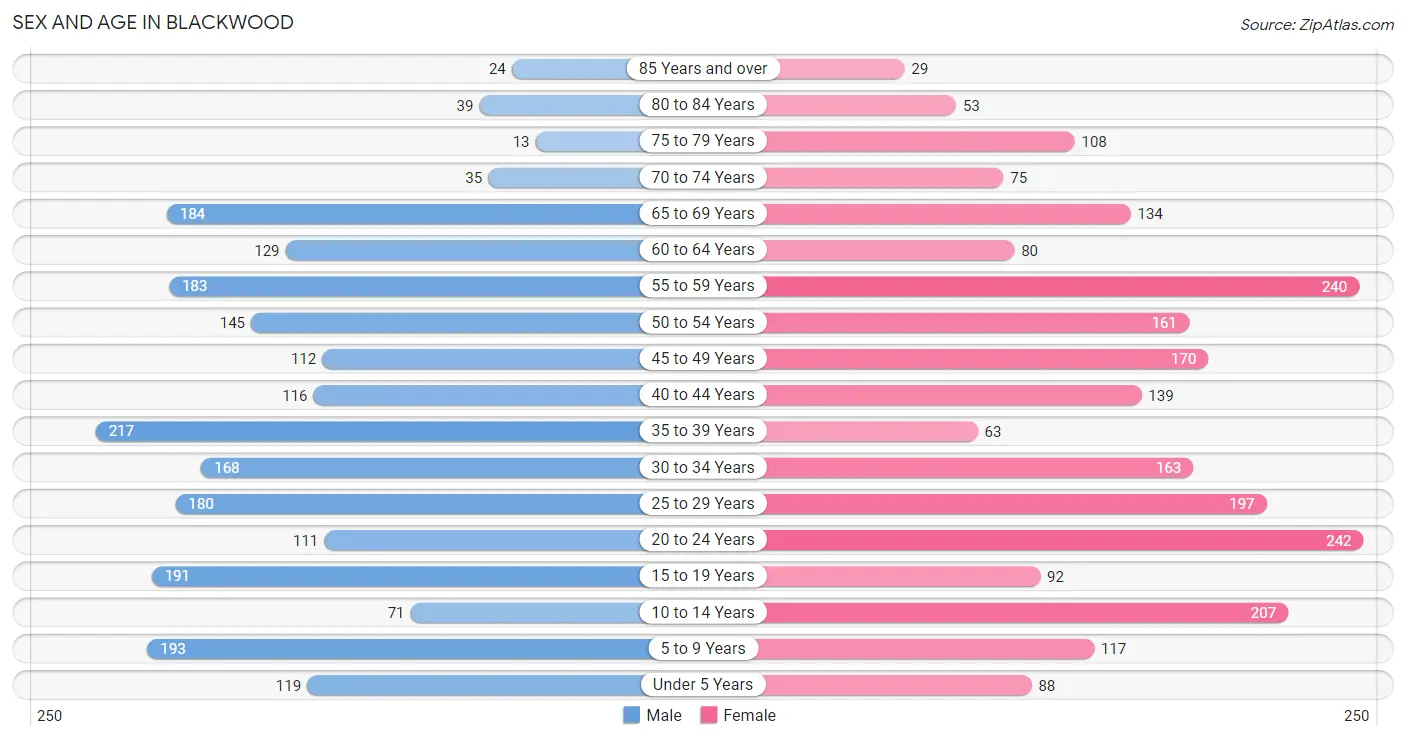
The most populous age groups in Blackwood are 35 to 39 Years (217 | 9.7%) for men and 20 to 24 Years (242 | 10.3%) for women.
| Age Bracket | Male | Female |
| Under 5 Years | 119 (5.3%) | 88 (3.7%) |
| 5 to 9 Years | 193 (8.6%) | 117 (5.0%) |
| 10 to 14 Years | 71 (3.2%) | 207 (8.8%) |
| 15 to 19 Years | 191 (8.6%) | 92 (3.9%) |
| 20 to 24 Years | 111 (5.0%) | 242 (10.3%) |
| 25 to 29 Years | 180 (8.1%) | 197 (8.4%) |
| 30 to 34 Years | 168 (7.5%) | 163 (6.9%) |
| 35 to 39 Years | 217 (9.7%) | 63 (2.7%) |
| 40 to 44 Years | 116 (5.2%) | 139 (5.9%) |
| 45 to 49 Years | 112 (5.0%) | 170 (7.2%) |
| 50 to 54 Years | 145 (6.5%) | 161 (6.8%) |
| 55 to 59 Years | 183 (8.2%) | 240 (10.2%) |
| 60 to 64 Years | 129 (5.8%) | 80 (3.4%) |
| 65 to 69 Years | 184 (8.3%) | 134 (5.7%) |
| 70 to 74 Years | 35 (1.6%) | 75 (3.2%) |
| 75 to 79 Years | 13 (0.6%) | 108 (4.6%) |
| 80 to 84 Years | 39 (1.8%) | 53 (2.2%) |
| 85 Years and over | 24 (1.1%) | 29 (1.2%) |
| Total | 2,230 (100.0%) | 2,358 (100.0%) |
Families and Households in Blackwood
Median Family Size in Blackwood
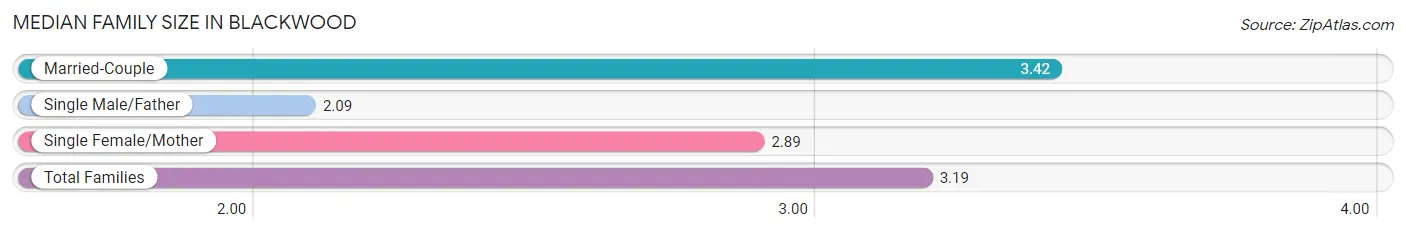
The median family size in Blackwood is 3.19 persons per family, with married-couple families (824 | 69.8%) accounting for the largest median family size of 3.42 persons per family. On the other hand, single male/father families (100 | 8.5%) represent the smallest median family size with 2.09 persons per family.
| Family Type | # Families | Family Size |
| Married-Couple | 824 (69.8%) | 3.42 |
| Single Male/Father | 100 (8.5%) | 2.09 |
| Single Female/Mother | 256 (21.7%) | 2.89 |
| Total Families | 1,180 (100.0%) | 3.19 |
Median Household Size in Blackwood
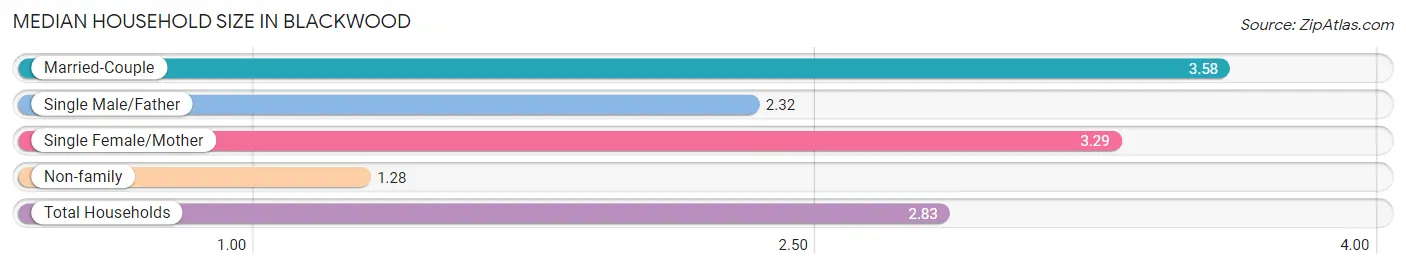
The median household size in Blackwood is 2.83 persons per household, with married-couple households (824 | 50.9%) accounting for the largest median household size of 3.58 persons per household. non-family households (438 | 27.1%) represent the smallest median household size with 1.28 persons per household.
| Household Type | # Households | Household Size |
| Married-Couple | 824 (50.9%) | 3.58 |
| Single Male/Father | 100 (6.2%) | 2.32 |
| Single Female/Mother | 256 (15.8%) | 3.29 |
| Non-family | 438 (27.1%) | 1.28 |
| Total Households | 1,618 (100.0%) | 2.83 |
Household Size by Marriage Status in Blackwood
Out of a total of 1,618 households in Blackwood, 1,180 (72.9%) are family households, while 438 (27.1%) are nonfamily households. The most numerous type of family households are 2-person households, comprising 446, and the most common type of nonfamily households are 1-person households, comprising 301.
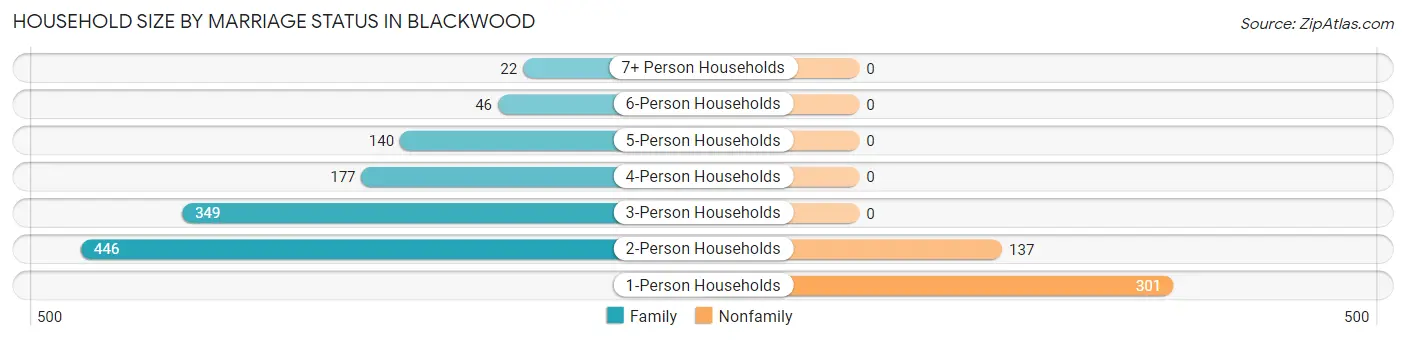
| Household Size | Family Households | Nonfamily Households |
| 1-Person Households | - | 301 (18.6%) |
| 2-Person Households | 446 (27.6%) | 137 (8.5%) |
| 3-Person Households | 349 (21.6%) | 0 (0.0%) |
| 4-Person Households | 177 (10.9%) | 0 (0.0%) |
| 5-Person Households | 140 (8.6%) | 0 (0.0%) |
| 6-Person Households | 46 (2.8%) | 0 (0.0%) |
| 7+ Person Households | 22 (1.4%) | 0 (0.0%) |
| Total | 1,180 (72.9%) | 438 (27.1%) |
Female Fertility in Blackwood
Fertility by Age in Blackwood
Average fertility rate in Blackwood is 36.0 births per 1,000 women. Women in the age bracket of 20 to 34 years have the highest fertility rate with 48.0 births per 1,000 women. Women in the age bracket of 20 to 34 years acount for 74.4% of all women with births.
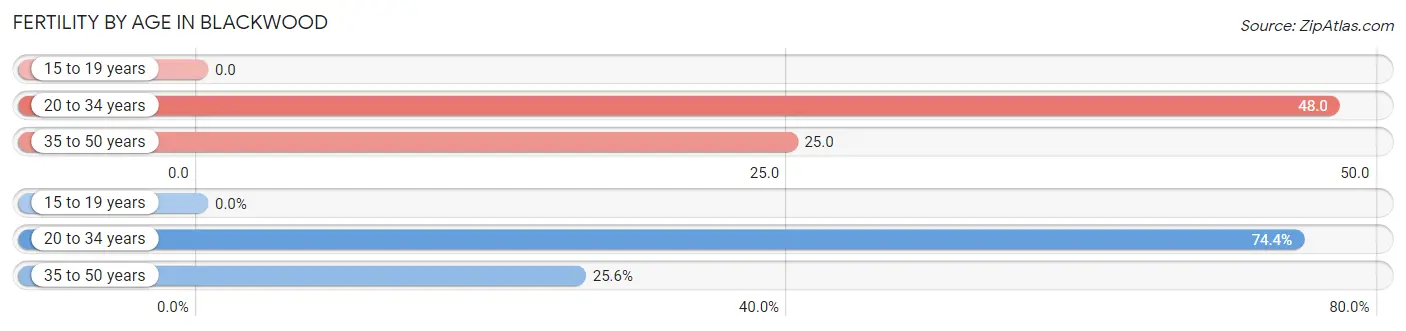
| Age Bracket | Women with Births | Births / 1,000 Women |
| 15 to 19 years | 0 (0.0%) | 0.0 |
| 20 to 34 years | 29 (74.4%) | 48.0 |
| 35 to 50 years | 10 (25.6%) | 25.0 |
| Total | 39 (100.0%) | 36.0 |
Fertility by Age by Marriage Status in Blackwood
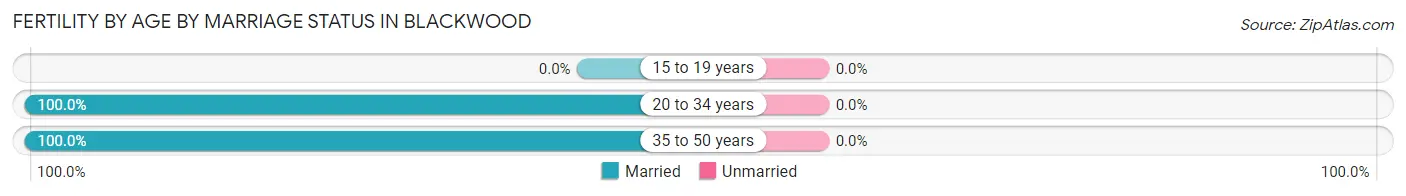
| Age Bracket | Married | Unmarried |
| 15 to 19 years | 0 (0.0%) | 0 (0.0%) |
| 20 to 34 years | 29 (100.0%) | 0 (0.0%) |
| 35 to 50 years | 10 (100.0%) | 0 (0.0%) |
| Total | 39 (100.0%) | 0 (0.0%) |
Fertility by Education in Blackwood
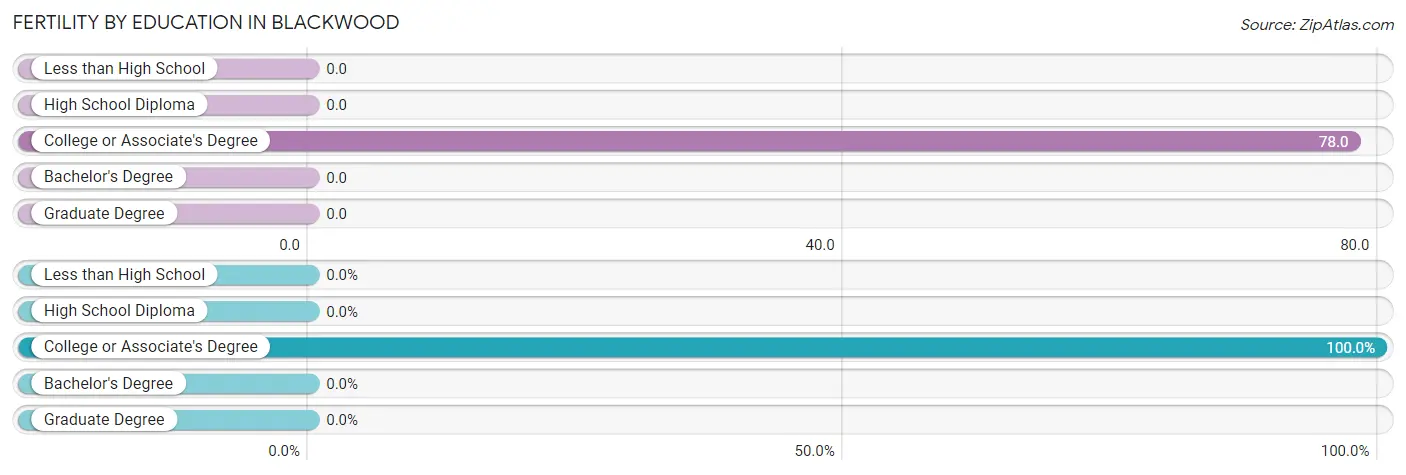
| Educational Attainment | Women with Births | Births / 1,000 Women |
| Less than High School | 0 (0.0%) | 0.0 |
| High School Diploma | 0 (0.0%) | 0.0 |
| College or Associate's Degree | 39 (100.0%) | 78.0 |
| Bachelor's Degree | 0 (0.0%) | 0.0 |
| Graduate Degree | 0 (0.0%) | 0.0 |
| Total | 39 (100.0%) | 36.0 |
Fertility by Education by Marriage Status in Blackwood
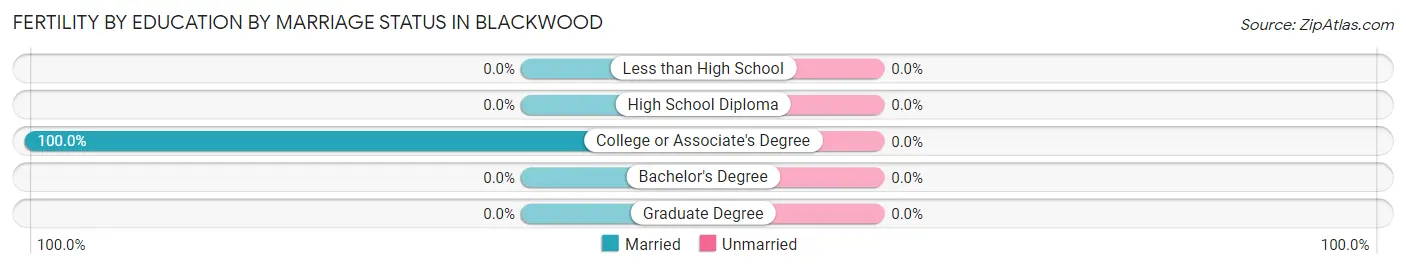
| Educational Attainment | Married | Unmarried |
| Less than High School | 0 (0.0%) | 0 (0.0%) |
| High School Diploma | 0 (0.0%) | 0 (0.0%) |
| College or Associate's Degree | 39 (100.0%) | 0 (0.0%) |
| Bachelor's Degree | 0 (0.0%) | 0 (0.0%) |
| Graduate Degree | 0 (0.0%) | 0 (0.0%) |
| Total | 39 (100.0%) | 0 (0.0%) |
Employment Characteristics in Blackwood
Employment by Class of Employer in Blackwood
Among the 2,308 employed individuals in Blackwood, private company employees (1,778 | 77.0%), local government employees (189 | 8.2%), and not-for-profit organizations (106 | 4.6%) make up the most common classes of employment.
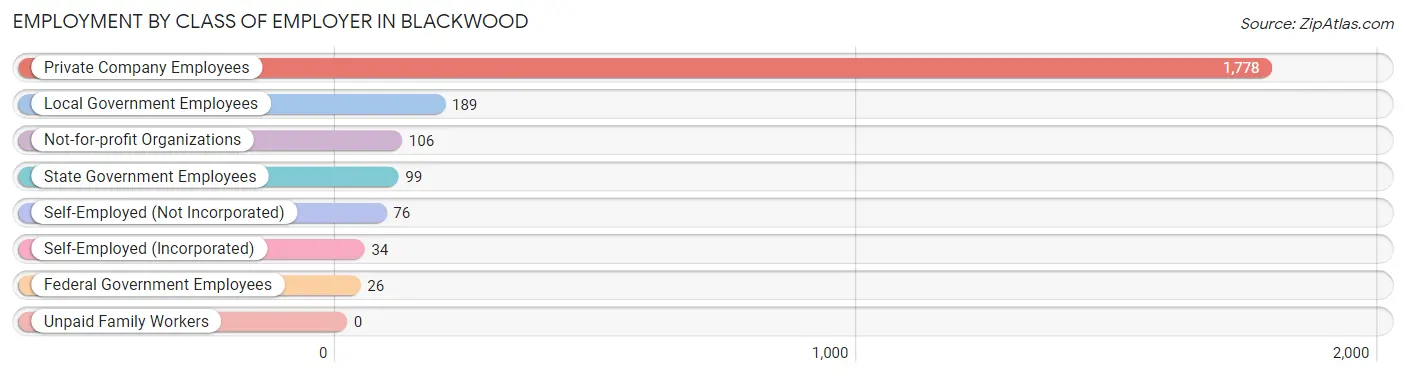
| Employer Class | # Employees | % Employees |
| Private Company Employees | 1,778 | 77.0% |
| Self-Employed (Incorporated) | 34 | 1.5% |
| Self-Employed (Not Incorporated) | 76 | 3.3% |
| Not-for-profit Organizations | 106 | 4.6% |
| Local Government Employees | 189 | 8.2% |
| State Government Employees | 99 | 4.3% |
| Federal Government Employees | 26 | 1.1% |
| Unpaid Family Workers | 0 | 0.0% |
| Total | 2,308 | 100.0% |
Employment Status by Age in Blackwood
According to the labor force statistics for Blackwood, out of the total population over 16 years of age (3,759), 67.3% or 2,530 individuals are in the labor force, with 6.6% or 167 of them unemployed. The age group with the highest labor force participation rate is 30 to 34 years, with 96.7% or 320 individuals in the labor force. Within the labor force, the 35 to 44 years age range has the highest percentage of unemployed individuals, with 10.7% or 47 of them being unemployed.
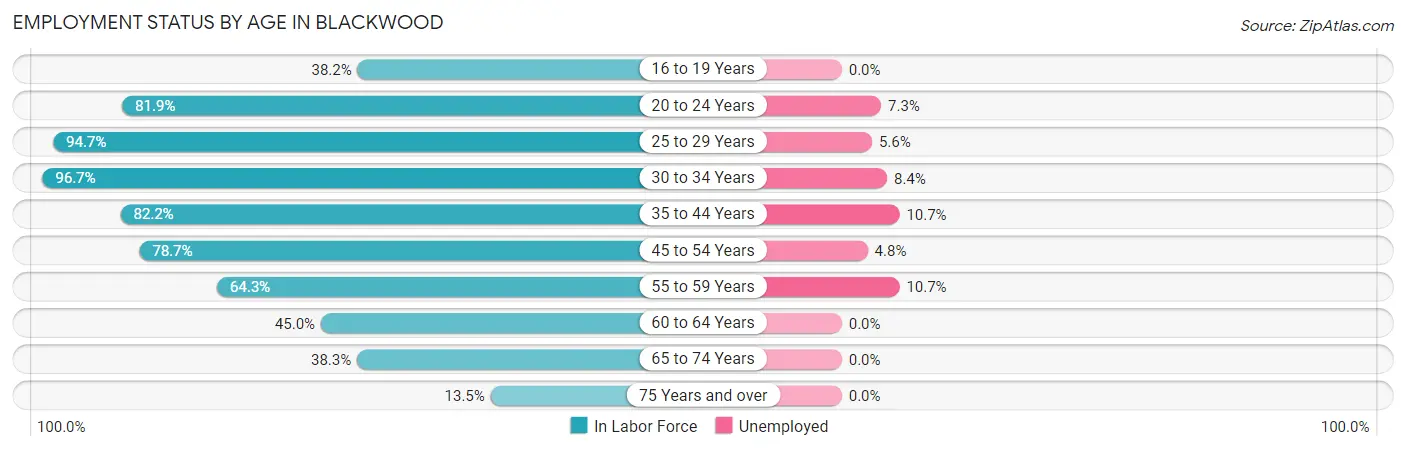
| Age Bracket | In Labor Force | Unemployed |
| 16 to 19 Years | 95 (38.2%) | 0 (0.0%) |
| 20 to 24 Years | 289 (81.9%) | 21 (7.3%) |
| 25 to 29 Years | 357 (94.7%) | 20 (5.6%) |
| 30 to 34 Years | 320 (96.7%) | 27 (8.4%) |
| 35 to 44 Years | 440 (82.2%) | 47 (10.7%) |
| 45 to 54 Years | 463 (78.7%) | 22 (4.8%) |
| 55 to 59 Years | 272 (64.3%) | 29 (10.7%) |
| 60 to 64 Years | 94 (45.0%) | 0 (0.0%) |
| 65 to 74 Years | 164 (38.3%) | 0 (0.0%) |
| 75 Years and over | 36 (13.5%) | 0 (0.0%) |
| Total | 2,530 (67.3%) | 167 (6.6%) |
Employment Status by Educational Attainment in Blackwood
According to labor force statistics for Blackwood, 79.0% of individuals (1,946) out of the total population between 25 and 64 years of age (2,463) are in the labor force, with 7.5% or 146 of them being unemployed. The group with the highest labor force participation rate are those with the educational attainment of bachelor's degree or higher, with 93.9% or 526 individuals in the labor force. Within the labor force, individuals with less than high school education have the highest percentage of unemployment, with 12.9% or 11 of them being unemployed.
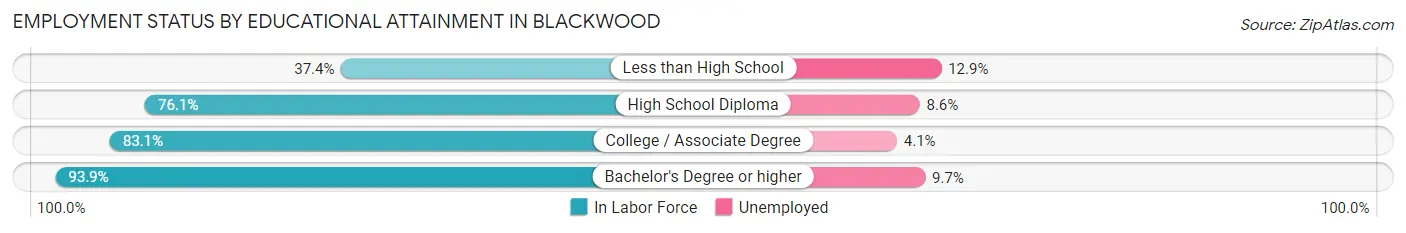
| Educational Attainment | In Labor Force | Unemployed |
| Less than High School | 85 (37.4%) | 29 (12.9%) |
| High School Diploma | 630 (76.1%) | 71 (8.6%) |
| College / Associate Degree | 705 (83.1%) | 35 (4.1%) |
| Bachelor's Degree or higher | 526 (93.9%) | 54 (9.7%) |
| Total | 1,946 (79.0%) | 185 (7.5%) |
Employment Occupations by Sex in Blackwood
Management, Business, Science and Arts Occupations
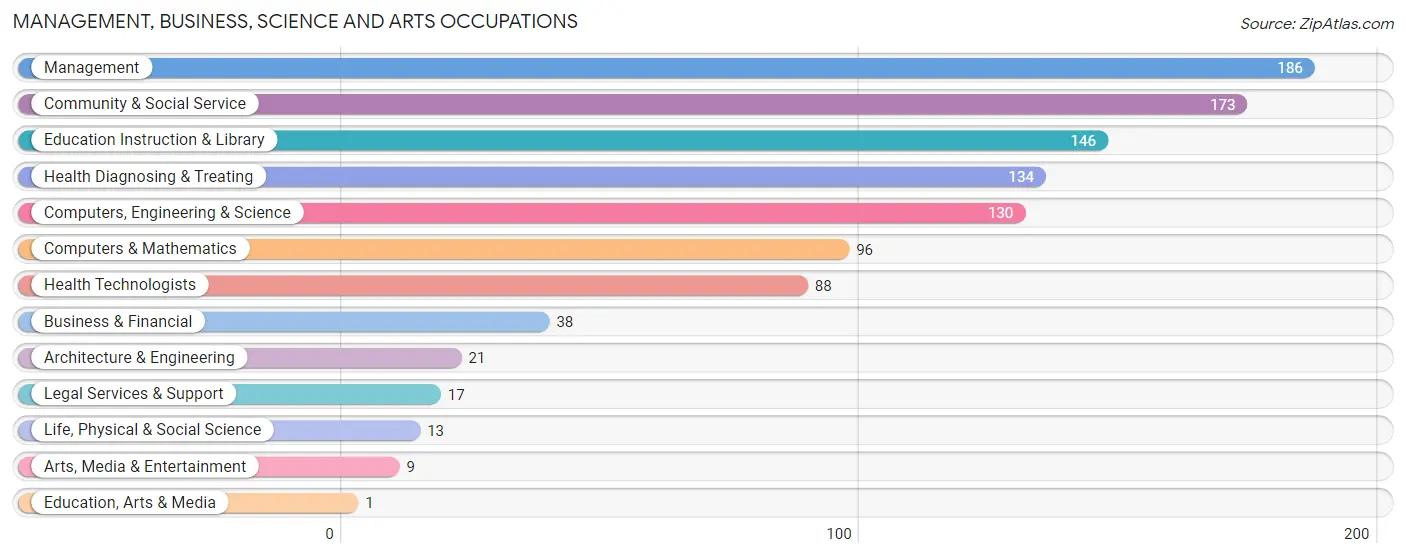
The most common Management, Business, Science and Arts occupations in Blackwood are Management (186 | 7.9%), Community & Social Service (173 | 7.3%), Education Instruction & Library (146 | 6.2%), Health Diagnosing & Treating (134 | 5.7%), and Computers, Engineering & Science (130 | 5.5%).
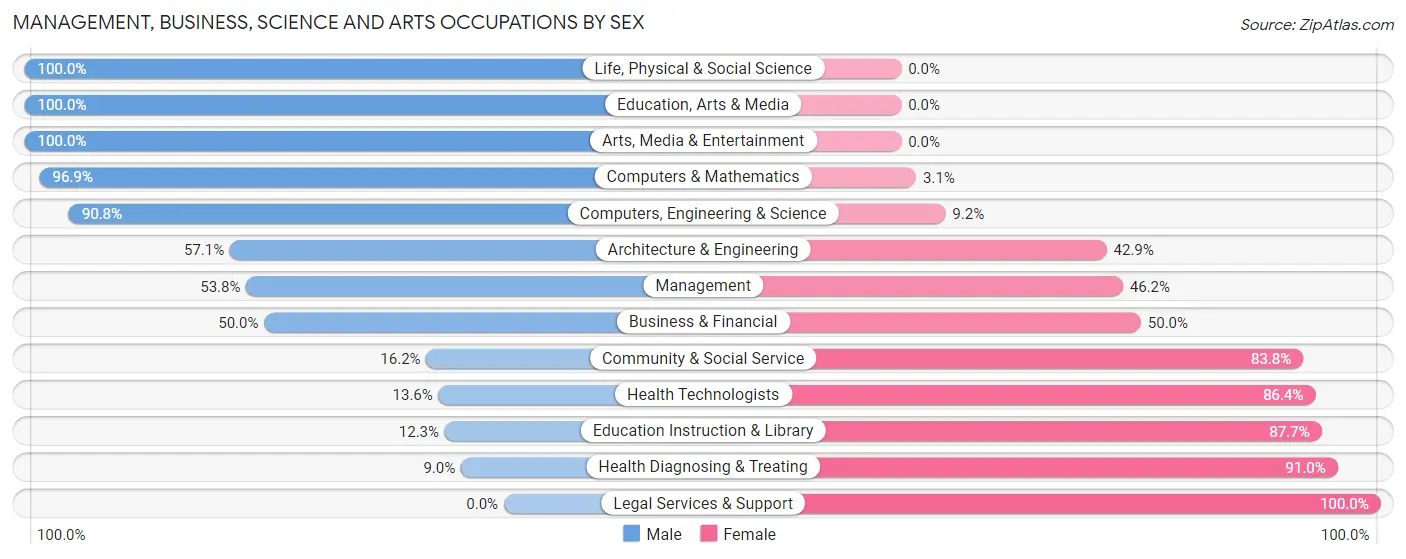
Management, Business, Science and Arts Occupations by Sex
Within the Management, Business, Science and Arts occupations in Blackwood, the most male-oriented occupations are Life, Physical & Social Science (100.0%), Education, Arts & Media (100.0%), and Arts, Media & Entertainment (100.0%), while the most female-oriented occupations are Legal Services & Support (100.0%), Health Diagnosing & Treating (91.0%), and Education Instruction & Library (87.7%).
| Occupation | Male | Female |
| Management | 100 (53.8%) | 86 (46.2%) |
| Business & Financial | 19 (50.0%) | 19 (50.0%) |
| Computers, Engineering & Science | 118 (90.8%) | 12 (9.2%) |
| Computers & Mathematics | 93 (96.9%) | 3 (3.1%) |
| Architecture & Engineering | 12 (57.1%) | 9 (42.9%) |
| Life, Physical & Social Science | 13 (100.0%) | 0 (0.0%) |
| Community & Social Service | 28 (16.2%) | 145 (83.8%) |
| Education, Arts & Media | 1 (100.0%) | 0 (0.0%) |
| Legal Services & Support | 0 (0.0%) | 17 (100.0%) |
| Education Instruction & Library | 18 (12.3%) | 128 (87.7%) |
| Arts, Media & Entertainment | 9 (100.0%) | 0 (0.0%) |
| Health Diagnosing & Treating | 12 (9.0%) | 122 (91.0%) |
| Health Technologists | 12 (13.6%) | 76 (86.4%) |
| Total (Category) | 277 (41.9%) | 384 (58.1%) |
| Total (Overall) | 1,218 (51.5%) | 1,146 (48.5%) |
Services Occupations
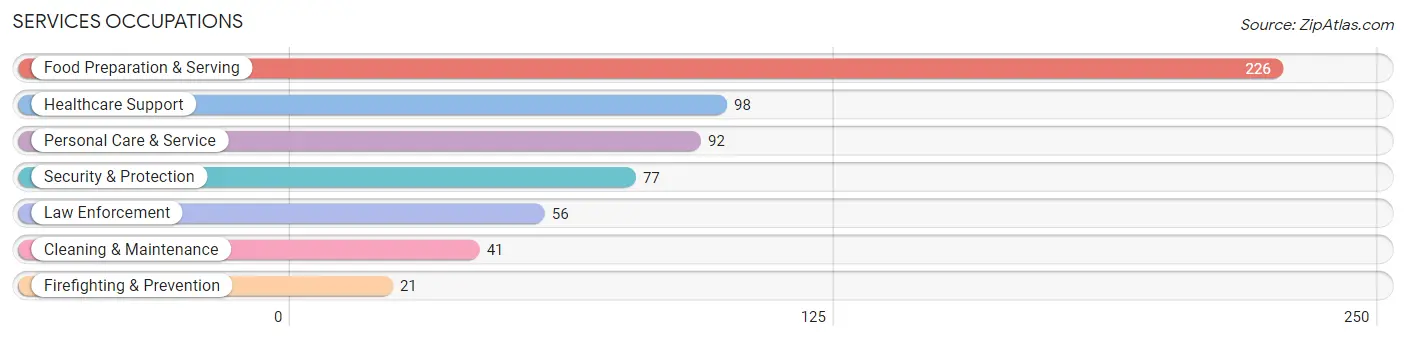
The most common Services occupations in Blackwood are Food Preparation & Serving (226 | 9.6%), Healthcare Support (98 | 4.2%), Personal Care & Service (92 | 3.9%), Security & Protection (77 | 3.3%), and Law Enforcement (56 | 2.4%).
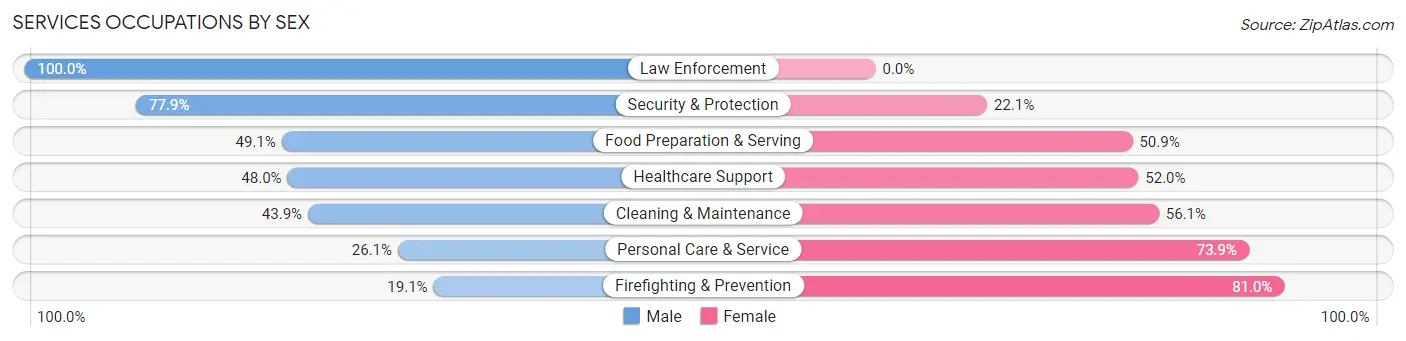
Services Occupations by Sex
Within the Services occupations in Blackwood, the most male-oriented occupations are Law Enforcement (100.0%), Security & Protection (77.9%), and Food Preparation & Serving (49.1%), while the most female-oriented occupations are Firefighting & Prevention (80.9%), Personal Care & Service (73.9%), and Cleaning & Maintenance (56.1%).
| Occupation | Male | Female |
| Healthcare Support | 47 (48.0%) | 51 (52.0%) |
| Security & Protection | 60 (77.9%) | 17 (22.1%) |
| Firefighting & Prevention | 4 (19.1%) | 17 (80.9%) |
| Law Enforcement | 56 (100.0%) | 0 (0.0%) |
| Food Preparation & Serving | 111 (49.1%) | 115 (50.9%) |
| Cleaning & Maintenance | 18 (43.9%) | 23 (56.1%) |
| Personal Care & Service | 24 (26.1%) | 68 (73.9%) |
| Total (Category) | 260 (48.7%) | 274 (51.3%) |
| Total (Overall) | 1,218 (51.5%) | 1,146 (48.5%) |
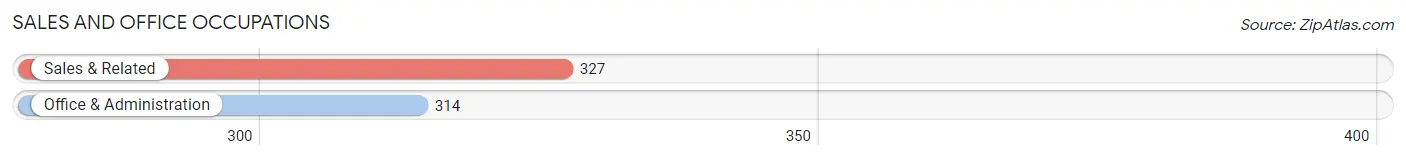
Sales and Office Occupations
The most common Sales and Office occupations in Blackwood are Sales & Related (327 | 13.8%), and Office & Administration (314 | 13.3%).
Sales and Office Occupations by Sex
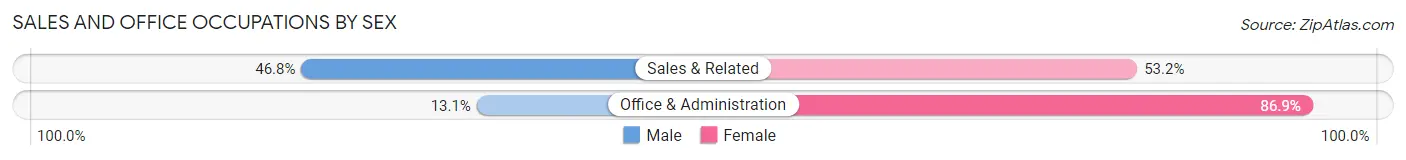
| Occupation | Male | Female |
| Sales & Related | 153 (46.8%) | 174 (53.2%) |
| Office & Administration | 41 (13.1%) | 273 (86.9%) |
| Total (Category) | 194 (30.3%) | 447 (69.7%) |
| Total (Overall) | 1,218 (51.5%) | 1,146 (48.5%) |
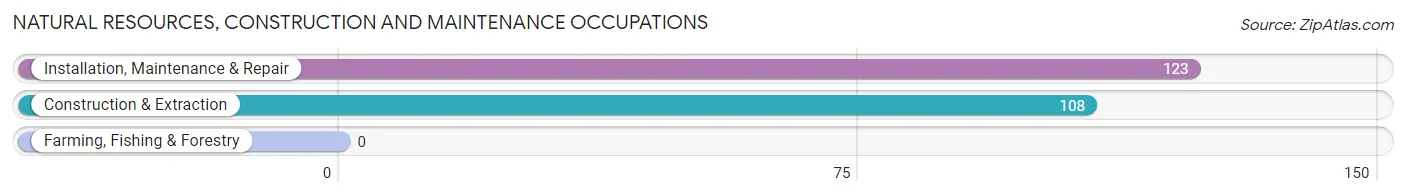
Natural Resources, Construction and Maintenance Occupations
The most common Natural Resources, Construction and Maintenance occupations in Blackwood are Installation, Maintenance & Repair (123 | 5.2%), and Construction & Extraction (108 | 4.6%).
Natural Resources, Construction and Maintenance Occupations by Sex
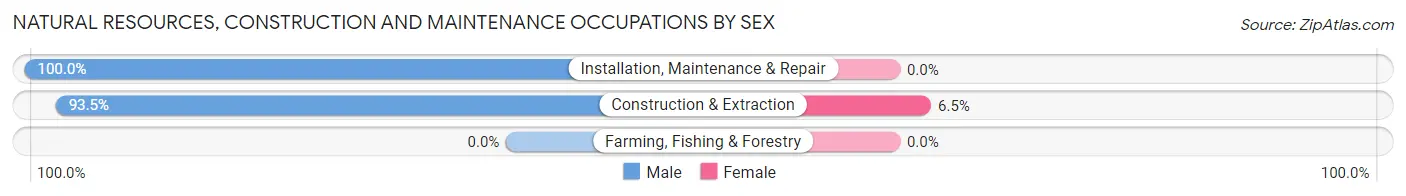
| Occupation | Male | Female |
| Farming, Fishing & Forestry | 0 (0.0%) | 0 (0.0%) |
| Construction & Extraction | 101 (93.5%) | 7 (6.5%) |
| Installation, Maintenance & Repair | 123 (100.0%) | 0 (0.0%) |
| Total (Category) | 224 (97.0%) | 7 (3.0%) |
| Total (Overall) | 1,218 (51.5%) | 1,146 (48.5%) |
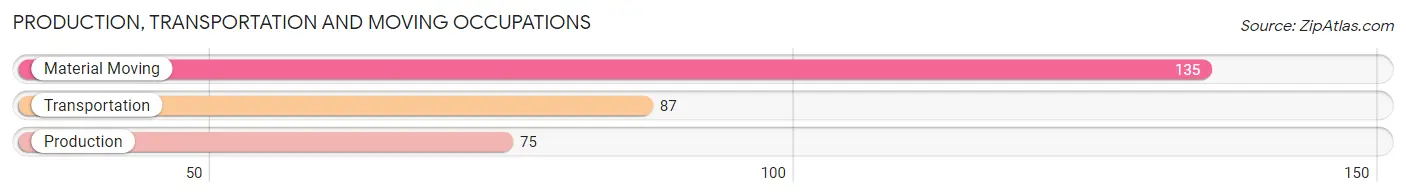
Production, Transportation and Moving Occupations
The most common Production, Transportation and Moving occupations in Blackwood are Material Moving (135 | 5.7%), Transportation (87 | 3.7%), and Production (75 | 3.2%).
Production, Transportation and Moving Occupations by Sex
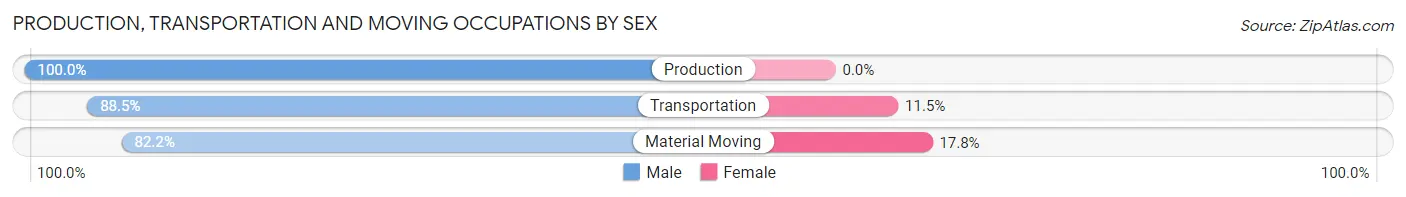
| Occupation | Male | Female |
| Production | 75 (100.0%) | 0 (0.0%) |
| Transportation | 77 (88.5%) | 10 (11.5%) |
| Material Moving | 111 (82.2%) | 24 (17.8%) |
| Total (Category) | 263 (88.5%) | 34 (11.5%) |
| Total (Overall) | 1,218 (51.5%) | 1,146 (48.5%) |
Employment Industries by Sex in Blackwood
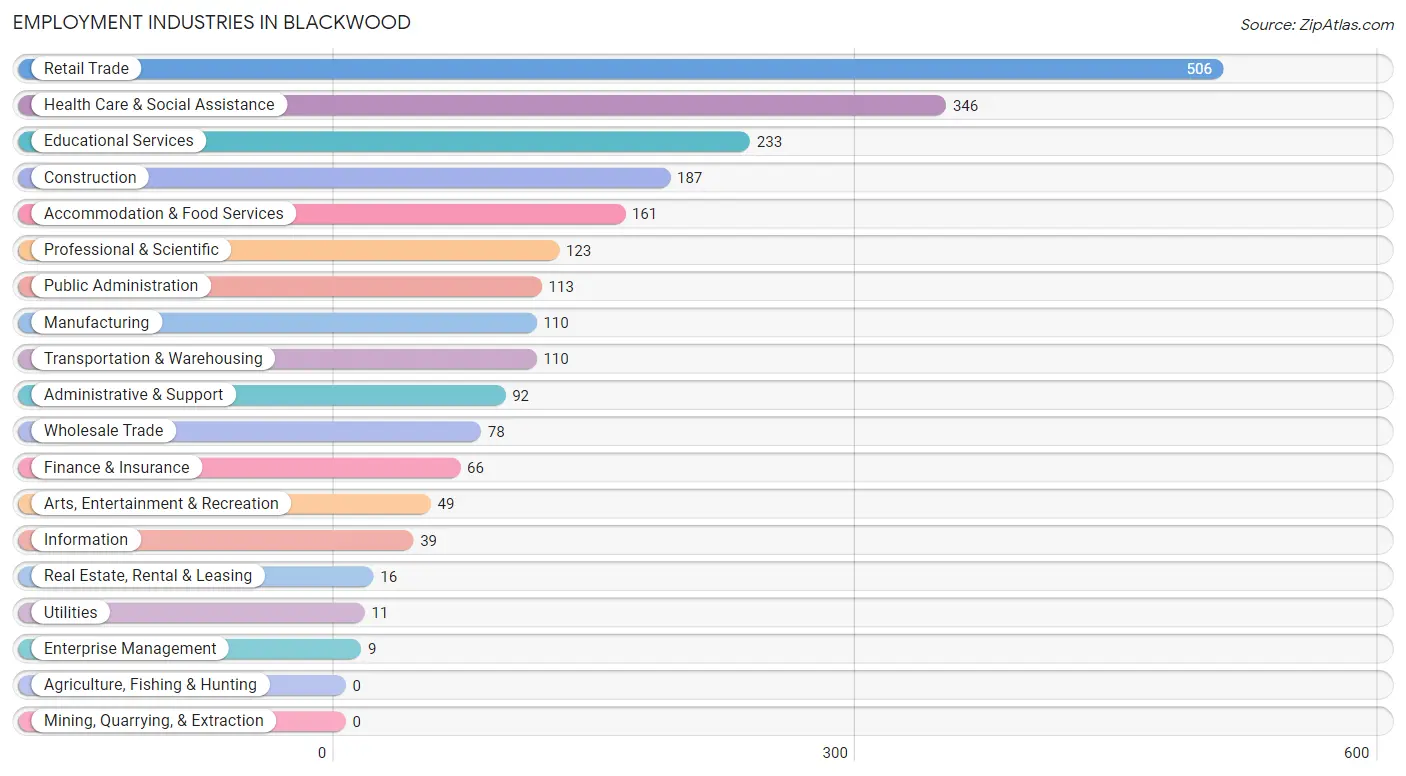
Employment Industries in Blackwood
The major employment industries in Blackwood include Retail Trade (506 | 21.4%), Health Care & Social Assistance (346 | 14.6%), Educational Services (233 | 9.9%), Construction (187 | 7.9%), and Accommodation & Food Services (161 | 6.8%).
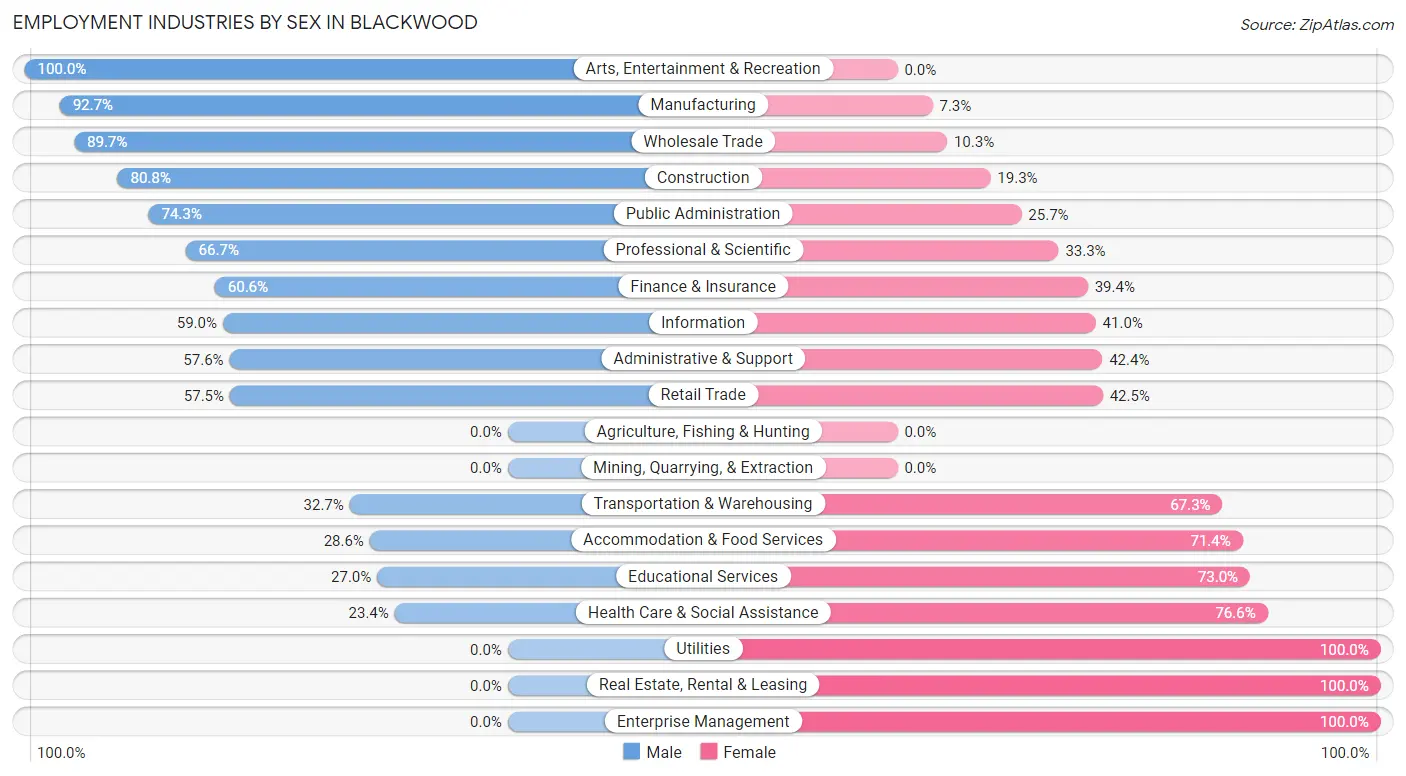
Employment Industries by Sex in Blackwood
The Blackwood industries that see more men than women are Arts, Entertainment & Recreation (100.0%), Manufacturing (92.7%), and Wholesale Trade (89.7%), whereas the industries that tend to have a higher number of women are Utilities (100.0%), Real Estate, Rental & Leasing (100.0%), and Enterprise Management (100.0%).
| Industry | Male | Female |
| Agriculture, Fishing & Hunting | 0 (0.0%) | 0 (0.0%) |
| Mining, Quarrying, & Extraction | 0 (0.0%) | 0 (0.0%) |
| Construction | 151 (80.7%) | 36 (19.3%) |
| Manufacturing | 102 (92.7%) | 8 (7.3%) |
| Wholesale Trade | 70 (89.7%) | 8 (10.3%) |
| Retail Trade | 291 (57.5%) | 215 (42.5%) |
| Transportation & Warehousing | 36 (32.7%) | 74 (67.3%) |
| Utilities | 0 (0.0%) | 11 (100.0%) |
| Information | 23 (59.0%) | 16 (41.0%) |
| Finance & Insurance | 40 (60.6%) | 26 (39.4%) |
| Real Estate, Rental & Leasing | 0 (0.0%) | 16 (100.0%) |
| Professional & Scientific | 82 (66.7%) | 41 (33.3%) |
| Enterprise Management | 0 (0.0%) | 9 (100.0%) |
| Administrative & Support | 53 (57.6%) | 39 (42.4%) |
| Educational Services | 63 (27.0%) | 170 (73.0%) |
| Health Care & Social Assistance | 81 (23.4%) | 265 (76.6%) |
| Arts, Entertainment & Recreation | 49 (100.0%) | 0 (0.0%) |
| Accommodation & Food Services | 46 (28.6%) | 115 (71.4%) |
| Public Administration | 84 (74.3%) | 29 (25.7%) |
| Total | 1,218 (51.5%) | 1,146 (48.5%) |
Education in Blackwood
School Enrollment in Blackwood
The most common levels of schooling among the 1,001 students in Blackwood are high school (248 | 24.8%), middle school (237 | 23.7%), and elementary school (180 | 18.0%).
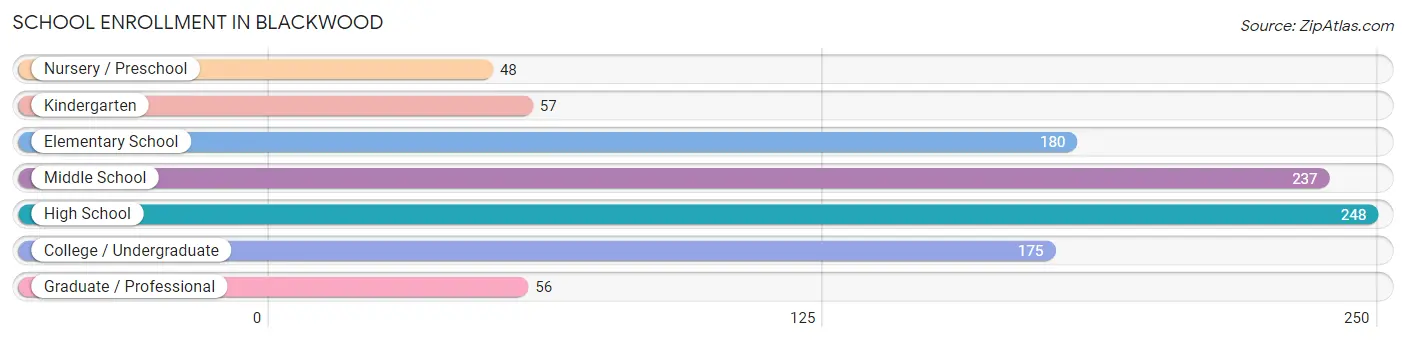
| School Level | # Students | % Students |
| Nursery / Preschool | 48 | 4.8% |
| Kindergarten | 57 | 5.7% |
| Elementary School | 180 | 18.0% |
| Middle School | 237 | 23.7% |
| High School | 248 | 24.8% |
| College / Undergraduate | 175 | 17.5% |
| Graduate / Professional | 56 | 5.6% |
| Total | 1,001 | 100.0% |
School Enrollment by Age by Funding Source in Blackwood
Out of a total of 1,001 students who are enrolled in schools in Blackwood, 130 (13.0%) attend a private institution, while the remaining 871 (87.0%) are enrolled in public schools. The age group of 18 to 19 year olds has the highest likelihood of being enrolled in private schools, with 19 (46.3% in the age bracket) enrolled. Conversely, the age group of 3 to 4 year olds has the lowest likelihood of being enrolled in a private school, with 30 (100.0% in the age bracket) attending a public institution.
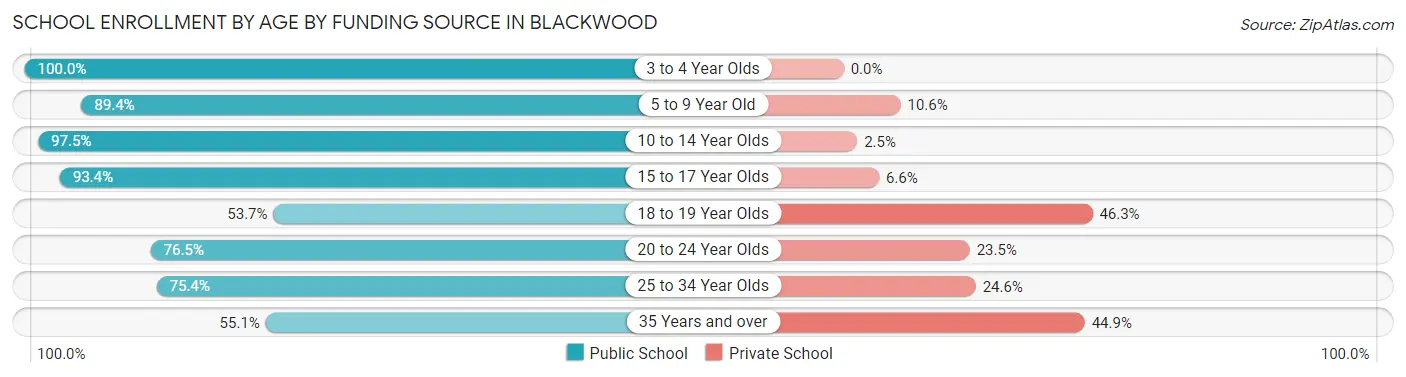
| Age Bracket | Public School | Private School |
| 3 to 4 Year Olds | 30 (100.0%) | 0 (0.0%) |
| 5 to 9 Year Old | 228 (89.4%) | 27 (10.6%) |
| 10 to 14 Year Olds | 231 (97.5%) | 6 (2.5%) |
| 15 to 17 Year Olds | 199 (93.4%) | 14 (6.6%) |
| 18 to 19 Year Olds | 22 (53.7%) | 19 (46.3%) |
| 20 to 24 Year Olds | 88 (76.5%) | 27 (23.5%) |
| 25 to 34 Year Olds | 46 (75.4%) | 15 (24.6%) |
| 35 Years and over | 27 (55.1%) | 22 (44.9%) |
| Total | 871 (87.0%) | 130 (13.0%) |
Educational Attainment by Field of Study in Blackwood
Business (157 | 23.8%), education (127 | 19.2%), arts & humanities (75 | 11.4%), liberal arts & history (60 | 9.1%), and science & technology (54 | 8.2%) are the most common fields of study among 660 individuals in Blackwood who have obtained a bachelor's degree or higher.
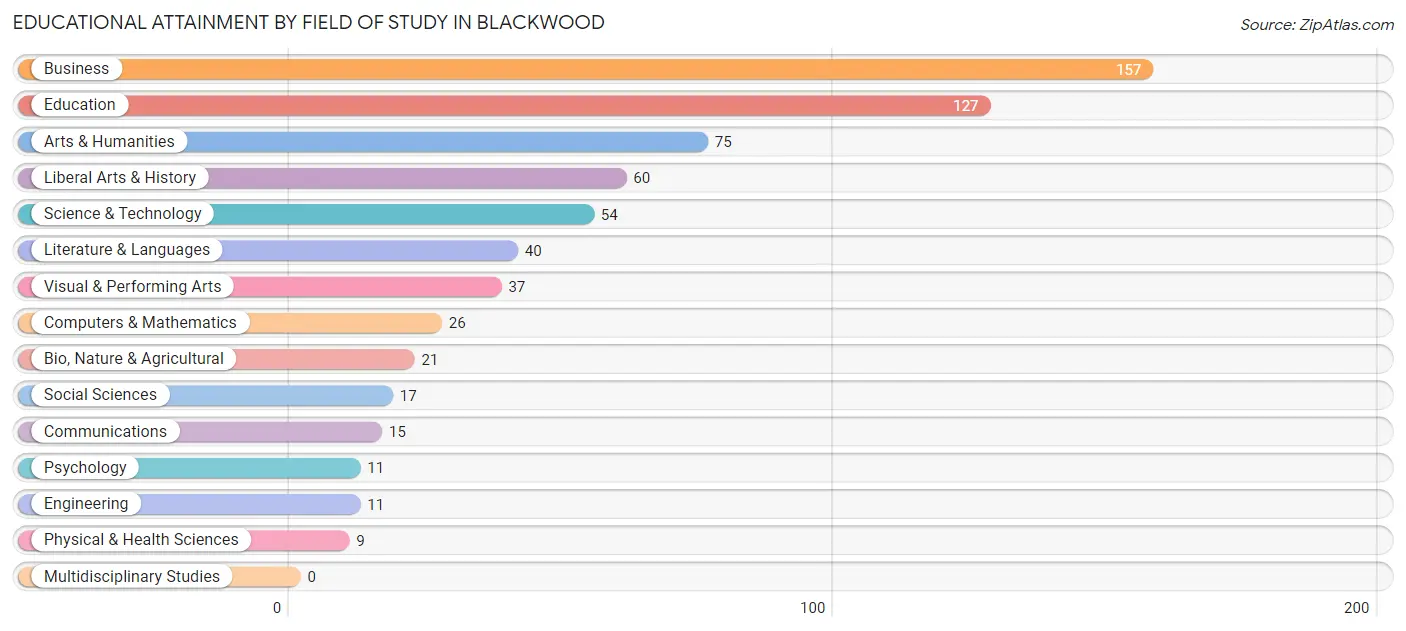
| Field of Study | # Graduates | % Graduates |
| Computers & Mathematics | 26 | 3.9% |
| Bio, Nature & Agricultural | 21 | 3.2% |
| Physical & Health Sciences | 9 | 1.4% |
| Psychology | 11 | 1.7% |
| Social Sciences | 17 | 2.6% |
| Engineering | 11 | 1.7% |
| Multidisciplinary Studies | 0 | 0.0% |
| Science & Technology | 54 | 8.2% |
| Business | 157 | 23.8% |
| Education | 127 | 19.2% |
| Literature & Languages | 40 | 6.1% |
| Liberal Arts & History | 60 | 9.1% |
| Visual & Performing Arts | 37 | 5.6% |
| Communications | 15 | 2.3% |
| Arts & Humanities | 75 | 11.4% |
| Total | 660 | 100.0% |
Transportation & Commute in Blackwood
Vehicle Availability by Sex in Blackwood
The most prevalent vehicle ownership categories in Blackwood are males with 2 vehicles (709, accounting for 59.4%) and females with 2 vehicles (542, making up 63.7%).
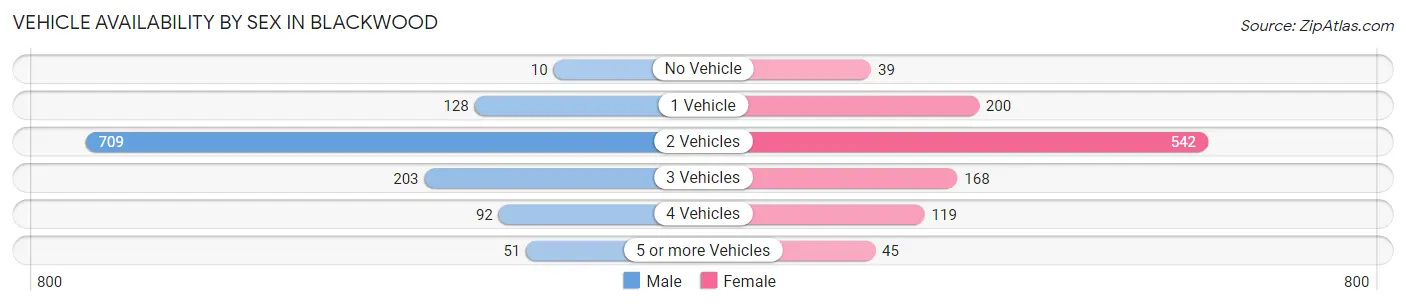
| Vehicles Available | Male | Female |
| No Vehicle | 10 (0.8%) | 39 (3.5%) |
| 1 Vehicle | 128 (10.7%) | 200 (18.0%) |
| 2 Vehicles | 709 (59.4%) | 542 (48.7%) |
| 3 Vehicles | 203 (17.0%) | 168 (15.1%) |
| 4 Vehicles | 92 (7.7%) | 119 (10.7%) |
| 5 or more Vehicles | 51 (4.3%) | 45 (4.0%) |
| Total | 1,193 (100.0%) | 1,113 (100.0%) |
Commute Time in Blackwood
The most frequently occuring commute durations in Blackwood are 30 to 34 minutes (423 commuters, 19.9%), 15 to 19 minutes (298 commuters, 14.0%), and 20 to 24 minutes (268 commuters, 12.6%).
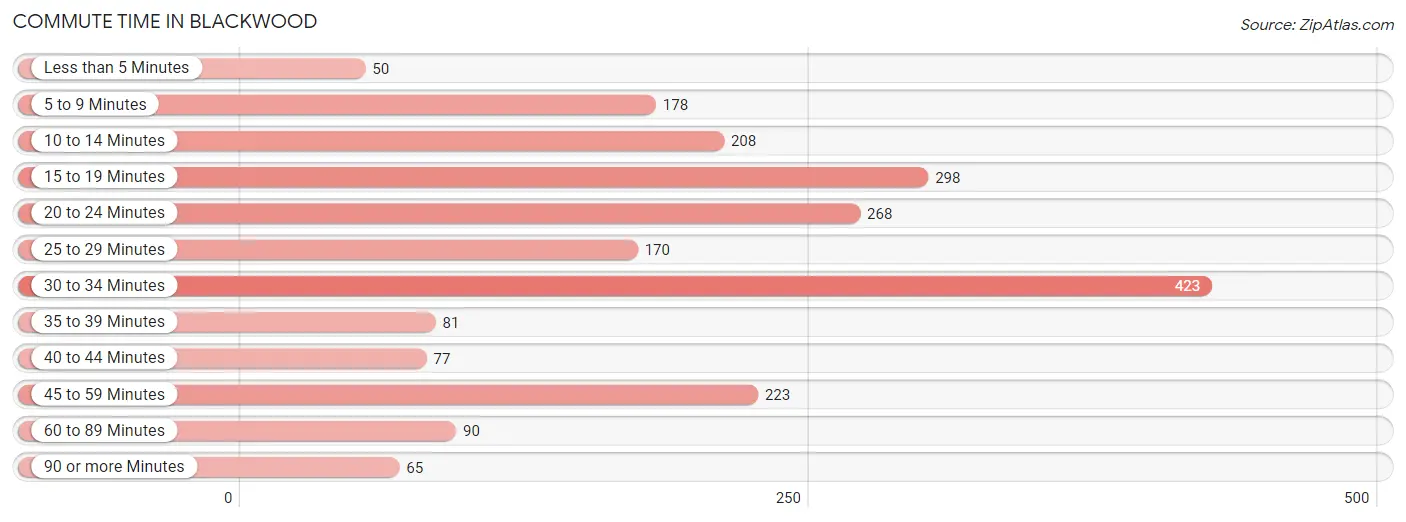
| Commute Time | # Commuters | % Commuters |
| Less than 5 Minutes | 50 | 2.4% |
| 5 to 9 Minutes | 178 | 8.4% |
| 10 to 14 Minutes | 208 | 9.8% |
| 15 to 19 Minutes | 298 | 14.0% |
| 20 to 24 Minutes | 268 | 12.6% |
| 25 to 29 Minutes | 170 | 8.0% |
| 30 to 34 Minutes | 423 | 19.9% |
| 35 to 39 Minutes | 81 | 3.8% |
| 40 to 44 Minutes | 77 | 3.6% |
| 45 to 59 Minutes | 223 | 10.5% |
| 60 to 89 Minutes | 90 | 4.2% |
| 90 or more Minutes | 65 | 3.0% |
Commute Time by Sex in Blackwood
The most common commute times in Blackwood are 30 to 34 minutes (196 commuters, 17.8%) for males and 30 to 34 minutes (227 commuters, 22.1%) for females.
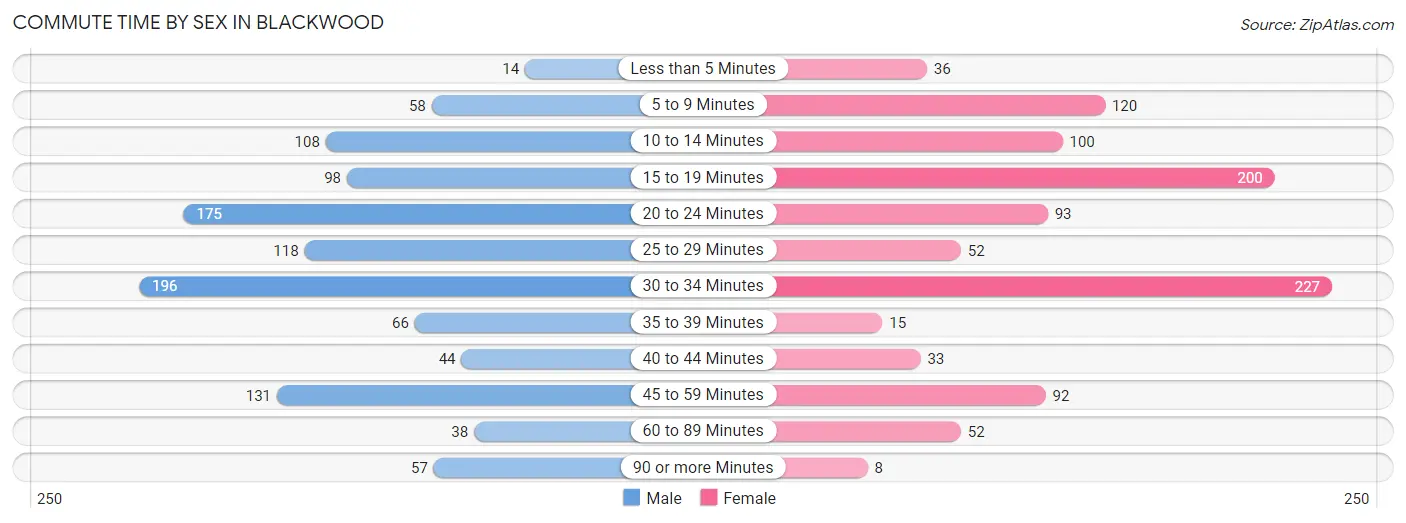
| Commute Time | Male | Female |
| Less than 5 Minutes | 14 (1.3%) | 36 (3.5%) |
| 5 to 9 Minutes | 58 (5.3%) | 120 (11.7%) |
| 10 to 14 Minutes | 108 (9.8%) | 100 (9.7%) |
| 15 to 19 Minutes | 98 (8.9%) | 200 (19.5%) |
| 20 to 24 Minutes | 175 (15.9%) | 93 (9.0%) |
| 25 to 29 Minutes | 118 (10.7%) | 52 (5.1%) |
| 30 to 34 Minutes | 196 (17.8%) | 227 (22.1%) |
| 35 to 39 Minutes | 66 (6.0%) | 15 (1.5%) |
| 40 to 44 Minutes | 44 (4.0%) | 33 (3.2%) |
| 45 to 59 Minutes | 131 (11.9%) | 92 (8.9%) |
| 60 to 89 Minutes | 38 (3.5%) | 52 (5.1%) |
| 90 or more Minutes | 57 (5.2%) | 8 (0.8%) |
Time of Departure to Work by Sex in Blackwood
The most frequent times of departure to work in Blackwood are 6:00 AM to 6:29 AM (265, 24.0%) for males and 7:30 AM to 7:59 AM (189, 18.4%) for females.
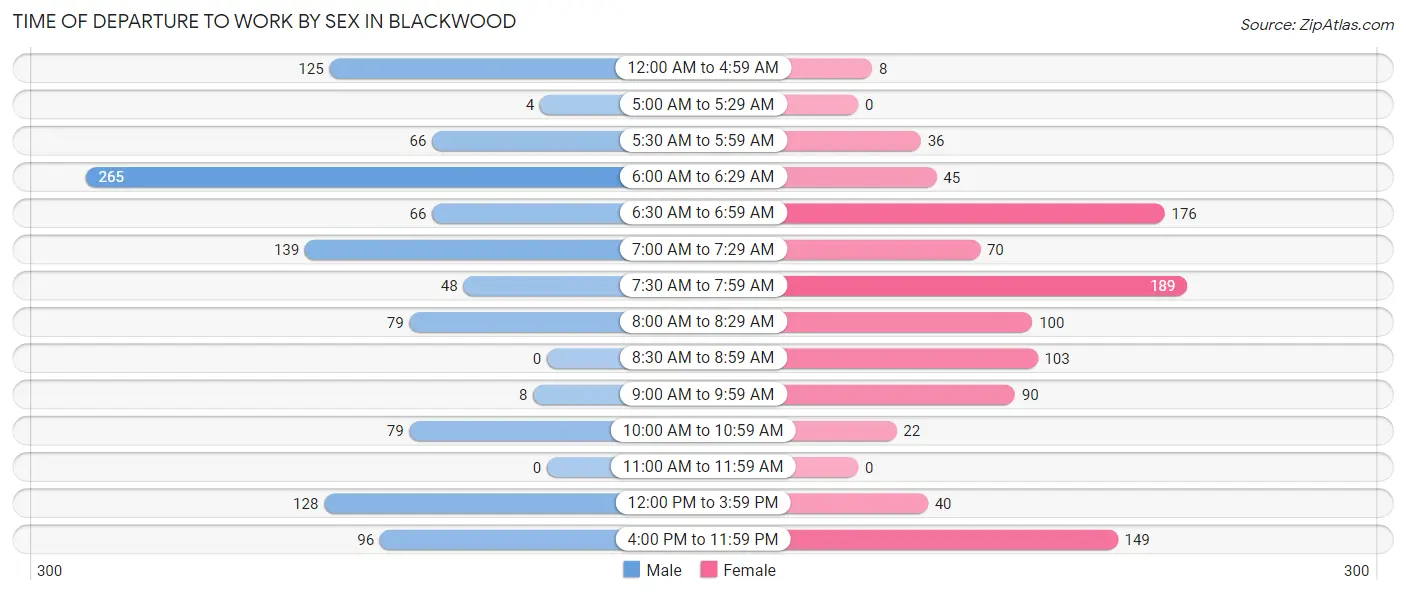
| Time of Departure | Male | Female |
| 12:00 AM to 4:59 AM | 125 (11.3%) | 8 (0.8%) |
| 5:00 AM to 5:29 AM | 4 (0.4%) | 0 (0.0%) |
| 5:30 AM to 5:59 AM | 66 (6.0%) | 36 (3.5%) |
| 6:00 AM to 6:29 AM | 265 (24.0%) | 45 (4.4%) |
| 6:30 AM to 6:59 AM | 66 (6.0%) | 176 (17.1%) |
| 7:00 AM to 7:29 AM | 139 (12.6%) | 70 (6.8%) |
| 7:30 AM to 7:59 AM | 48 (4.3%) | 189 (18.4%) |
| 8:00 AM to 8:29 AM | 79 (7.2%) | 100 (9.7%) |
| 8:30 AM to 8:59 AM | 0 (0.0%) | 103 (10.0%) |
| 9:00 AM to 9:59 AM | 8 (0.7%) | 90 (8.7%) |
| 10:00 AM to 10:59 AM | 79 (7.2%) | 22 (2.1%) |
| 11:00 AM to 11:59 AM | 0 (0.0%) | 0 (0.0%) |
| 12:00 PM to 3:59 PM | 128 (11.6%) | 40 (3.9%) |
| 4:00 PM to 11:59 PM | 96 (8.7%) | 149 (14.5%) |
| Total | 1,103 (100.0%) | 1,028 (100.0%) |
Housing Occupancy in Blackwood
Occupancy by Ownership in Blackwood
Of the total 1,618 dwellings in Blackwood, owner-occupied units account for 1,095 (67.7%), while renter-occupied units make up 523 (32.3%).
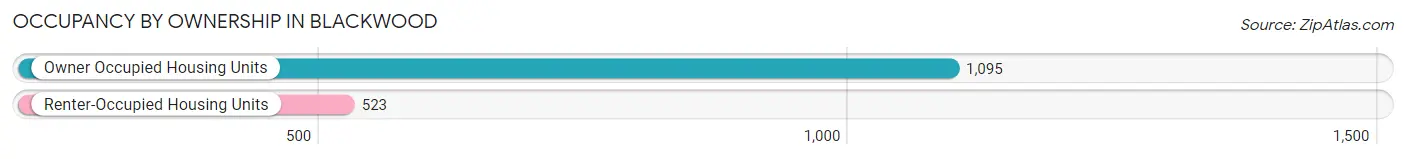
| Occupancy | # Housing Units | % Housing Units |
| Owner Occupied Housing Units | 1,095 | 67.7% |
| Renter-Occupied Housing Units | 523 | 32.3% |
| Total Occupied Housing Units | 1,618 | 100.0% |
Occupancy by Household Size in Blackwood
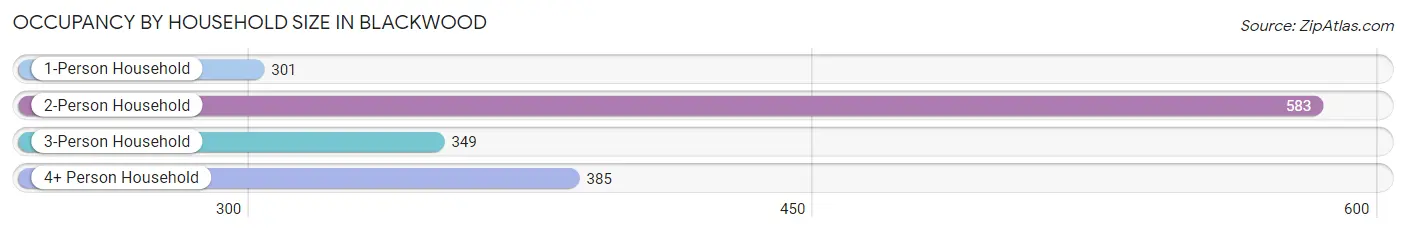
| Household Size | # Housing Units | % Housing Units |
| 1-Person Household | 301 | 18.6% |
| 2-Person Household | 583 | 36.0% |
| 3-Person Household | 349 | 21.6% |
| 4+ Person Household | 385 | 23.8% |
| Total Housing Units | 1,618 | 100.0% |
Occupancy by Ownership by Household Size in Blackwood
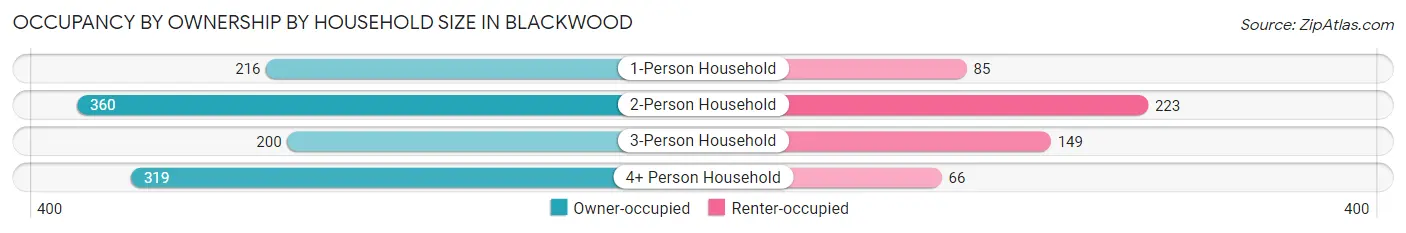
| Household Size | Owner-occupied | Renter-occupied |
| 1-Person Household | 216 (71.8%) | 85 (28.2%) |
| 2-Person Household | 360 (61.8%) | 223 (38.3%) |
| 3-Person Household | 200 (57.3%) | 149 (42.7%) |
| 4+ Person Household | 319 (82.9%) | 66 (17.1%) |
| Total Housing Units | 1,095 (67.7%) | 523 (32.3%) |
Occupancy by Educational Attainment in Blackwood
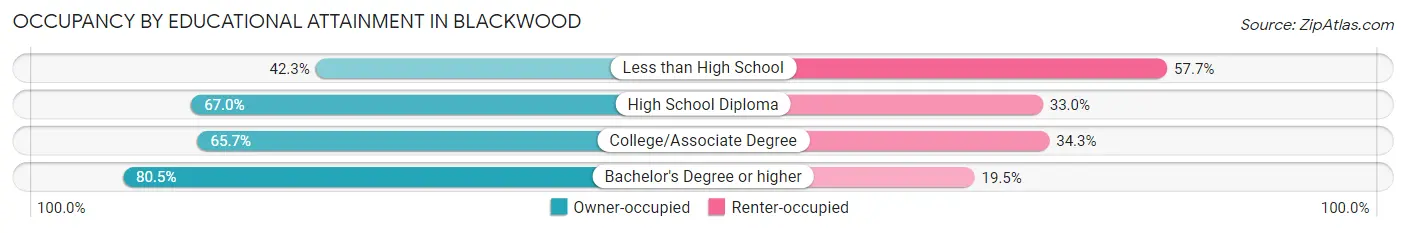
| Household Size | Owner-occupied | Renter-occupied |
| Less than High School | 33 (42.3%) | 45 (57.7%) |
| High School Diploma | 385 (67.0%) | 190 (33.0%) |
| College/Associate Degree | 442 (65.7%) | 231 (34.3%) |
| Bachelor's Degree or higher | 235 (80.5%) | 57 (19.5%) |
Occupancy by Age of Householder in Blackwood
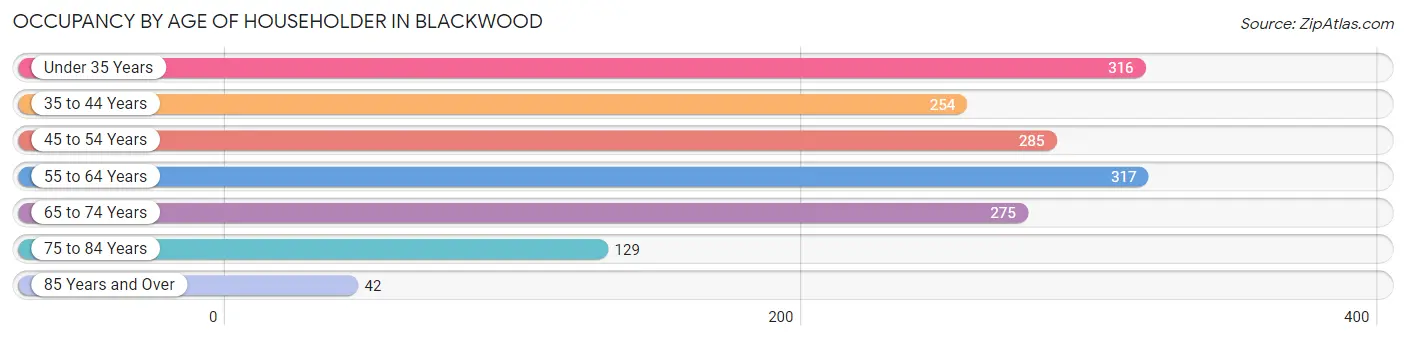
| Age Bracket | # Households | % Households |
| Under 35 Years | 316 | 19.5% |
| 35 to 44 Years | 254 | 15.7% |
| 45 to 54 Years | 285 | 17.6% |
| 55 to 64 Years | 317 | 19.6% |
| 65 to 74 Years | 275 | 17.0% |
| 75 to 84 Years | 129 | 8.0% |
| 85 Years and Over | 42 | 2.6% |
| Total | 1,618 | 100.0% |
Housing Finances in Blackwood
Median Income by Occupancy in Blackwood
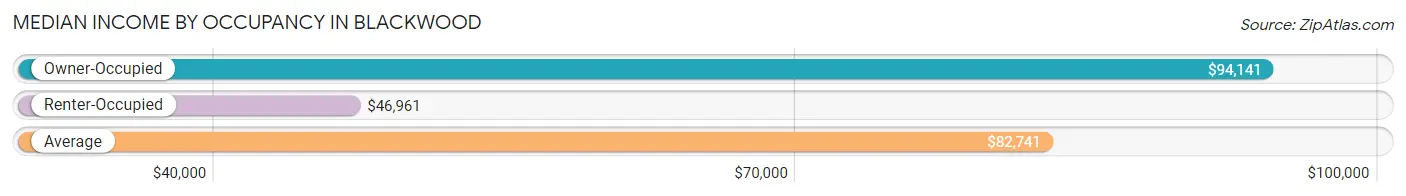
| Occupancy Type | # Households | Median Income |
| Owner-Occupied | 1,095 (67.7%) | $94,141 |
| Renter-Occupied | 523 (32.3%) | $46,961 |
| Average | 1,618 (100.0%) | $82,741 |
Occupancy by Householder Income Bracket in Blackwood
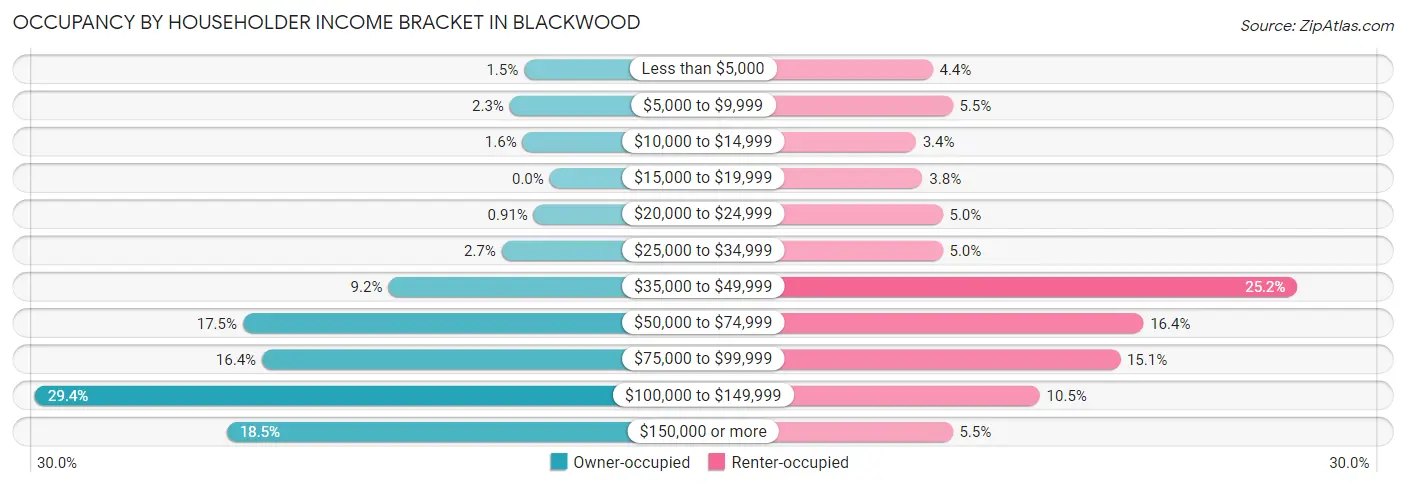
| Income Bracket | Owner-occupied | Renter-occupied |
| Less than $5,000 | 16 (1.5%) | 23 (4.4%) |
| $5,000 to $9,999 | 25 (2.3%) | 29 (5.5%) |
| $10,000 to $14,999 | 17 (1.5%) | 18 (3.4%) |
| $15,000 to $19,999 | 0 (0.0%) | 20 (3.8%) |
| $20,000 to $24,999 | 10 (0.9%) | 26 (5.0%) |
| $25,000 to $34,999 | 30 (2.7%) | 26 (5.0%) |
| $35,000 to $49,999 | 101 (9.2%) | 132 (25.2%) |
| $50,000 to $74,999 | 192 (17.5%) | 86 (16.4%) |
| $75,000 to $99,999 | 180 (16.4%) | 79 (15.1%) |
| $100,000 to $149,999 | 322 (29.4%) | 55 (10.5%) |
| $150,000 or more | 202 (18.4%) | 29 (5.5%) |
| Total | 1,095 (100.0%) | 523 (100.0%) |
Monthly Housing Cost Tiers in Blackwood
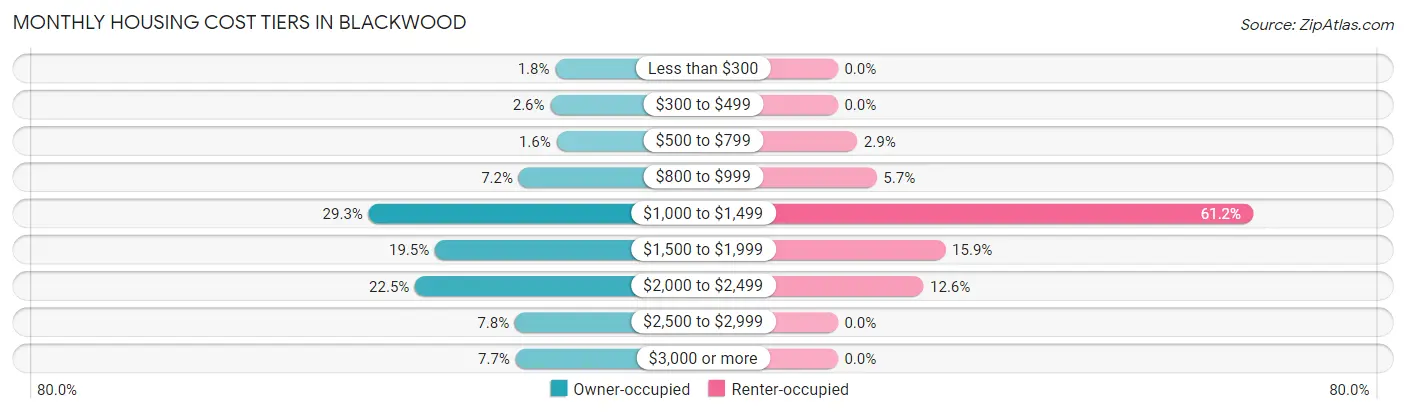
| Monthly Cost | Owner-occupied | Renter-occupied |
| Less than $300 | 20 (1.8%) | 0 (0.0%) |
| $300 to $499 | 28 (2.6%) | 0 (0.0%) |
| $500 to $799 | 18 (1.6%) | 15 (2.9%) |
| $800 to $999 | 79 (7.2%) | 30 (5.7%) |
| $1,000 to $1,499 | 321 (29.3%) | 320 (61.2%) |
| $1,500 to $1,999 | 214 (19.5%) | 83 (15.9%) |
| $2,000 to $2,499 | 246 (22.5%) | 66 (12.6%) |
| $2,500 to $2,999 | 85 (7.8%) | 0 (0.0%) |
| $3,000 or more | 84 (7.7%) | 0 (0.0%) |
| Total | 1,095 (100.0%) | 523 (100.0%) |
Physical Housing Characteristics in Blackwood
Housing Structures in Blackwood
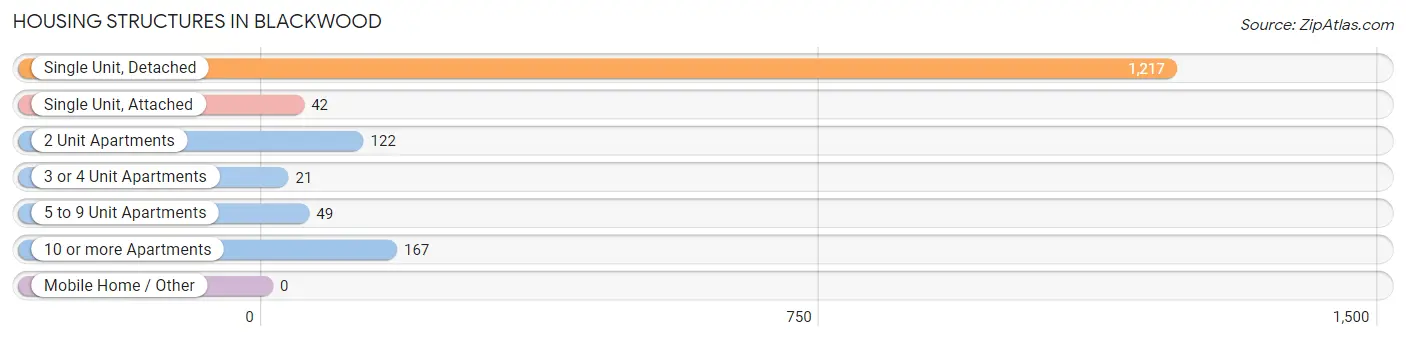
| Structure Type | # Housing Units | % Housing Units |
| Single Unit, Detached | 1,217 | 75.2% |
| Single Unit, Attached | 42 | 2.6% |
| 2 Unit Apartments | 122 | 7.5% |
| 3 or 4 Unit Apartments | 21 | 1.3% |
| 5 to 9 Unit Apartments | 49 | 3.0% |
| 10 or more Apartments | 167 | 10.3% |
| Mobile Home / Other | 0 | 0.0% |
| Total | 1,618 | 100.0% |
Housing Structures by Occupancy in Blackwood
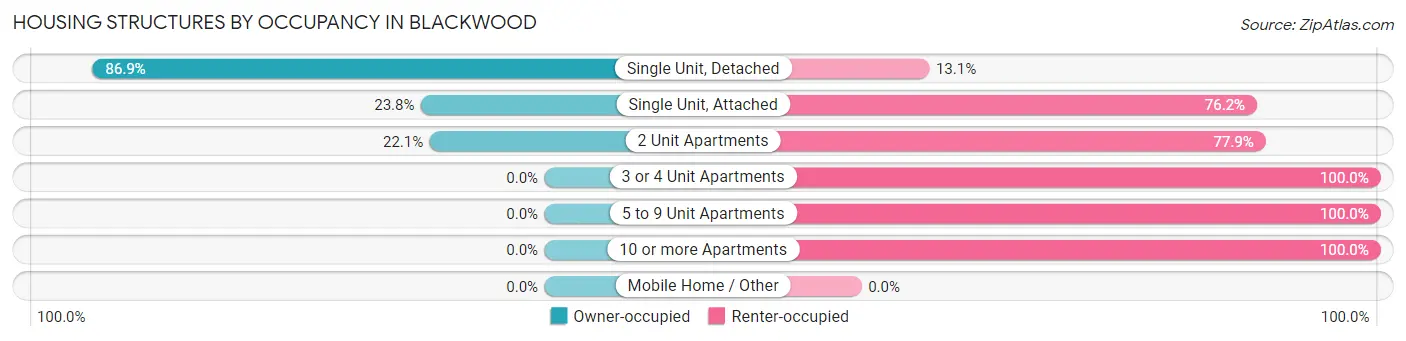
| Structure Type | Owner-occupied | Renter-occupied |
| Single Unit, Detached | 1,058 (86.9%) | 159 (13.1%) |
| Single Unit, Attached | 10 (23.8%) | 32 (76.2%) |
| 2 Unit Apartments | 27 (22.1%) | 95 (77.9%) |
| 3 or 4 Unit Apartments | 0 (0.0%) | 21 (100.0%) |
| 5 to 9 Unit Apartments | 0 (0.0%) | 49 (100.0%) |
| 10 or more Apartments | 0 (0.0%) | 167 (100.0%) |
| Mobile Home / Other | 0 (0.0%) | 0 (0.0%) |
| Total | 1,095 (67.7%) | 523 (32.3%) |
Housing Structures by Number of Rooms in Blackwood
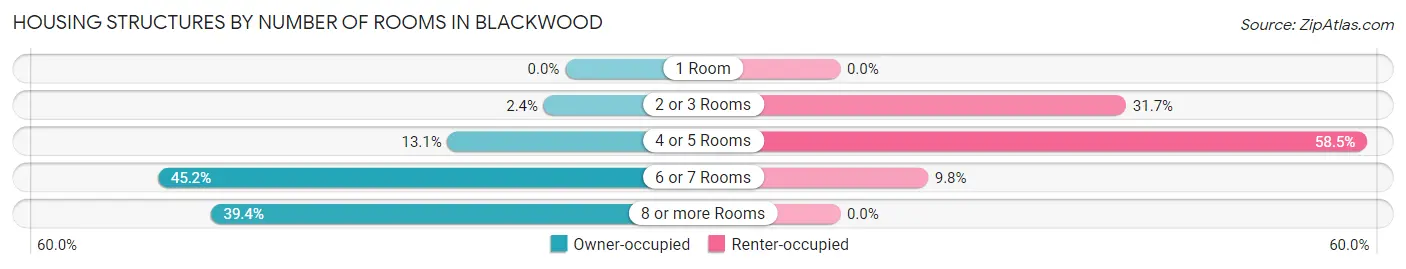
| Number of Rooms | Owner-occupied | Renter-occupied |
| 1 Room | 0 (0.0%) | 0 (0.0%) |
| 2 or 3 Rooms | 26 (2.4%) | 166 (31.7%) |
| 4 or 5 Rooms | 143 (13.1%) | 306 (58.5%) |
| 6 or 7 Rooms | 495 (45.2%) | 51 (9.8%) |
| 8 or more Rooms | 431 (39.4%) | 0 (0.0%) |
| Total | 1,095 (100.0%) | 523 (100.0%) |
Housing Structure by Heating Type in Blackwood
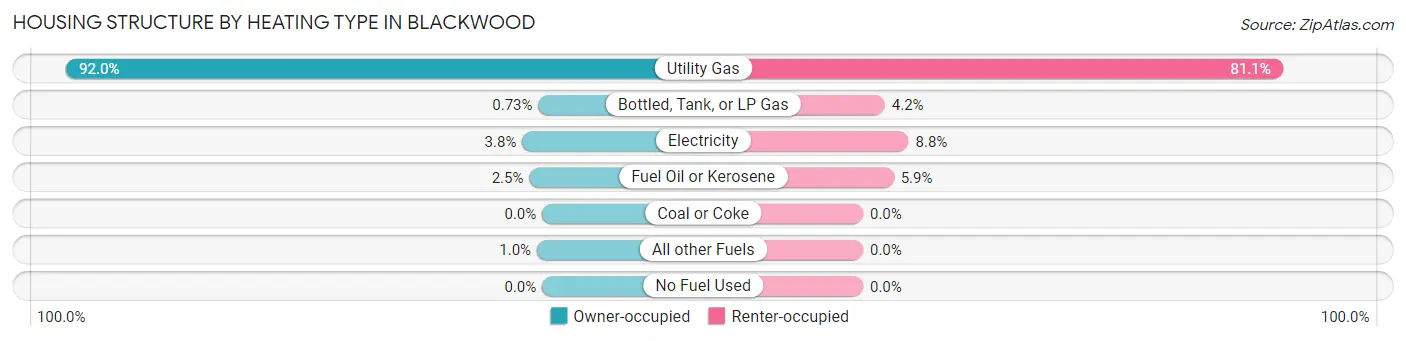
| Heating Type | Owner-occupied | Renter-occupied |
| Utility Gas | 1,007 (92.0%) | 424 (81.1%) |
| Bottled, Tank, or LP Gas | 8 (0.7%) | 22 (4.2%) |
| Electricity | 42 (3.8%) | 46 (8.8%) |
| Fuel Oil or Kerosene | 27 (2.5%) | 31 (5.9%) |
| Coal or Coke | 0 (0.0%) | 0 (0.0%) |
| All other Fuels | 11 (1.0%) | 0 (0.0%) |
| No Fuel Used | 0 (0.0%) | 0 (0.0%) |
| Total | 1,095 (100.0%) | 523 (100.0%) |
Household Vehicle Usage in Blackwood
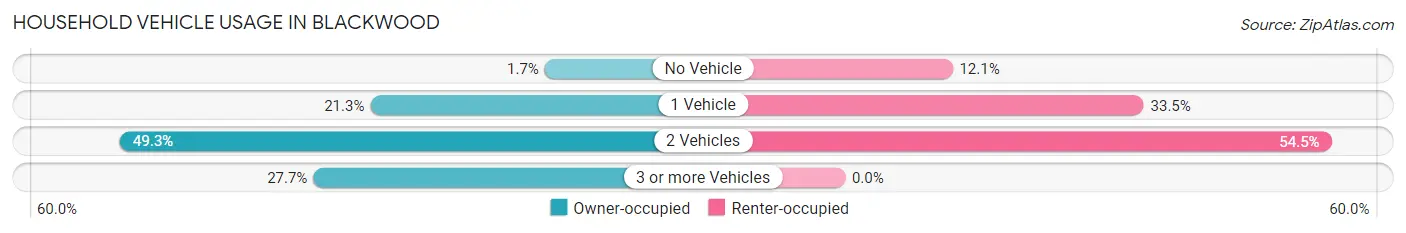
| Vehicles per Household | Owner-occupied | Renter-occupied |
| No Vehicle | 19 (1.7%) | 63 (12.0%) |
| 1 Vehicle | 233 (21.3%) | 175 (33.5%) |
| 2 Vehicles | 540 (49.3%) | 285 (54.5%) |
| 3 or more Vehicles | 303 (27.7%) | 0 (0.0%) |
| Total | 1,095 (100.0%) | 523 (100.0%) |
Real Estate & Mortgages in Blackwood
Real Estate and Mortgage Overview in Blackwood
| Characteristic | Without Mortgage | With Mortgage |
| Housing Units | 378 | 717 |
| Median Property Value | $225,700 | $203,200 |
| Median Household Income | $68,077 | $175 |
| Monthly Housing Costs | $1,060 | $84 |
| Real Estate Taxes | $7,933 | $25 |
Property Value by Mortgage Status in Blackwood
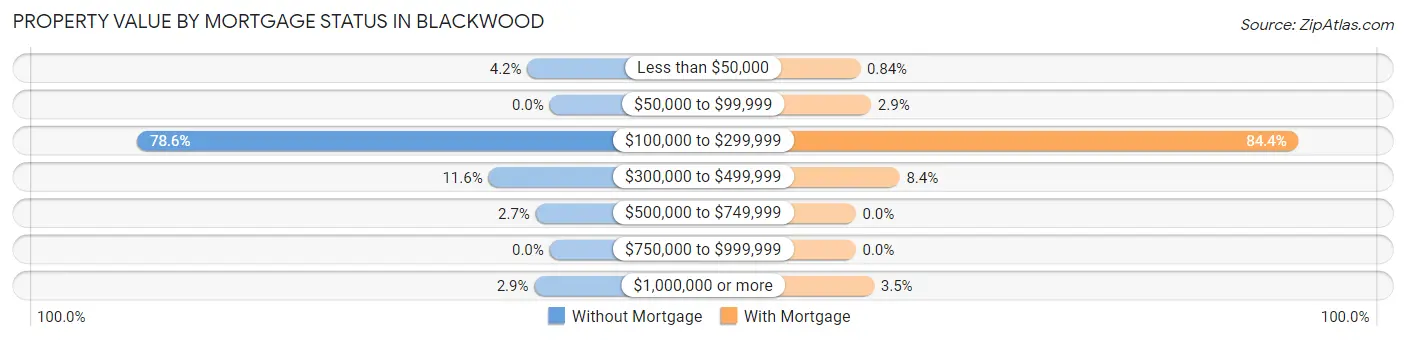
| Property Value | Without Mortgage | With Mortgage |
| Less than $50,000 | 16 (4.2%) | 6 (0.8%) |
| $50,000 to $99,999 | 0 (0.0%) | 21 (2.9%) |
| $100,000 to $299,999 | 297 (78.6%) | 605 (84.4%) |
| $300,000 to $499,999 | 44 (11.6%) | 60 (8.4%) |
| $500,000 to $749,999 | 10 (2.6%) | 0 (0.0%) |
| $750,000 to $999,999 | 0 (0.0%) | 0 (0.0%) |
| $1,000,000 or more | 11 (2.9%) | 25 (3.5%) |
| Total | 378 (100.0%) | 717 (100.0%) |
Household Income by Mortgage Status in Blackwood
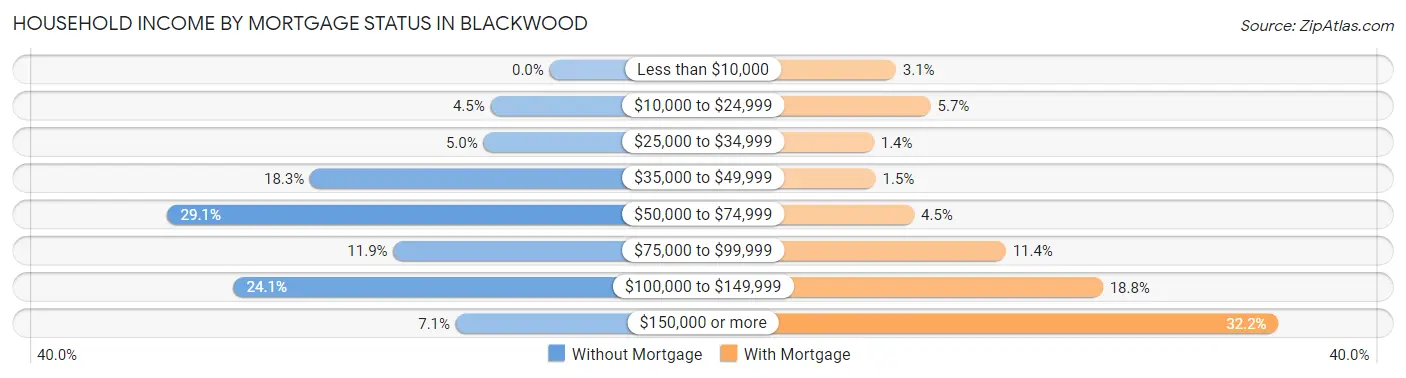
| Household Income | Without Mortgage | With Mortgage |
| Less than $10,000 | 0 (0.0%) | 22 (3.1%) |
| $10,000 to $24,999 | 17 (4.5%) | 41 (5.7%) |
| $25,000 to $34,999 | 19 (5.0%) | 10 (1.4%) |
| $35,000 to $49,999 | 69 (18.2%) | 11 (1.5%) |
| $50,000 to $74,999 | 110 (29.1%) | 32 (4.5%) |
| $75,000 to $99,999 | 45 (11.9%) | 82 (11.4%) |
| $100,000 to $149,999 | 91 (24.1%) | 135 (18.8%) |
| $150,000 or more | 27 (7.1%) | 231 (32.2%) |
| Total | 378 (100.0%) | 717 (100.0%) |
Property Value to Household Income Ratio in Blackwood
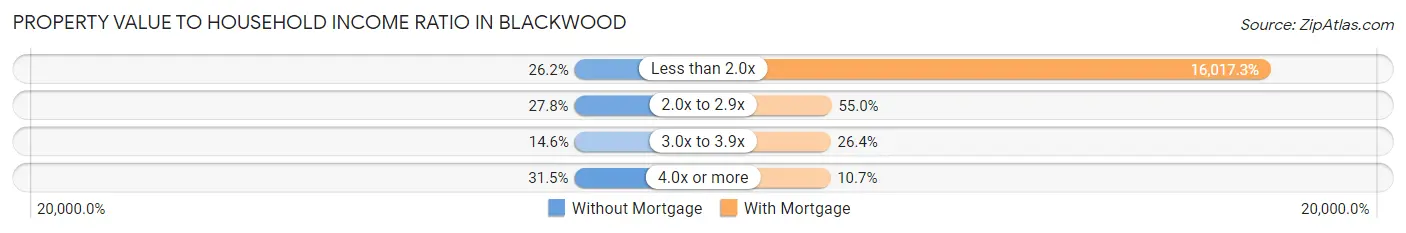
| Value-to-Income Ratio | Without Mortgage | With Mortgage |
| Less than 2.0x | 99 (26.2%) | 114,844 (16,017.3%) |
| 2.0x to 2.9x | 105 (27.8%) | 394 (54.9%) |
| 3.0x to 3.9x | 55 (14.5%) | 189 (26.4%) |
| 4.0x or more | 119 (31.5%) | 77 (10.7%) |
| Total | 378 (100.0%) | 717 (100.0%) |
Real Estate Taxes by Mortgage Status in Blackwood
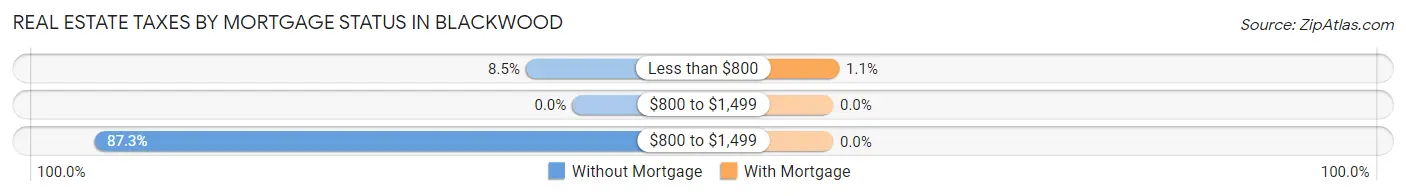
| Property Taxes | Without Mortgage | With Mortgage |
| Less than $800 | 32 (8.5%) | 8 (1.1%) |
| $800 to $1,499 | 0 (0.0%) | 0 (0.0%) |
| $800 to $1,499 | 330 (87.3%) | 0 (0.0%) |
| Total | 378 (100.0%) | 717 (100.0%) |
Health & Disability in Blackwood
Health Insurance Coverage by Age in Blackwood
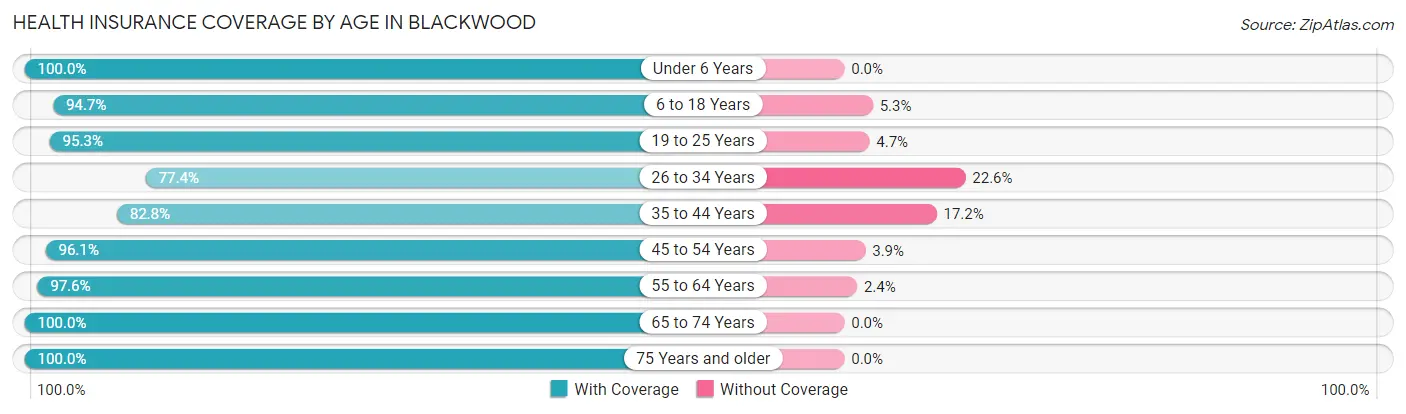
| Age Bracket | With Coverage | Without Coverage |
| Under 6 Years | 280 (100.0%) | 0 (0.0%) |
| 6 to 18 Years | 750 (94.7%) | 42 (5.3%) |
| 19 to 25 Years | 388 (95.3%) | 19 (4.7%) |
| 26 to 34 Years | 511 (77.4%) | 149 (22.6%) |
| 35 to 44 Years | 443 (82.8%) | 92 (17.2%) |
| 45 to 54 Years | 565 (96.1%) | 23 (3.9%) |
| 55 to 64 Years | 617 (97.6%) | 15 (2.4%) |
| 65 to 74 Years | 428 (100.0%) | 0 (0.0%) |
| 75 Years and older | 266 (100.0%) | 0 (0.0%) |
| Total | 4,248 (92.6%) | 340 (7.4%) |
Health Insurance Coverage by Citizenship Status in Blackwood
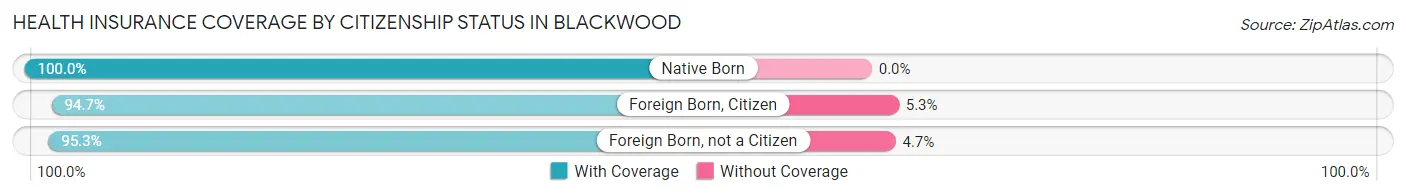
| Citizenship Status | With Coverage | Without Coverage |
| Native Born | 280 (100.0%) | 0 (0.0%) |
| Foreign Born, Citizen | 750 (94.7%) | 42 (5.3%) |
| Foreign Born, not a Citizen | 388 (95.3%) | 19 (4.7%) |
Health Insurance Coverage by Household Income in Blackwood
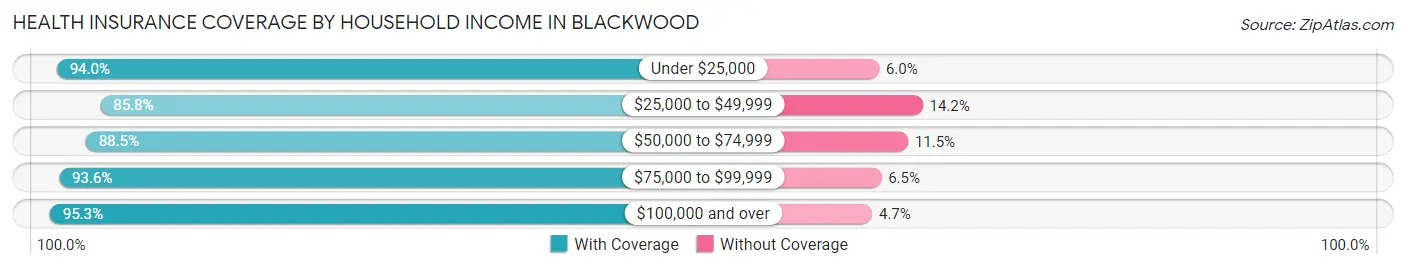
| Household Income | With Coverage | Without Coverage |
| Under $25,000 | 484 (94.0%) | 31 (6.0%) |
| $25,000 to $49,999 | 538 (85.8%) | 89 (14.2%) |
| $50,000 to $74,999 | 587 (88.5%) | 76 (11.5%) |
| $75,000 to $99,999 | 682 (93.5%) | 47 (6.5%) |
| $100,000 and over | 1,953 (95.3%) | 97 (4.7%) |
Public vs Private Health Insurance Coverage by Age in Blackwood
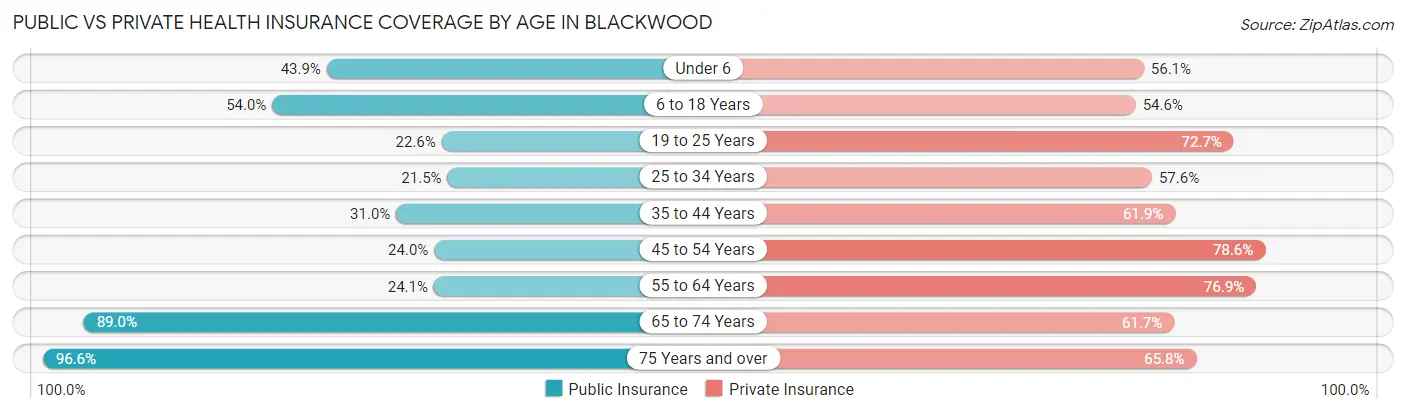
| Age Bracket | Public Insurance | Private Insurance |
| Under 6 | 123 (43.9%) | 157 (56.1%) |
| 6 to 18 Years | 428 (54.0%) | 432 (54.5%) |
| 19 to 25 Years | 92 (22.6%) | 296 (72.7%) |
| 25 to 34 Years | 142 (21.5%) | 380 (57.6%) |
| 35 to 44 Years | 166 (31.0%) | 331 (61.9%) |
| 45 to 54 Years | 141 (24.0%) | 462 (78.6%) |
| 55 to 64 Years | 152 (24.0%) | 486 (76.9%) |
| 65 to 74 Years | 381 (89.0%) | 264 (61.7%) |
| 75 Years and over | 257 (96.6%) | 175 (65.8%) |
| Total | 1,882 (41.0%) | 2,983 (65.0%) |
Disability Status by Sex by Age in Blackwood
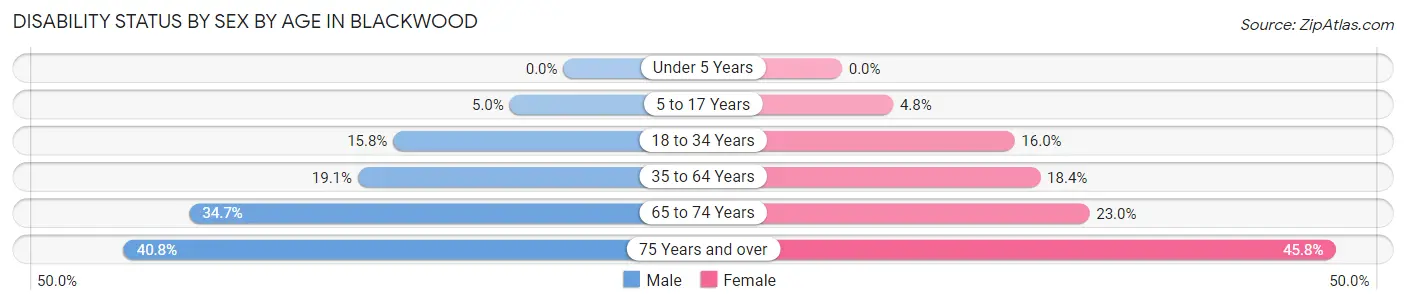
| Age Bracket | Male | Female |
| Under 5 Years | 0 (0.0%) | 0 (0.0%) |
| 5 to 17 Years | 20 (5.0%) | 19 (4.8%) |
| 18 to 34 Years | 81 (15.8%) | 99 (16.0%) |
| 35 to 64 Years | 172 (19.1%) | 157 (18.4%) |
| 65 to 74 Years | 76 (34.7%) | 48 (23.0%) |
| 75 Years and over | 31 (40.8%) | 87 (45.8%) |
Disability Class by Sex by Age in Blackwood
Disability Class: Hearing Difficulty
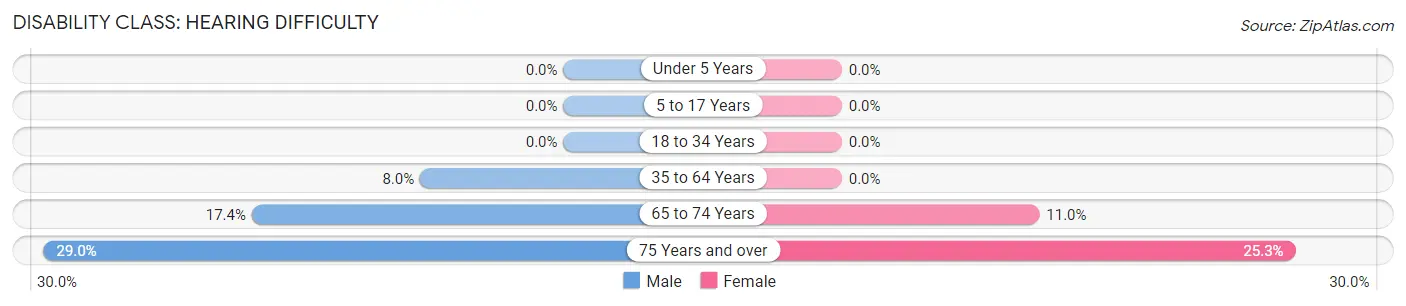
| Age Bracket | Male | Female |
| Under 5 Years | 0 (0.0%) | 0 (0.0%) |
| 5 to 17 Years | 0 (0.0%) | 0 (0.0%) |
| 18 to 34 Years | 0 (0.0%) | 0 (0.0%) |
| 35 to 64 Years | 72 (8.0%) | 0 (0.0%) |
| 65 to 74 Years | 38 (17.3%) | 23 (11.0%) |
| 75 Years and over | 22 (28.9%) | 48 (25.3%) |
Disability Class: Vision Difficulty
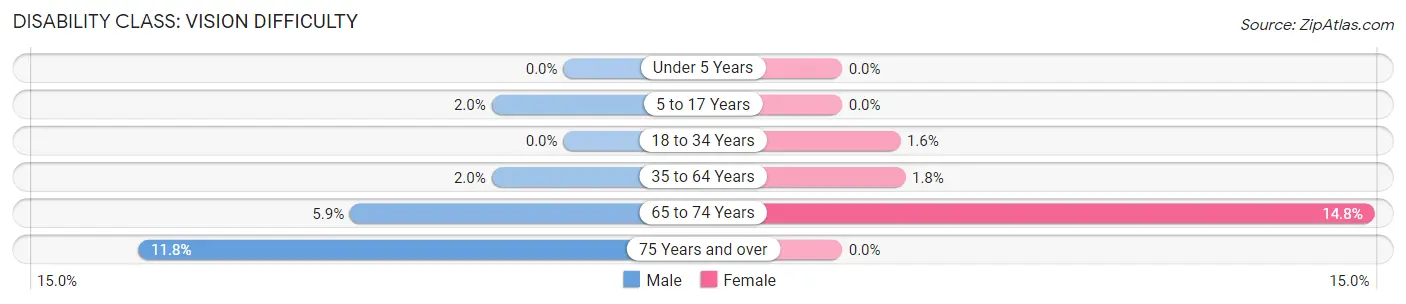
| Age Bracket | Male | Female |
| Under 5 Years | 0 (0.0%) | 0 (0.0%) |
| 5 to 17 Years | 8 (2.0%) | 0 (0.0%) |
| 18 to 34 Years | 0 (0.0%) | 10 (1.6%) |
| 35 to 64 Years | 18 (2.0%) | 15 (1.8%) |
| 65 to 74 Years | 13 (5.9%) | 31 (14.8%) |
| 75 Years and over | 9 (11.8%) | 0 (0.0%) |
Disability Class: Cognitive Difficulty
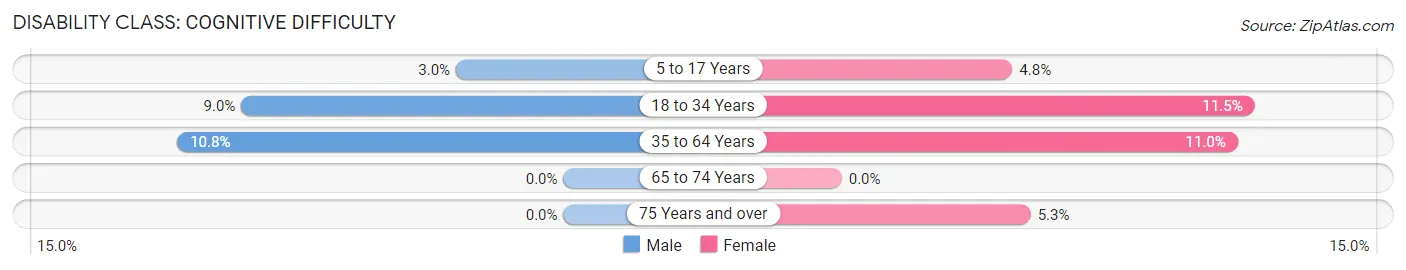
| Age Bracket | Male | Female |
| 5 to 17 Years | 12 (3.0%) | 19 (4.8%) |
| 18 to 34 Years | 46 (9.0%) | 71 (11.5%) |
| 35 to 64 Years | 97 (10.7%) | 94 (11.0%) |
| 65 to 74 Years | 0 (0.0%) | 0 (0.0%) |
| 75 Years and over | 0 (0.0%) | 10 (5.3%) |
Disability Class: Ambulatory Difficulty
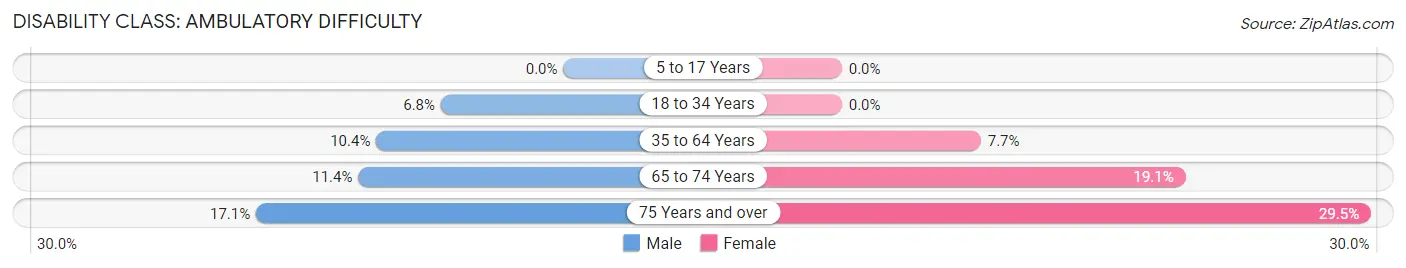
| Age Bracket | Male | Female |
| 5 to 17 Years | 0 (0.0%) | 0 (0.0%) |
| 18 to 34 Years | 35 (6.8%) | 0 (0.0%) |
| 35 to 64 Years | 94 (10.4%) | 66 (7.7%) |
| 65 to 74 Years | 25 (11.4%) | 40 (19.1%) |
| 75 Years and over | 13 (17.1%) | 56 (29.5%) |
Disability Class: Self-Care Difficulty
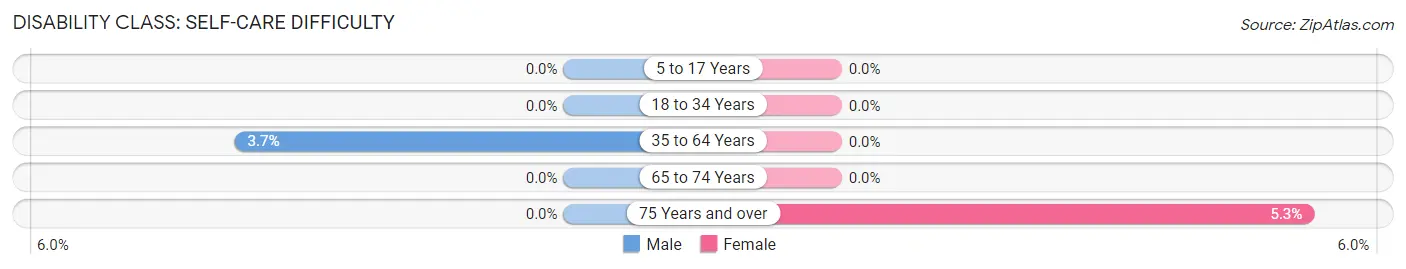
| Age Bracket | Male | Female |
| 5 to 17 Years | 0 (0.0%) | 0 (0.0%) |
| 18 to 34 Years | 0 (0.0%) | 0 (0.0%) |
| 35 to 64 Years | 33 (3.7%) | 0 (0.0%) |
| 65 to 74 Years | 0 (0.0%) | 0 (0.0%) |
| 75 Years and over | 0 (0.0%) | 10 (5.3%) |
Technology Access in Blackwood
Computing Device Access in Blackwood
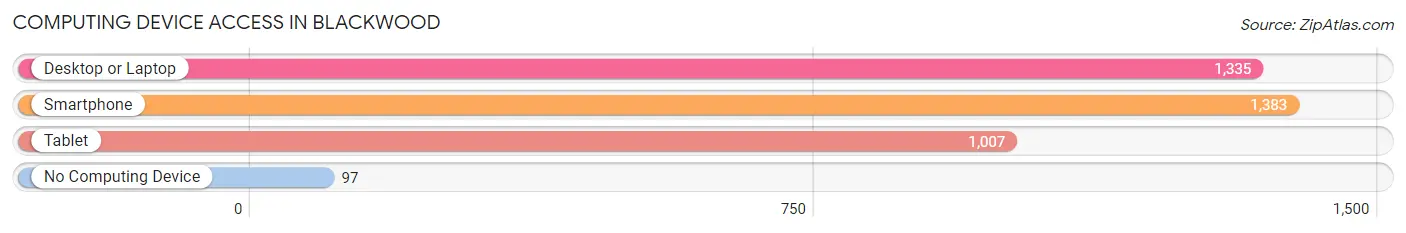
| Device Type | # Households | % Households |
| Desktop or Laptop | 1,335 | 82.5% |
| Smartphone | 1,383 | 85.5% |
| Tablet | 1,007 | 62.2% |
| No Computing Device | 97 | 6.0% |
| Total | 1,618 | 100.0% |
Internet Access in Blackwood
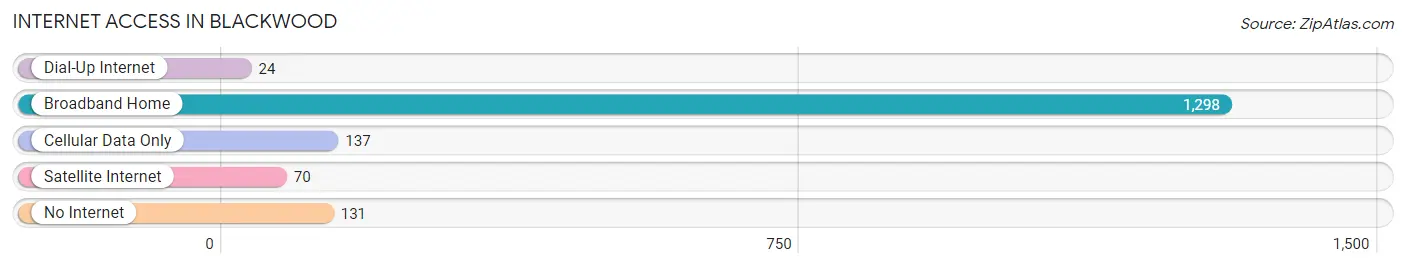
| Internet Type | # Households | % Households |
| Dial-Up Internet | 24 | 1.5% |
| Broadband Home | 1,298 | 80.2% |
| Cellular Data Only | 137 | 8.5% |
| Satellite Internet | 70 | 4.3% |
| No Internet | 131 | 8.1% |
| Total | 1,618 | 100.0% |
Blackwood Summary
Blackwood is a census-designated place (CDP) located in Gloucester Township, Camden County, New Jersey. It is located approximately 15 miles southeast of Philadelphia and is part of the Delaware Valley metropolitan area. As of the 2010 United States Census, the CDP's population was 8,384.
History
The area that is now Blackwood was originally inhabited by the Lenni Lenape Native Americans. The first European settlers arrived in the area in the late 1600s. The area was originally known as “Blackwoodtown” and was part of Gloucester Township. In 1871, the area was incorporated as a borough and was renamed “Blackwood”.
In the late 1800s, the area began to experience rapid growth due to the development of the railroad and the growth of the nearby city of Camden. The area was home to several large farms and was known for its production of fruits and vegetables.
In the early 1900s, the area began to experience a decline in population due to the Great Depression and the decline of the railroad industry. The area was also affected by the suburbanization of the 1950s and 1960s, which caused many people to move away from the city of Camden and into the suburbs.
Geography
Blackwood is located at 39°48'17" North, 75°2'45" West (39.804722, -75.045278). According to the United States Census Bureau, the CDP has a total area of 4.2 square miles, all of which is land.
The area is located in the Pine Barrens, a large area of pine forests and wetlands located in the southern part of New Jersey. The area is home to several species of wildlife, including white-tailed deer, red foxes, and wild turkeys.
Economy
The economy of Blackwood is largely based on retail and services. The area is home to several large shopping centers, including the Blackwood Towne Center and the Blackwood Plaza. The area is also home to several restaurants, banks, and other businesses.
The area is also home to several large employers, including Lockheed Martin, the University of Pennsylvania, and the Philadelphia Eagles.
Demographics
As of the 2010 United States Census, there were 8,384 people, 3,541 households, and 2,092 families residing in the CDP. The population density was 1,988.7 people per square mile. The racial makeup of the CDP was 79.2% White, 11.3% African American, 0.3% Native American, 3.2% Asian, 0.1% Pacific Islander, 3.2% from other races, and 3.0% from two or more races. Hispanic or Latino of any race were 8.2% of the population.
The median income for a household in the CDP was $60,938, and the median income for a family was $71,944. Males had a median income of $50,938 versus $41,944 for females. The per capita income for the CDP was $27,944. About 4.2% of families and 6.2% of the population were below the poverty line, including 8.2% of those under age 18 and 4.2% of those age 65 or over.
Conclusion
Blackwood is a census-designated place located in Gloucester Township, Camden County, New Jersey. It is located approximately 15 miles southeast of Philadelphia and is part of the Delaware Valley metropolitan area. As of the 2010 United States Census, the CDP's population was 8,384. The area was originally inhabited by the Lenni Lenape Native Americans and was incorporated as a borough in 1871. The economy of Blackwood is largely based on retail and services, and the area is home to several large employers. The population of Blackwood is largely White, with African Americans, Asians, and Hispanics making up the remainder of the population. The median income for a household in the CDP was $60,938, and the median income for a family was $71,944.
Common Questions
What is Per Capita Income in Blackwood?
Per Capita income in Blackwood is $37,494.
What is the Median Family Income in Blackwood?
Median Family Income in Blackwood is $83,716.
What is the Median Household income in Blackwood?
Median Household Income in Blackwood is $82,741.
What is Income or Wage Gap in Blackwood?
Income or Wage Gap in Blackwood is 56.0%.
Women in Blackwood earn 44.0 cents for every dollar earned by a man.
What is Inequality or Gini Index in Blackwood?
Inequality or Gini Index in Blackwood is 0.41.
What is the Total Population of Blackwood?
Total Population of Blackwood is 4,588.
What is the Total Male Population of Blackwood?
Total Male Population of Blackwood is 2,230.
What is the Total Female Population of Blackwood?
Total Female Population of Blackwood is 2,358.
What is the Ratio of Males per 100 Females in Blackwood?
There are 94.57 Males per 100 Females in Blackwood.
What is the Ratio of Females per 100 Males in Blackwood?
There are 105.74 Females per 100 Males in Blackwood.
What is the Median Population Age in Blackwood?
Median Population Age in Blackwood is 37.5 Years.
What is the Average Family Size in Blackwood
Average Family Size in Blackwood is 3.2 People.
What is the Average Household Size in Blackwood
Average Household Size in Blackwood is 2.8 People.
How Large is the Labor Force in Blackwood?
There are 2,530 People in the Labor Forcein in Blackwood.
What is the Percentage of People in the Labor Force in Blackwood?
67.3% of People are in the Labor Force in Blackwood.
What is the Unemployment Rate in Blackwood?
Unemployment Rate in Blackwood is 6.6%.