Zip Codes with the Highest Percentage of Population with a Degree in Visual and Performing Arts in Columbia, MO
RELATED REPORTS & OPTIONS
Visual and Performing Arts
Columbia
Compare Zip Codes
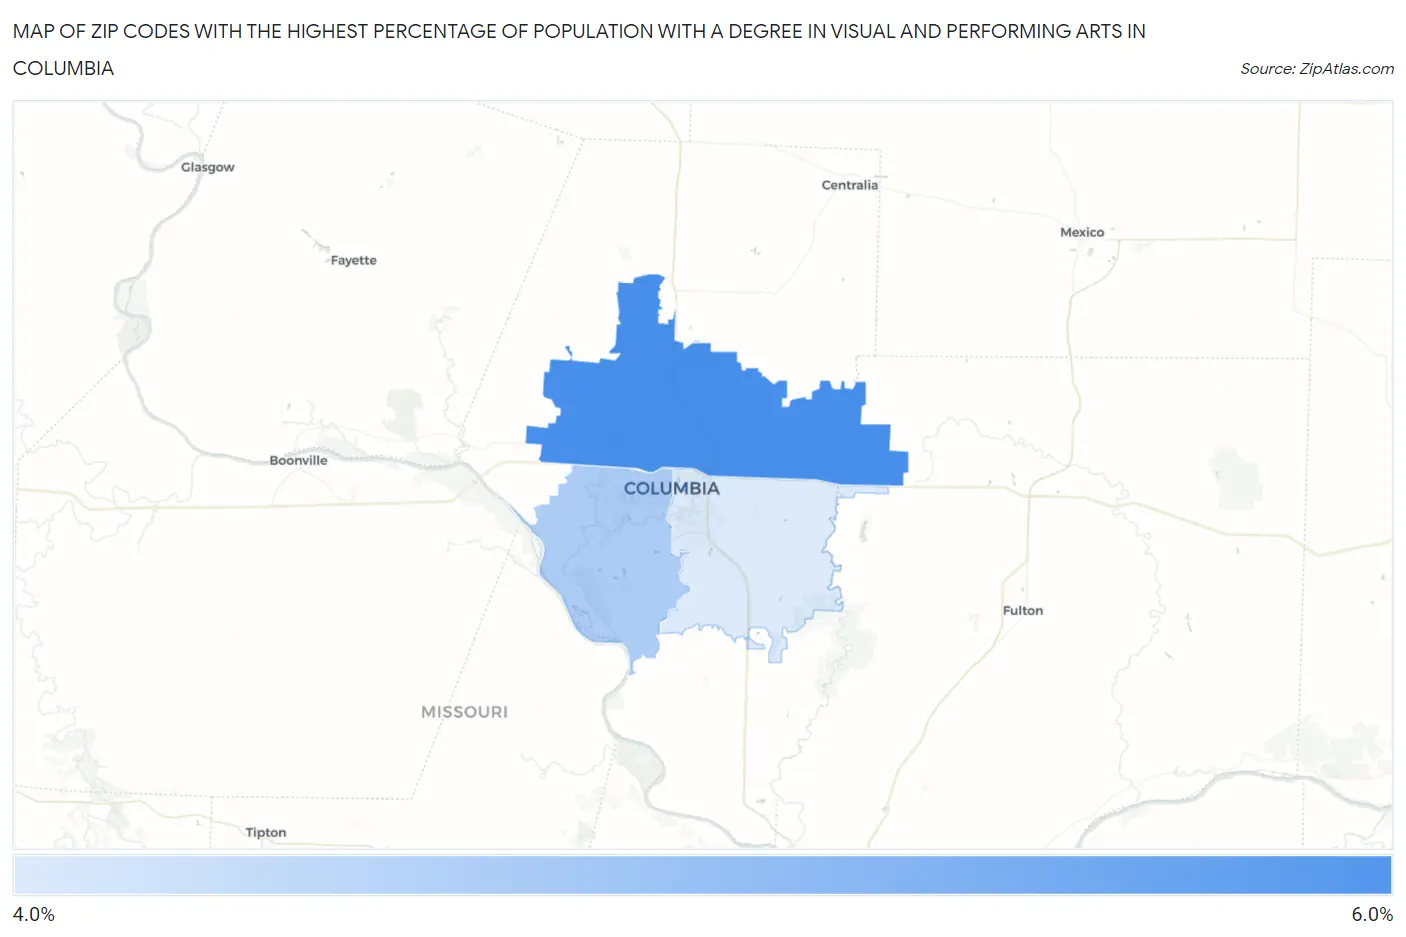
Map of Zip Codes with the Highest Percentage of Population with a Degree in Visual and Performing Arts in Columbia
4.3%
5.4%
Zip Codes with the Highest Percentage of Population with a Degree in Visual and Performing Arts in Columbia, MO
| Zip Code | % Graduates | vs State | vs National | |
| 1. | 65202 | 5.4% | 3.8%(+1.59)#137 | 4.3%(+1.11)#5,924 |
| 2. | 65203 | 4.6% | 3.8%(+0.850)#166 | 4.3%(+0.369)#7,497 |
| 3. | 65201 | 4.3% | 3.8%(+0.498)#193 | 4.3%(+0.017)#8,437 |
1
Common Questions
What are the Top 3 Zip Codes with the Highest Percentage of Population with a Degree in Visual and Performing Arts in Columbia, MO?
Top 3 Zip Codes with the Highest Percentage of Population with a Degree in Visual and Performing Arts in Columbia, MO are:
What zip code has the Highest Percentage of Population with a Degree in Visual and Performing Arts in Columbia, MO?
65202 has the Highest Percentage of Population with a Degree in Visual and Performing Arts in Columbia, MO with 5.4%.
What is the Percentage of Population with a Degree in Visual and Performing Arts in Columbia, MO?
Percentage of Population with a Degree in Visual and Performing Arts in Columbia is 4.8%.
What is the Percentage of Population with a Degree in Visual and Performing Arts in Missouri?
Percentage of Population with a Degree in Visual and Performing Arts in Missouri is 3.8%.
What is the Percentage of Population with a Degree in Visual and Performing Arts in the United States?
Percentage of Population with a Degree in Visual and Performing Arts in the United States is 4.3%.