Zip Codes with the Highest Percentage of Population with a Degree in Visual and Performing Arts in Chesterfield, MO
RELATED REPORTS & OPTIONS
Visual and Performing Arts
Chesterfield
Compare Zip Codes
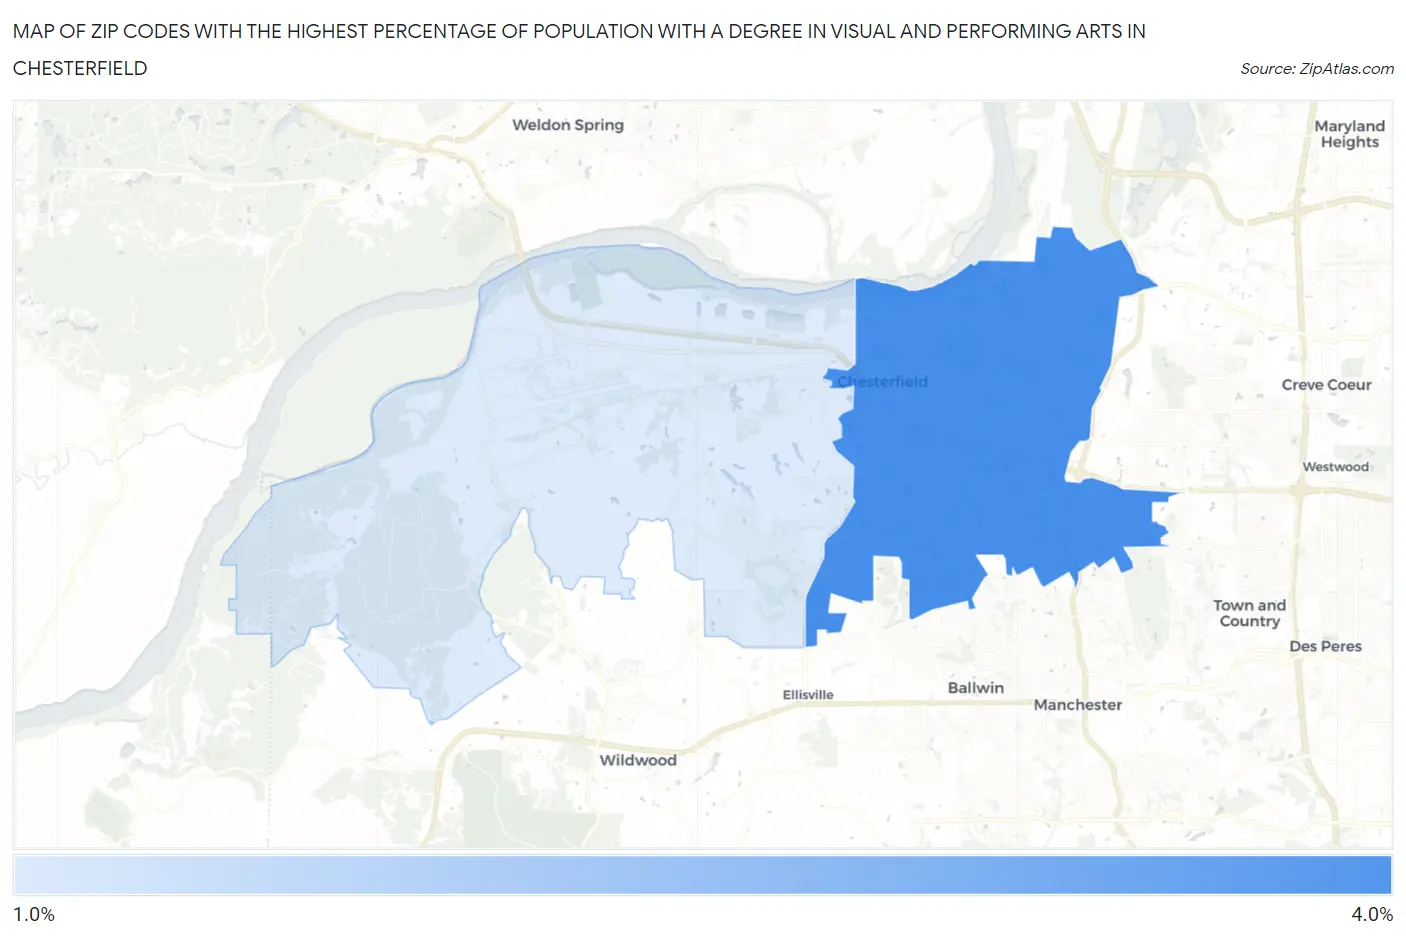
Map of Zip Codes with the Highest Percentage of Population with a Degree in Visual and Performing Arts in Chesterfield
1.7%
3.2%
Zip Codes with the Highest Percentage of Population with a Degree in Visual and Performing Arts in Chesterfield, MO
| Zip Code | % Graduates | vs State | vs National | |
| 1. | 63017 | 3.2% | 3.8%(-0.581)#296 | 4.3%(-1.06)#12,024 |
| 2. | 63005 | 1.7% | 3.8%(-2.07)#425 | 4.3%(-2.55)#17,501 |
1
Common Questions
What are the Top Zip Codes with the Highest Percentage of Population with a Degree in Visual and Performing Arts in Chesterfield, MO?
Top Zip Codes with the Highest Percentage of Population with a Degree in Visual and Performing Arts in Chesterfield, MO are:
What zip code has the Highest Percentage of Population with a Degree in Visual and Performing Arts in Chesterfield, MO?
63017 has the Highest Percentage of Population with a Degree in Visual and Performing Arts in Chesterfield, MO with 3.2%.
What is the Percentage of Population with a Degree in Visual and Performing Arts in Chesterfield, MO?
Percentage of Population with a Degree in Visual and Performing Arts in Chesterfield is 2.5%.
What is the Percentage of Population with a Degree in Visual and Performing Arts in Missouri?
Percentage of Population with a Degree in Visual and Performing Arts in Missouri is 3.8%.
What is the Percentage of Population with a Degree in Visual and Performing Arts in the United States?
Percentage of Population with a Degree in Visual and Performing Arts in the United States is 4.3%.