Zip Codes with the Highest Percentage of Population with a Degree in Visual and Performing Arts in Independence, MO
RELATED REPORTS & OPTIONS
Visual and Performing Arts
Independence
Compare Zip Codes
Map of Zip Codes with the Highest Percentage of Population with a Degree in Visual and Performing Arts in Independence
3.2%
20.0%
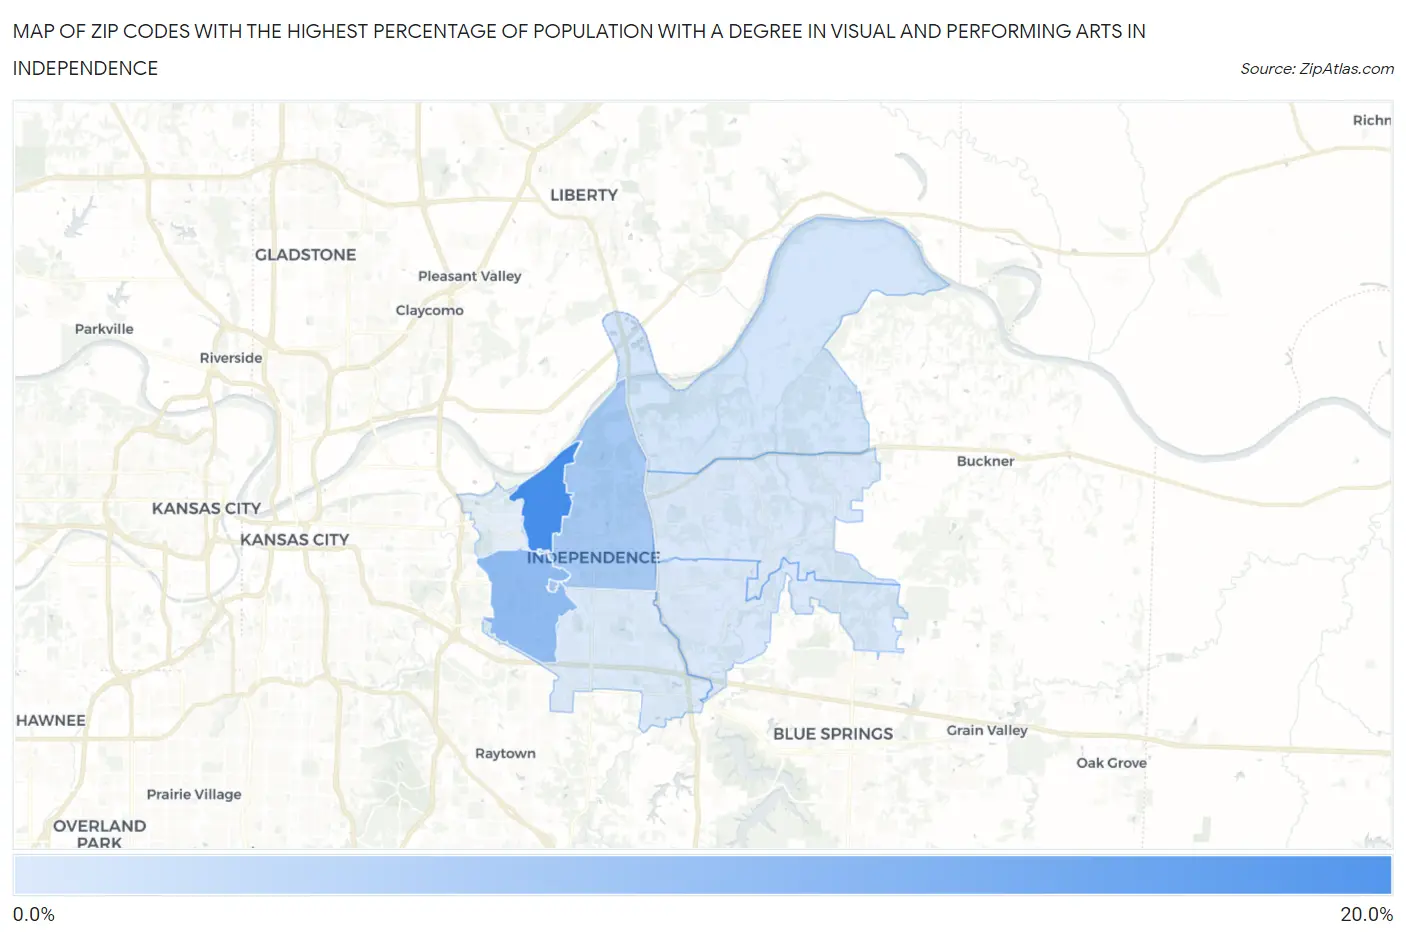
Zip Codes with the Highest Percentage of Population with a Degree in Visual and Performing Arts in Independence, MO
| Zip Code | % Graduates | vs State | vs National | |
| 1. | 64054 | 20.0% | 3.8%(+16.2)#14 | 4.3%(+15.7)#472 |
| 2. | 64052 | 11.5% | 3.8%(+7.77)#39 | 4.3%(+7.29)#1,388 |
| 3. | 64050 | 8.9% | 3.8%(+5.12)#60 | 4.3%(+4.63)#2,314 |
| 4. | 64058 | 4.3% | 3.8%(+0.495)#194 | 4.3%(+0.014)#8,450 |
| 5. | 64057 | 3.5% | 3.8%(-0.280)#267 | 4.3%(-0.761)#10,912 |
| 6. | 64056 | 3.5% | 3.8%(-0.320)#273 | 4.3%(-0.801)#11,074 |
| 7. | 64055 | 3.2% | 3.8%(-0.540)#293 | 4.3%(-1.02)#11,868 |
1
Common Questions
What are the Top 5 Zip Codes with the Highest Percentage of Population with a Degree in Visual and Performing Arts in Independence, MO?
Top 5 Zip Codes with the Highest Percentage of Population with a Degree in Visual and Performing Arts in Independence, MO are:
What zip code has the Highest Percentage of Population with a Degree in Visual and Performing Arts in Independence, MO?
64054 has the Highest Percentage of Population with a Degree in Visual and Performing Arts in Independence, MO with 20.0%.
What is the Percentage of Population with a Degree in Visual and Performing Arts in Independence, MO?
Percentage of Population with a Degree in Visual and Performing Arts in Independence is 4.8%.
What is the Percentage of Population with a Degree in Visual and Performing Arts in Missouri?
Percentage of Population with a Degree in Visual and Performing Arts in Missouri is 3.8%.
What is the Percentage of Population with a Degree in Visual and Performing Arts in the United States?
Percentage of Population with a Degree in Visual and Performing Arts in the United States is 4.3%.