Zip Codes with the Highest Percentage of Population with a Degree in Visual and Performing Arts in Saint Charles, MO
RELATED REPORTS & OPTIONS
Visual and Performing Arts
Saint Charles
Compare Zip Codes
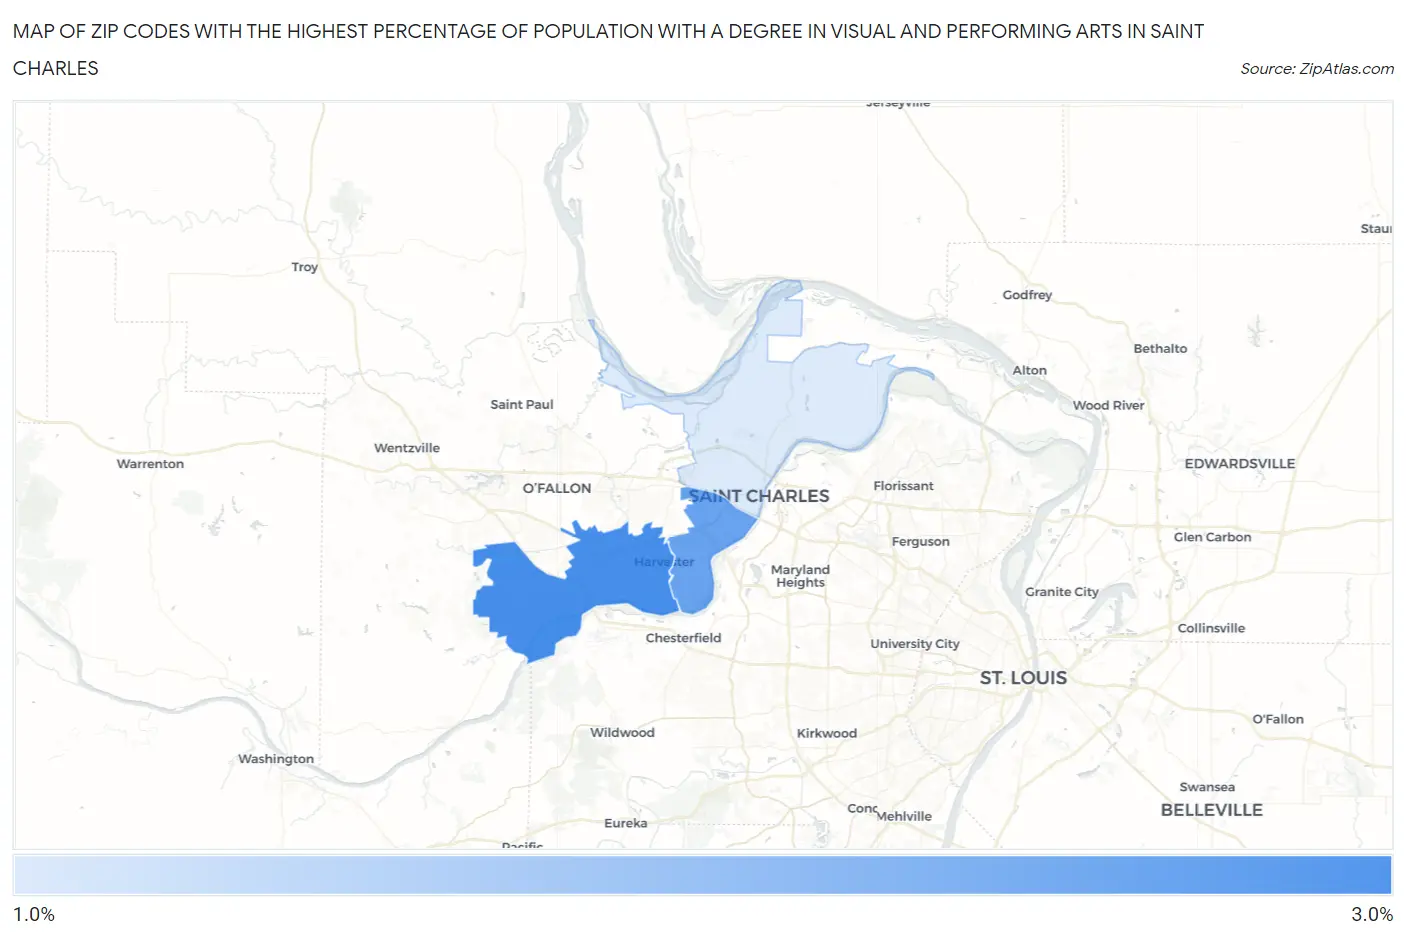
Map of Zip Codes with the Highest Percentage of Population with a Degree in Visual and Performing Arts in Saint Charles
2.0%
2.8%
Zip Codes with the Highest Percentage of Population with a Degree in Visual and Performing Arts in Saint Charles, MO
| Zip Code | % Graduates | vs State | vs National | |
| 1. | 63304 | 2.8% | 3.8%(-0.941)#325 | 4.3%(-1.42)#13,368 |
| 2. | 63303 | 2.6% | 3.8%(-1.14)#341 | 4.3%(-1.62)#14,136 |
| 3. | 63301 | 2.0% | 3.8%(-1.81)#409 | 4.3%(-2.29)#16,596 |
1
Common Questions
What are the Top Zip Codes with the Highest Percentage of Population with a Degree in Visual and Performing Arts in Saint Charles, MO?
Top Zip Codes with the Highest Percentage of Population with a Degree in Visual and Performing Arts in Saint Charles, MO are:
What zip code has the Highest Percentage of Population with a Degree in Visual and Performing Arts in Saint Charles, MO?
63304 has the Highest Percentage of Population with a Degree in Visual and Performing Arts in Saint Charles, MO with 2.8%.
What is the Percentage of Population with a Degree in Visual and Performing Arts in Missouri?
Percentage of Population with a Degree in Visual and Performing Arts in Missouri is 3.8%.
What is the Percentage of Population with a Degree in Visual and Performing Arts in the United States?
Percentage of Population with a Degree in Visual and Performing Arts in the United States is 4.3%.