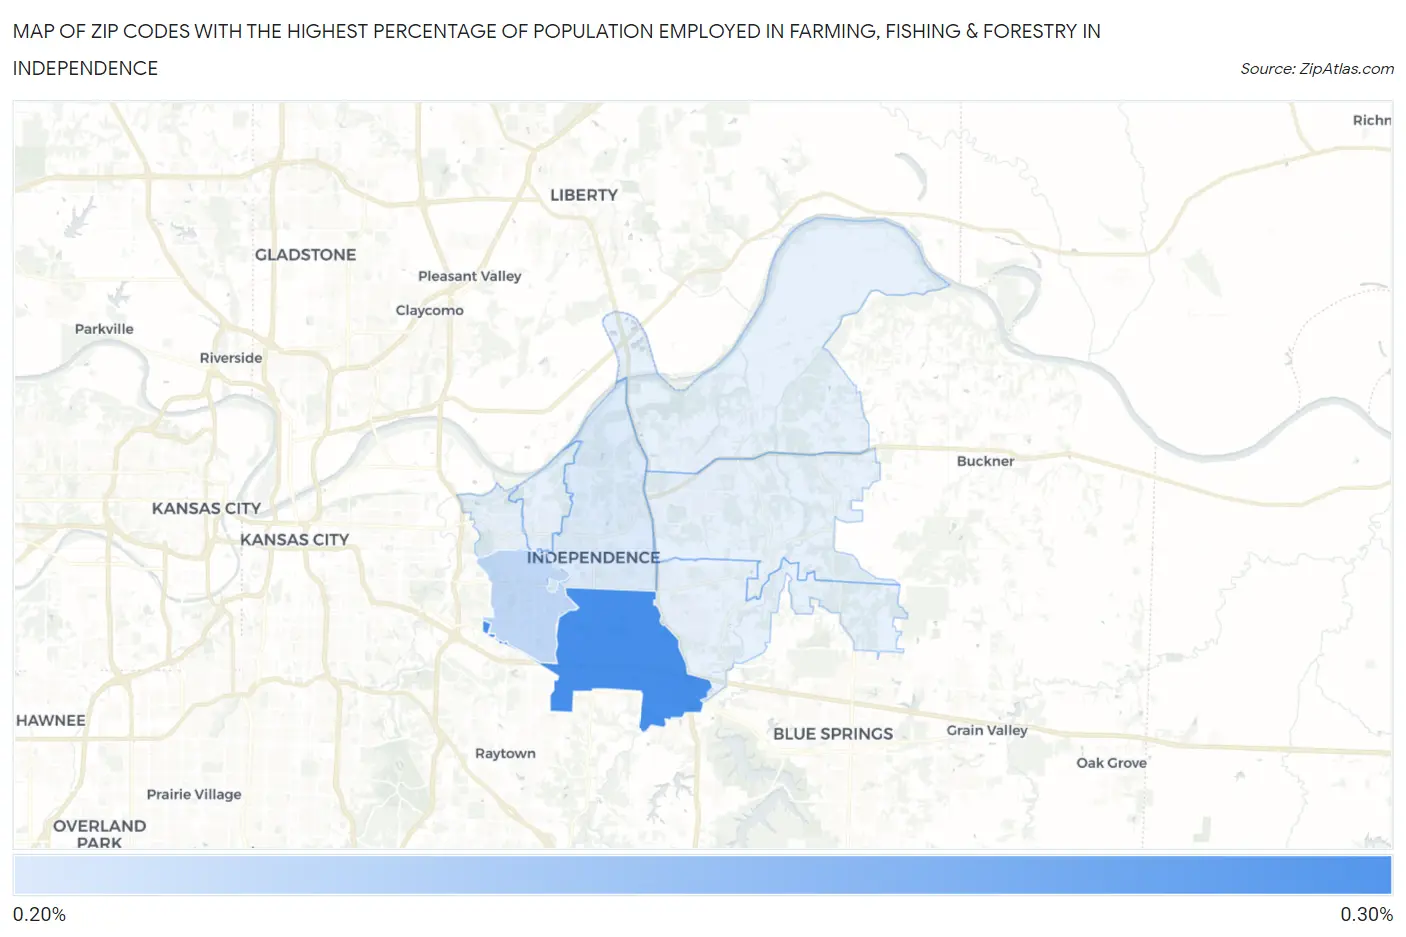
Zip Codes with the Highest Percentage of Population Employed in Farming, Fishing & Forestry in Independence, MO
RELATED REPORTS & OPTIONS
Farming, Fishing & Forestry
Independence
Compare Zip Codes
Map of Zip Codes with the Highest Percentage of Population Employed in Farming, Fishing & Forestry in Independence
0.22%
0.28%
Zip Codes with the Highest Percentage of Population Employed in Farming, Fishing & Forestry in Independence, MO
| Zip Code | % Employed | vs State | vs National | |
| 1. | 64055 | 0.28% | 0.49%(-0.205)#492 | 0.61%(-0.322)#15,020 |
| 2. | 64052 | 0.23% | 0.49%(-0.260)#508 | 0.61%(-0.377)#15,707 |
| 3. | 64050 | 0.22% | 0.49%(-0.273)#516 | 0.61%(-0.389)#15,904 |
1
Common Questions
What are the Top 5 Zip Codes with the Highest Percentage of Population Employed in Farming, Fishing & Forestry in Independence, MO?
Top 5 Zip Codes with the Highest Percentage of Population Employed in Farming, Fishing & Forestry in Independence, MO are:
What zip code has the Highest Percentage of Population Employed in Farming, Fishing & Forestry in Independence, MO?
64055 has the Highest Percentage of Population Employed in Farming, Fishing & Forestry in Independence, MO with 0.28%.
What is the Percentage of Population Employed in Farming, Fishing & Forestry in Independence, MO?
Percentage of Population Employed in Farming, Fishing & Forestry in Independence is 0.16%.
What is the Percentage of Population Employed in Farming, Fishing & Forestry in Missouri?
Percentage of Population Employed in Farming, Fishing & Forestry in Missouri is 0.49%.
What is the Percentage of Population Employed in Farming, Fishing & Forestry in the United States?
Percentage of Population Employed in Farming, Fishing & Forestry in the United States is 0.61%.