Zip Codes with the Highest Percentage of Population Employed in Production in Independence, MO
RELATED REPORTS & OPTIONS
Production
Independence
Compare Zip Codes
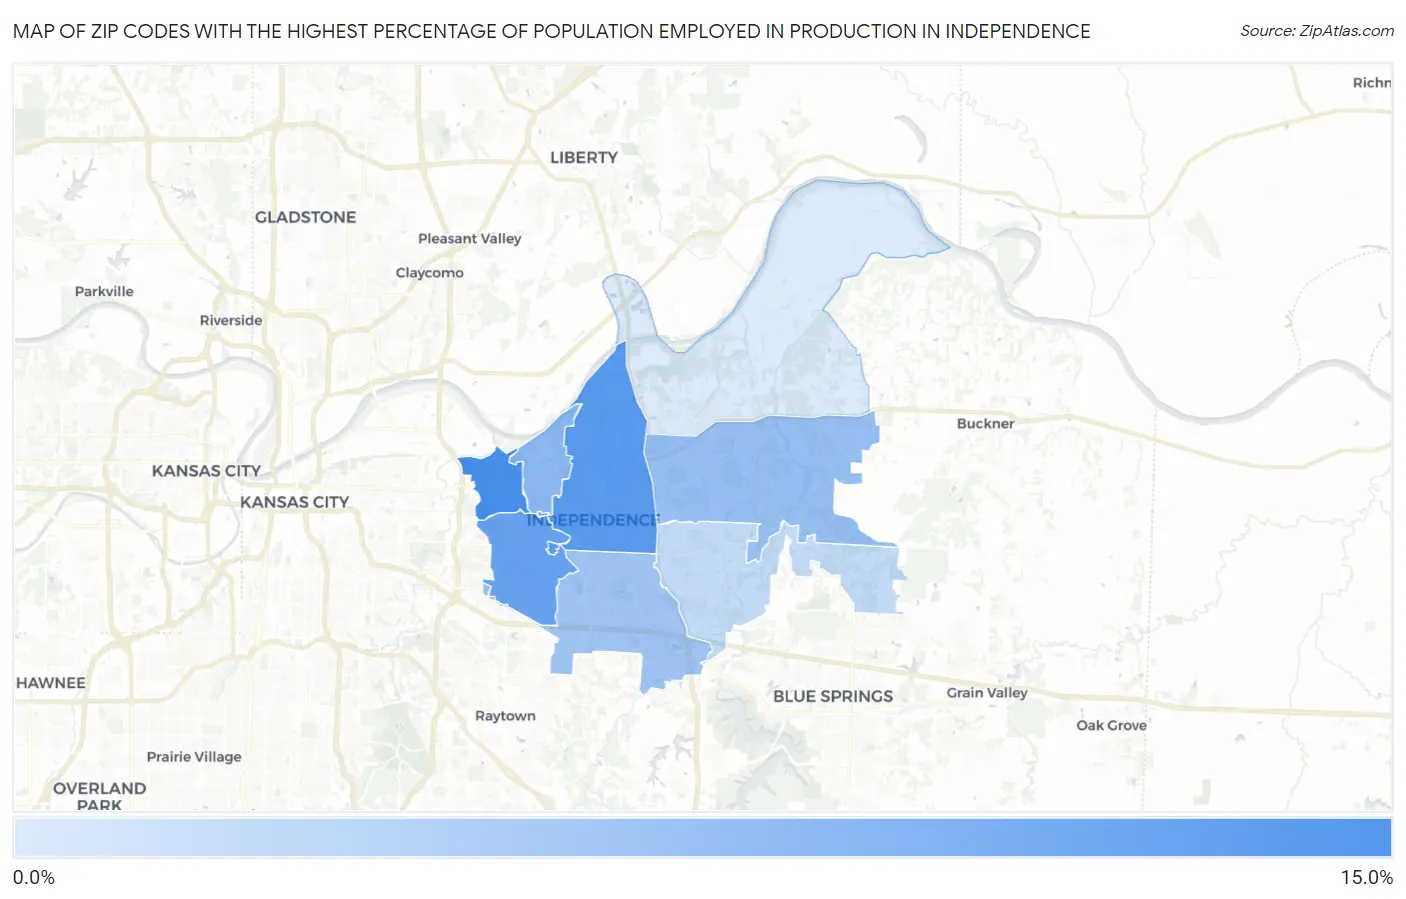
Map of Zip Codes with the Highest Percentage of Population Employed in Production in Independence
3.3%
11.8%
Zip Codes with the Highest Percentage of Population Employed in Production in Independence, MO
| Zip Code | % Employed | vs State | vs National | |
| 1. | 64053 | 11.8% | 6.6%(+5.21)#263 | 5.5%(+6.33)#5,652 |
| 2. | 64050 | 10.9% | 6.6%(+4.32)#314 | 5.5%(+5.44)#6,641 |
| 3. | 64052 | 9.9% | 6.6%(+3.32)#363 | 5.5%(+4.44)#7,959 |
| 4. | 64054 | 7.8% | 6.6%(+1.24)#495 | 5.5%(+2.36)#11,343 |
| 5. | 64056 | 7.1% | 6.6%(+0.512)#548 | 5.5%(+1.63)#12,836 |
| 6. | 64055 | 6.6% | 6.6%(-0.004)#591 | 5.5%(+1.12)#13,895 |
| 7. | 64057 | 4.6% | 6.6%(-1.96)#732 | 5.5%(-0.843)#18,651 |
| 8. | 64058 | 3.3% | 6.6%(-3.33)#816 | 5.5%(-2.21)#22,374 |
1
Common Questions
What are the Top 5 Zip Codes with the Highest Percentage of Population Employed in Production in Independence, MO?
Top 5 Zip Codes with the Highest Percentage of Population Employed in Production in Independence, MO are:
What zip code has the Highest Percentage of Population Employed in Production in Independence, MO?
64053 has the Highest Percentage of Population Employed in Production in Independence, MO with 11.8%.
What is the Percentage of Population Employed in Production in Independence, MO?
Percentage of Population Employed in Production in Independence is 7.7%.
What is the Percentage of Population Employed in Production in Missouri?
Percentage of Population Employed in Production in Missouri is 6.6%.
What is the Percentage of Population Employed in Production in the United States?
Percentage of Population Employed in Production in the United States is 5.5%.